DOI:
10.1039/D4RA06055E
(Paper)
RSC Adv., 2024,
14, 35336-35347
Visible light driven degradation of BPA and LDPE microplastic films using GO/SCN nanocomposite
Received
21st August 2024
, Accepted 23rd October 2024
First published on 5th November 2024
Abstract
A sonication assisted method was employed to prepare a graphene oxide (GO)/sulfur doped carbon nitride (SCN) nanocomposite, demonstrating enhanced photocatalytic activity compared to GO and SCN. Extensive characterization confirmed the improved properties of the nanocomposite. X-ray Diffraction (XRD) results indicated that the SCN lattice remained intact upon GO addition while Fourier-transform infrared spectroscopy (FTIR) revealed chemical interaction between GO and SCN. X-ray photoelectron spectroscopy (XPS) confirmed sulfur incorporation into the graphitic carbon nitride (g-C3N4) lattice. Scanning electron microscopy (SEM) and Transmission Electron Microscopy (TEM) highlighted the distinct morphological features of GO, SCN, and GO/SCN nanocomposites, with SCN showing flat, thin nanosheets and GO displaying flake-like layers, both contributing to a high surface area and mechanical strength. In the GO/SCN nanocomposite, these structures were intermixed, enhancing surface area, mechanical stability, and electron mobility, which contributed to the improved catalytic performance. Ultraviolet-visible diffuse reflectance spectroscopy (UV-DRS) showed a reduction in band gap energy from 2.62 eV for SCN to 2.52 eV for the GO/SCN composite, leading to enhanced visible light absorption. Under visible light irradiation, low density polyethene (LDPE) films experienced significant degradation, evidenced by a 21% weight loss after 10 days, supported by SEM analyses showcasing surface changes on the LDPE films. The degradation was further confirmed by an increase in the carbonyl index (C.I.) from 0.37 to 1.24, measured through FTIR analyses, indicating oxidation corroborating the degradation process. Furthermore, BPA degradation reached 89.5% within 60 minutes under visible light irradiation. Radical trapping experiments confirmed hydroxyl radicals (˙OH) as the active oxygen species involved in the degradation of BPA.
1. Introduction
Today's world has a tremendous problem with environmental contamination, making the development of efficient remediation techniques much more crucial than before. Due to their widespread presence and potential harm, two contaminants that pose a particular concern to our ecosystems and water resources are Low-Density Polyethylene (LDPE) microplastics and bisphenol A (BPA). BPA is used in a variety of industrial applications and is an endocrine disruptor; it serves as an important component in making rubber, epoxy resins, and polycarbonate plastics, among others. It has been found that BPA plays a vital role in the hormonal system; thus, infertility, obesity, cancer, and developmental disorders like ADHD are at stake for humans and animals.1–4 In contrast, LDPE microplastics, which originate from polyethylene polymers, are one of the most widely used materials in the world because of their low cost, good quality, and resilience to chemicals. However, their durability poses a major environmental threat because they remain undecomposed for hundreds of years.5 In freshwater and marine habitats, LDPE microplastics cause ingestion, entanglement and habitat disruption, endangering aquatic life. They also make it impossible for the affected fish to wrap their mouths around the bait, which poses a risk to humans, as when fish are contaminated, their consumption by humans is seen as part of the food chain.6
Addressing the challenges posed by these pollutants requires innovative approaches to water and wastewater treatment. Various methods, such as mechanical recycling, incineration, biodegradation, and chemical treatment, are in use to degrade BPA and LDPE, each of these methods has its limitations, such as incomplete degradation, high energy requirements, or the generation of secondary pollutants.7 Advanced oxidation processes (AOPs) are one of the choices that offer both effectiveness and versatility, hence remaining as one of the promising solutions.8–10 AOPs rely on reactive oxygen species that degrade organic contaminants, hence giving a comprehensive solution in terms of pollutant removal, like BPA and LDPE microplastics. Among the many AOPs, photocatalytic degradation stands out as one of the most promising techniques due to its ability to utilize light energy to generate reactive species that can effectively break down complex contaminants. The search for efficient photocatalysts has led to the exploration of materials that can enhance the photocatalytic degradation of pollutants, with graphitic carbon nitride (g-C3N4) and graphene oxide (GO) emerging as strong candidates due to their complementary properties.
g-C3N4 is recognized for its unique layered structure, easy fabrication, optimum band gap (about 2.7 eV), suitable visible light sensitivity, and excellent thermal and chemical stability, making it suitable fot photocatalytic applications.11 However, the photocatalytic efficacy of pristine g-C3N4 is restricted by its intrinsic properties such as poor charge-transfer mobility, limited active sites for photocatalysis, limited light absorption range, and high recombination rate of photo-generated carriers.12 Different ground-breaking strategies have been cultivated and carried out so as to cope with these shortcomings, which include structural alterations, doping with metal or non-metal elements and defect engineering. Among these approaches, doping g-C3N4 with non-metal heteroatoms, such as sulfur, has proven to be particularly effective.13 Sulfur-doped g-C3N4 (SCN) broadens light absorption range and modify the surface electronic properties due to electronegativity difference between carbon, nitrogen, and sulfur atoms.14 This improves the potential of material to better harness the visible light and make it more effective in generating reactive species responsible for pollutant degradation. Sulfur is also an abundant and inexpensive element, thus adding practicality to this approach.15
In parallel, graphene oxide (GO) has gained recognition for its high surface area, excellent electron mobility, and strong adsorption capabilities. The oxygen-containing functional groups on GO's surface make it highly dispersible in water and enable strong interactions with pollutants.16 GO's remarkable electron mobility enhances charge separation in photocatalytic systems, helping to suppress electron–hole recombination and improve photocatalytic efficiency. Furthermore, GO's high adsorption capacity facilitates the concentration of pollutants on its surface, enabling more effective degradation.16–18 These characteristics make GO an ideal partner for enhancing the photocatalytic properties of materials like g-C3N4.
The combination of sulfur-doped g-C3N4 (SCN) with GO creates a promising composite material for environmental remediation. GO's ability to improve charge separation and its high adsorption properties synergize with SCN's enhanced light absorption and electronic properties, leading to more efficient pollutant degradation than either material alone. The GO/SCN composite not only extends light absorption into the visible range but also provides additional active sites for photocatalysis, resulting in improved degradation of complex pollutants such as BPA and LDPE microplastics. Compared to other g-C3N4-based composites, the GO/SCN composite exhibits superior photocatalytic performance due to the unique structural and electronic interactions between GO and SCN, which optimize charge transfer and pollutant removal.
Thus, this study focuses on the GO/SCN composite for the photocatalytic degradation of BPA and LDPE microplastics, addressing the challenges of durability and pollutant removal. By combining the high surface area and adsorption properties of GO with the visible light responsiveness and enhanced photocatalytic activity of SCN, our research contributes to the growing field of advanced materials for environmental applications, offering a more effective solution for degrading persistent pollutants.
2. Experimental section
2.1. Materials and method
All the chemicals utilized in this study were acquired from Sigma Aldrich and were used in their original form without additional purification. The chemicals included thiourea (≥99.0%), ethanol (98%), hydrogen peroxide (30%), sulfuric acid (98%), graphite powder (99%), hydrochloric acid (37%), potassium permanganate (≥99.0%) and deionized water.
2.2. Synthesis of SCN
SCN was synthesized via a facile and efficient thermal polymerization technique. Specifically, 6 g of thiourea was heated under controlled conditions in a muffle furnace, all contained in a lidded alumina crucible. The temperature was incrementally raised at a rate of 2.8 °C per minute until reaching 550 °C, where it was maintained for 3 hours to facilitate polymerization. Upon completion of the heating cycle, the furnace was left to cool naturally to ambient temperature. The resultant yellow product was subsequently collected and mechanically ground into fine powders. This powdered material was deemed suitable for subsequent applications without necessitating further purification.19 Similarly, pristine g-C3N4 was prepared using urea as the precursor instead of thiourea, following the same thermal polymerization method.
2.3. Synthesis of GO
GO was produced from natural graphite powder employing a tailored variation of Hummers' method.20 In an ice bath, 1 g of graphite powder was first dissolved in 25 mL H2SO4. Then, 3 g of KMnO4 was added gradually while stirring briskly at 35 °C for 30 min. After that, 30 mL of 30% H2O2 solution and 140 mL of water were added one after the other. After filtering, the precipitate was washed with 50 mL of 10% HCl aqueous solution and with distilled water until pH = 7. The resulting powder was vacuum-dried for ten hours at 45 °C. To create a dispersion, a fixed amount of the synthesized GO powder was also ultrasonically dispersed in 100 mL of deionized water for 10 hours, ensuring the attainment of a solution with a consistent concentration. Furthermore, the ultrasonication procedure aids in achieving fully exfoliated GO, yielding thin-layered GO nanosheets.
2.4. Synthesis of GO/SCN
The GO/SCN composite was fabricated using an ultrasonication technique. Initially, 0.1 g of synthesized SCN powder was dissolved in methanol. This dispersion was then combined with a specific volume of a solution containing thin-layered GO nanosheets.21 The resulting liquid was subjected to ultrasonication using a bath sonicator for 60 minutes with continuous sonication mode at a temperature of approximately 27 °C. After sonication, the mixture was dried at 80 °C for 12 hours in an oven, yielding the GO/SCN photocatalyst. Additionally, the composites GO1/SCN, GO2/SCN, GO3/SCN, GO4/SCN, and GO5/SCN were prepared by using different volumes of GO (1 mL, 2 mL, 3 mL, 4 mL, and 5 mL, respectively) during the synthesis procedure. Furthermore, graphene oxide/g-C3N4 (GO/CN) nanocompsite was prepared in a similar manner, using g-C3N4 instead of SCN. The overall synthesis procedure of the GO/SCN photocatalyst is illustrated in Fig. 1.
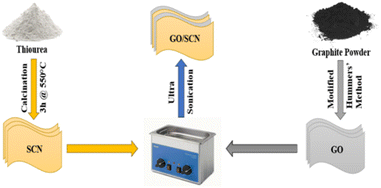 |
| | Fig. 1 Schematic representation of the synthesis process of GO, SCN and GO/SCN. | |
3. Experimental setup
The photodegradation experiment of LDPE films, was conducted in a closed wooden box with two 250 W tungsten lamps, which were kept on continuously to provide consistent light exposure throughout the 10 days period. The lamps were turned off briefly each day only to remove the LDPE films for weight measurements to calculate weight loss. To prevent overheating, the box was equipped with an exhaust fan to ensure proper airflow and avoid excessive heat buildup.22,23 The distance between the lamp housing and the LDPE film surface was maintained at 10 cm The dimensions of LDPE films were 2 cm × 2 cm while its thickness is 50 microns. After the 10 days duration, the LDPE films were subjected to FTIR and SEM analysis to investigate changes in carbonyl index and surface morphology changes of the films. For the photocatalytic experiments with BPA, 20 mg of BPA was added into a flask containing 1 Liter deionized water. 10 mg of photocatalyst was added into 100 mL of stock BPA solution. The solution was stirred and left in the dark for half an hour before to radiation exposure in order to achieve adsorption–desorption equilibrium. During irradiation, 5 mL samples of the suspension were extracted at 20 minutes intervals and centrifuged to obtain photocatalyst. UV-visible spectrophotometry was used to measure the maximum absorbance (λmax) of BPA and calculate the photodegradation efficiency (%) of BPA.24
4. Characterizations
4.1. X-ray diffraction (XRD)
The XRD analysis within the 5–80° range, as shown in Fig. 2 highlights the structural features of GO, SCN, and their nanocomposite GO/SCN. GO exhibited a prominent peak at 11.6°, corresponding to the graphene oxide (002) plane, with an additional smaller peak at 41.1° corresponding to (101).25 The pure SCN displayed distinctive peaks at 12.8° and 27.5°, while a slight peak at 12.8° indicated the presence of regularly recurring heptazine units on the (100) plane. The prominent tip at 27.5° represented stacking of the π-conjugated aromatic structure of g-C3N4 layers on the (002) plane. The XRD pattern of the GO/SCN composite showed similar peaks to pure SCN, suggesting that the addition of GO did not alter the lattice structure of SCN. However, because of low amount of GO, the characteristic peaks of GO were not evident in the GO/SCN. This observation aligns with previous studies reporting similar XRD patterns when incorporating low GO contents into pure SCN.26,27
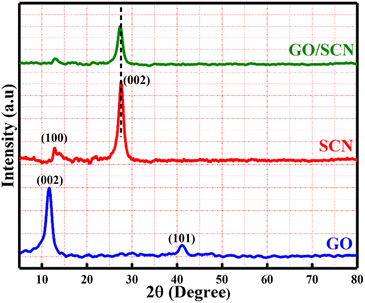 |
| | Fig. 2 XRD patterns of GO, SCN, and GO/SCN nanocomposites. | |
4.2. Fourier transform infrared spectroscopy (FTIR)
The chemical composition and intermolecular interaction in the nanocomposite have been analysed using FTIR. The spectral data of GO, SCN, and the GO/SCN composite are presented in Fig. 3. For pure GO, a peak between 3500 cm−1 and 2500 cm−1 is accountable to the carboxyl O–H stretching. Around 3400 cm−1 overlapping of peak on the OH stretch of carboxylic acids indicates the existence of alcohol groups and adsorbed water molecules. The asymmetric CH2 stretching of GO is shown with a peak at 2976 cm−1. Characteristic absorption peaks can be identified at 1104 cm−1 (alkoxy C–O stretching), 1249 cm−1 (phenolic C–OH stretching), and 1388 cm−1 (carbonyl O–H stretching). A peak around 1620 cm−1 corresponds to C![[double bond, length as m-dash]](https://www.rsc.org/images/entities/char_e001.gif) C stretching from unoxidized graphitic domains, while a notable peak at 1778 cm−1 is assigned to the C
C stretching from unoxidized graphitic domains, while a notable peak at 1778 cm−1 is assigned to the C![[double bond, length as m-dash]](https://www.rsc.org/images/entities/char_e001.gif) O stretch of carboxyl groups.28,29 In SCN spectrum, terminal amino group N–H stretching vibrations (–NH2 or
O stretch of carboxyl groups.28,29 In SCN spectrum, terminal amino group N–H stretching vibrations (–NH2 or ![[double bond, length as m-dash]](https://www.rsc.org/images/entities/char_e001.gif) NH groups) are responsible for a broad band in 3050–3400 cm−1 range. The triazine unit's C
NH groups) are responsible for a broad band in 3050–3400 cm−1 range. The triazine unit's C![[double bond, length as m-dash]](https://www.rsc.org/images/entities/char_e001.gif) N stretching vibration are represented by peaks at 1636 cm−1 and 1538 cm−1. Additional peaks at 1206 cm−1, 1315 cm−1 and 1400 cm−1 are associated with C–N stretching vibrations, while the out-of-plane bending of the tri-s-triazine unit is detected at 815 cm−1. Minimal vibrations related to S-containing groups are noted, likely due to low sulfur quantity and their coincide with C–N vibration peaks.30 The FTIR spectrum of the GO/SCN composite closely resembles that of pristine SCN, suggesting that the structural integrity of SCN is well-maintained despite the incorporation of GO. This preservation is likely due to the low quantity of GO in the composite. However, slight shifts in the peaks are observed in the GO/SCN composite compared to SCN, indicating interactions between GO and SCN components, a phenomenon also reported in other studies.31,32
N stretching vibration are represented by peaks at 1636 cm−1 and 1538 cm−1. Additional peaks at 1206 cm−1, 1315 cm−1 and 1400 cm−1 are associated with C–N stretching vibrations, while the out-of-plane bending of the tri-s-triazine unit is detected at 815 cm−1. Minimal vibrations related to S-containing groups are noted, likely due to low sulfur quantity and their coincide with C–N vibration peaks.30 The FTIR spectrum of the GO/SCN composite closely resembles that of pristine SCN, suggesting that the structural integrity of SCN is well-maintained despite the incorporation of GO. This preservation is likely due to the low quantity of GO in the composite. However, slight shifts in the peaks are observed in the GO/SCN composite compared to SCN, indicating interactions between GO and SCN components, a phenomenon also reported in other studies.31,32
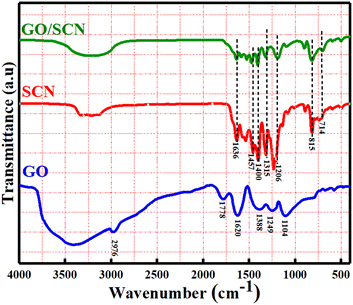 |
| | Fig. 3 FTIR patterns of GO, SCN and GO/SCN nanocomposites. | |
4.3. Raman spectroscopy
Raman spectroscopy of GO reveals two main peaks as shown in Fig. 4: the D band at 1343 cm−1, which indicates the presence of defects and disorder in the graphene lattice, and the G band at 1570 cm−1, corresponding to the in-plane vibrations of sp2-hybridized carbon atoms in the graphene structure. The D band arises due to the breathing modes of sp2 carbon rings and reflects the introduction of defects, such as oxygen functional groups, during the oxidation process. The G band is characteristic of graphitic materials, and its position around 1570 cm−1 is indicative of the sp2 carbon domains.33 In SCN, peaks between 1200 and 1600 cm−1 are attributed to C–N stretching and bending within the tri-s-triazine rings of the carbon nitride framework. Additional peaks at at 745 cm−1 and 695 cm−1 are associated with out-of-plane bending of C–N bonds, which are characteristic of carbon nitride. The peaks around 592 cm−1 and 541 cm−1 are attributed to the incorporation of sulfur atoms, specifically S–N or S–C bond vibrations, indicating successful sulfur doping into the carbon nitride lattice.34 In the GO/SCN composite, the Raman spectrum features both the D and G bands of GO and the characteristic C–N and S–N vibrations of SCN. Notably, the G band of GO shifts to ∼1588 cm−1, suggesting electronic interactions between GO and SCN. This shift implies that there is charge transfer or bonding between the two components. The presence of sulfur-related peaks along with C–N vibrations in the composite confirms the successful integration of SCN and GO, demonstrating the structural modification and interaction of these two materials.
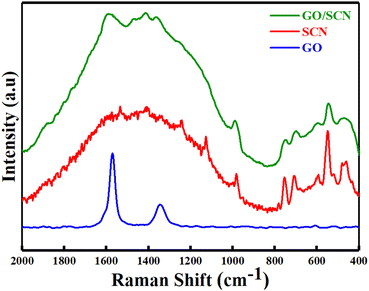 |
| | Fig. 4 Raman spectrums of GO, SCN and GO/SCN. | |
4.4. X-ray photoelectron spectroscopy (XPS)
To investigate the valence states and chemical environment of the surface components in GO/SCN composite, XPS was conducted. Fig. 5 confirms the presence of sulfur (S) carbon (C), nitrogen (N), and oxygen (O) in XPS spectrum. Three peaks clearly appeared in the high-resolution spectra of C 1s: one at 288.2 eV, corresponding to carboxylates (O![[double bond, length as m-dash]](https://www.rsc.org/images/entities/char_e001.gif) C–OH); another at 287.8 eV, indicating sp2 N–C
C–OH); another at 287.8 eV, indicating sp2 N–C![[double bond, length as m-dash]](https://www.rsc.org/images/entities/char_e001.gif) N bonds; and third at 284.3 eV which is related to C–C atoms in the triazine ring. A number of nitrogen-containing groups, including sp2 hybridized localized nitrogen (C–N
N bonds; and third at 284.3 eV which is related to C–C atoms in the triazine ring. A number of nitrogen-containing groups, including sp2 hybridized localized nitrogen (C–N![[double bond, length as m-dash]](https://www.rsc.org/images/entities/char_e001.gif) C), tertiary N–(C)3 groups, and amino groups with hydrogen (C–N–H), were identified in the high-resolution XPS of the N 1s region at 398.6 eV, 399.4 eV, and 401 eV which validated the presence of the g-C3N4 matrix. For the region of O 1s, peaks appeared at 529.9 eV and 532.0 eV possibly due to C
C), tertiary N–(C)3 groups, and amino groups with hydrogen (C–N–H), were identified in the high-resolution XPS of the N 1s region at 398.6 eV, 399.4 eV, and 401 eV which validated the presence of the g-C3N4 matrix. For the region of O 1s, peaks appeared at 529.9 eV and 532.0 eV possibly due to C![[double bond, length as m-dash]](https://www.rsc.org/images/entities/char_e001.gif) O and C–O–C components respectively, derived from GO. Further proof of a C–S bond and sulfur inclusion into the lattice structure, presumably by substitution with lattice nitrogen, was provided by a unique peak at 164.1 eV.35–37 The low sulfur content is further verified by its atomic weight percentage, measured at 0.26%, as shown in Table 1.
O and C–O–C components respectively, derived from GO. Further proof of a C–S bond and sulfur inclusion into the lattice structure, presumably by substitution with lattice nitrogen, was provided by a unique peak at 164.1 eV.35–37 The low sulfur content is further verified by its atomic weight percentage, measured at 0.26%, as shown in Table 1.
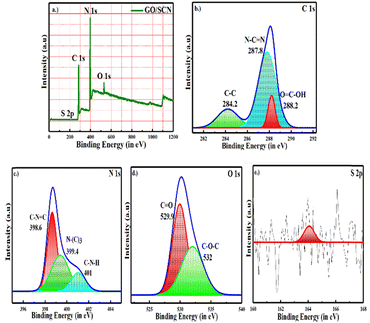 |
| | Fig. 5 (a) XPS spectra of GO/SCN nanocomposite. High resolution spectra of (b) carbon, (c) nitrogen (d) oxygen and (e) sulfur. | |
Table 1 Atomic % of elements present in GO/SCN nanocomposite
| Catalyst |
Atomic % |
| C(1s) |
N(1s) |
C(1s) |
S(2p) |
| GO/SCN |
37.45 |
GO/SCN |
37.45 |
GO/SCN |
4.5. Scanning electron microscopy (SEM)
SEM analysis was used to study the morphological features displayed by GO, SCN, and GO/SCN nanocomposites as shown in Fig. 6. Flat thin nanosheets with a large surface area accumulate in SCN, indicating excellent adsorption and catalytic activity. On other hand, GO displays a flake-like morphology, where the flakes are stacked and are in layered form. This morphology of GO contributes in providing high surface area and mechanical strength. SCN and GO layers are observed to be intermixed in GO/SCN nanocomposite, where the stratified nanosheets of SCN and flake-like layers of GO are finely stacked. This intermixing of layered structure improves interaction between the two materials, thus leading to better electrical conductivity, mechanical stability, and synergistic properties beneficial for catalysis.
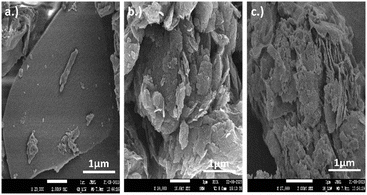 |
| | Fig. 6 SEM images of (a) SCN (b) GO and (c) GO/SCN. | |
4.6. Transmission electron microscopy (TEM)
The TEM analysis of GO, SCN, and GO/SCN nanocomposites shown in Fig. 7 provides detailed insights into their internal structures. GO exhibits thin, translucent flakes characteristic of its high surface area and layered nature. These layers form a distinctive flake-like morphology that enhances mechanical strength and surface availability. The TEM images of SCN reveal compact, crystalline sheets, confirming the sheet-like morphology of the material. These sheets appear dense and well-structured, indicating a large surfacearea that could contribute to SCN's adsorption and catalytic properties. In the case of the GO/SCN nanocomposite, TEM shows a well-defined intermixing of GO's flake-like structure with SCN's stratified nanosheets. The two materials are finely stacked, suggesting enhanced interaction between the layers. This layered intermixing is crucial for improved electrical conductivity and catalytic performance in the composite. These TEM observations are consistent with the SEM results, where the same flake-like structure for GO, sheet morphology for SCN, and intermixing in the GO/SCN composite were noted. Together, both SEM and TEM confirm the structural integrity and enhanced properties of the composite.
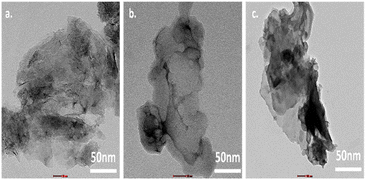 |
| | Fig. 7 TEM images of (a) SCN (b) GO (c) GO/SCN. | |
4.7. Photoluminescence spectra (PL)
PL analysis is a powerful tool for investigating the optical and electronic properties of nanocomposites. As illustrated in the Fig. 8, the GO/SCN composite's PL resembles that of pure SCN, with a prominent emission peak around 460 nm, matching the band-gap energy of SCN. This peak arises from excitonic PL, which is linked to n–π* electronic transitions involving nitrogen atoms in SCN.38 Compared to pure SCN, the PL intensity of the GO/SCN composite is much lower, indicating that under identical excitation conditions, more charge carriers are either trapped at the particle surface or recombined by non-radiative processes under the same excitation circumstances. Since PL emission is due to the recombination of free charge carriers, the reduced intensity suggests a reduced rate of recombination of electron (e−) and holes (h+), in the composite when exposed to visible light. GO nanosheets enhance charge separation by serving as electron acceptors, thus hindering the recombination of photogenerated e− and h+. The two-dimensional π-conjugation structure of GO nanosheets effectively hinders e− and h+ pair recombination. In comparison to pure SCN, photogenerated e− and h+ in the GO/SCN composite can be separated more effectively because excited electrons from visible light can migrate from SCN's conduction band to the GO sheets.
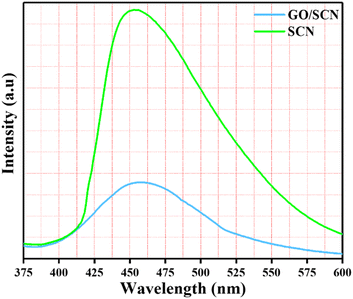 |
| | Fig. 8 PL spectra of synthesised nanocomposite SCN and GO/SCN. | |
4.8. Ultraviolet-visible diffused reflectance spectroscopy (UV-DRS)
The optical absorption properties of the synthesized SCN and GO/SCN samples were assessed using UV-DRS. As depicted in Fig. 9, the band gap energy of SCN, calculated using the Kubelka–Munk function, is 2.62 eV, while the GO/SCN nanocomposite shows a reduced band gap of 2.52 eV. Additionally, the band gap of pristine g-C3N4 was found to be 2.74 eV. The GO/SCN composite exhibited enhanced absorption across the entire wavelength range compared to SCN alone. This improvement is attributed to GO's strong absorption capabilities in the visible light spectrum and its role as an electron acceptor, which facilitates more efficient electron migration from the SCN surface. Consequently, the GO/SCN nanocomposite demonstrates superior light-harvesting efficiency. These findings align with the photocatalytic activity tests, where the synergistic interaction between GO and SCN enhances the overall performance of the composite, particularly in visible-light-driven applications.
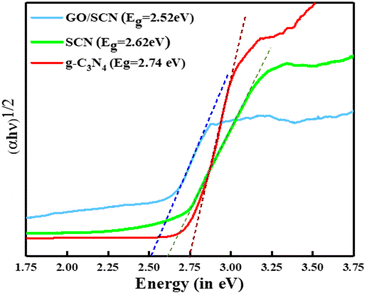 |
| | Fig. 9 Tauc plot representing the bandgap energies of SCN and GO/SCN. | |
4.9. Electrochemical impedance spectroscopy (EIS)
The interfacial charge transfer properties of the synthesized photocatalyst were investigated by Nyquist plots drawn from EIS data. In such plots, the magnitude of the arc radius shows the reaction rate on the working electrode. A smaller arc radius leads to reduced electrode resistance, which is an indication of efficient electron–hole pair separation, wherein abundant electrons will be available to be used during photodegradation. Compared to the GO/SCN composite, the SCN photocatalyst has a bigger arc radius, as shown in Fig. 10, indicating that the charge transfer resistance in the GO/SCN composite is the smallest in these samples, implying photoinduced charges are separated effectively. By incorporating GO into the SCN matrix the transport and separation of photogenerated charge carriers improved effectively.39,40 GO acts as a excellent transporter and electron acceptor due to substantial electrical conductivity and large surface area, enabling the capture and transfer of electrons much easier. This improved electron mobility reduces electron–hole recombination rate, hence allowing more electrons to get involved in the photocatalytic reaction. Therefore, the GO/SCN composite exhibited enhanced photocatalytic performance, which was attributed to the efficient utilization of photogenerated charge.
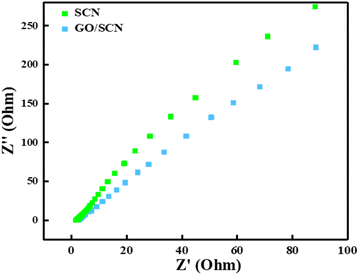 |
| | Fig. 10 EIS Nyquist plots of SCN and GO/SCN. | |
4.10. Mott–Schottky analysis
Using Mott–Schottky plots to measure the flat band potential, the relative band locations of SCN and GO/SCN were found, indicating that both are n-type semiconductors. As shown in Fig. 11, the conduction band (CB) position for SCN was determined to be −1.03 V vs. the Normal Hydrogen Electrode (NHE). SCN has a band gap energy (Eg) of 2.62 eV, according to the optical band energy from UV-DRS spectra. Using this band gap value and the flat band potential, the valence band (VB) energy was evaluated using the formula:
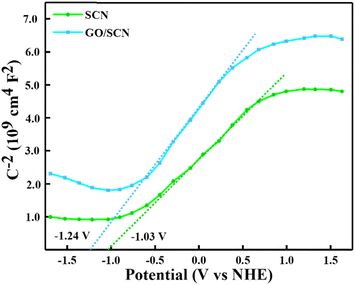 |
| | Fig. 11 Mott–Schottky curve of SCN and GO/SCN. | |
Consequently, 1.59 V vs. NHE was determined to be the EVB for SCN. The conduction band energy of the GO/SCN composite was found to be a flat band potential of −1.24 eV via Mott–Schottky analysis. Based on the calculated band gap of 2.52 eV from UV-DRS, the composite's estimated valence band energy is 1.28 eV vs. NHE. Heterojunctions formed at the interface between SCN and GO were shown by staggered band edge potentials in the potential energy diagram vs. NHE for the composite.
5. Results and discussion
The degradation of LDPE was assessed primarily through weight loss, accompanied by the confirmation of chemical and morphological alterations via FTIR and SEM. FTIR spectroscopy was utilized to monitor changes at the molecular level of LDPE. Additionally, morphological transformations observed using SEM. By integrating these analytical techniques, a comprehensive understanding of the degradation mechanism of LDPE films was achieved.
5.1. Weight loss study of LDPE film
The photoinduced weight loss investigation of LDPE film is shown in Fig. 12. Weight loss (%) was computed using eqn (1)| | |
Weight loss (%) = (W0 − W)/W0 × 100
| (1) |
where W0 represents the starting weight of the microplastics and W their weight after t hour of radiation.41 In our study, we observed that LDPE film exhibited negligible weight loss under visible light in the absence of a photocatalyst, even after 10 days. However, the weight loss rate increased significantly when the GO/SCN composite was used, demonstrating much higher efficiency compared to GO, SCN, and GO/CN alone. Notably, the GO3/SCN composite showed a steady increase in weight loss with irradiation time, reaching 21% after 10 days of exposure. In comparison, the weight loss for GO alone was only 7.4%, while SCN alone resulted in a 10.6% loss under the same conditions. These results strongly suggest that the introduction of GO/SCN enhances the photocatalytic degradation of LDPE films, which can be attributed to the even dispersion of particles across the film surface, as confirmed by scanning electron microscopy (SEM) analysis.
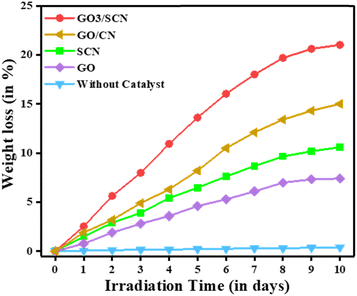 |
| | Fig. 12 Weight loss (%) of LDPE films without catalyst, with GO3/SCN, GO/CN, SCN, and GO under visible light irradiation. | |
Moreover, the incorporation of sulfur into SCN significantly improved visible light harvesting, leading to enhanced photocatalytic activity. This is clearly reflected in the comparison between the GO/CN and GO3/SCN composites, where the weight loss increased from 15% in GO/CN to 21% in GO3/SCN. The superior performance of GO3/SCN highlights the positive effect of sulfur doping on the composite's light absorption and degradation efficiency.
To optimize the performance further, we varied the amount of GO during the synthesis of the composite. Among the tested samples, GO3/SCN exhibited the highest weight loss at 21%, followed by GO4/SCN at 19%, while GO2/SCN achieved 17% weight loss. Both GO1/SCN and GO5/SCN showed a weight loss of 14%. These results indicate that the balance between GO and SCN content plays a crucial role in maximizing the photocatalytic activity of the composite.The visible light absorbed during photocatalysis triggers chemical changes on the surface of the LDPE film, leading to physical transformations such as cracking, rupture, tearing, exterior delamination, and dissolution. These surface alterations contribute to the notable weight loss observed in the initial stages of the process. As the reaction progresses, the rate of weight loss gradually decreases, likely due to a reduction in the photocatalytic reaction efficiency. Initially, the abundance of light energy and active photocatalyst drive the process efficiently, but over time, the reaction rate slows. Despite this, the overall weight loss of the LDPE films continues to increase with prolonged exposure to photocatalysis.
5.2. SEM analysis of LDPE film
Surface morphology changes of photocatalytic exposure of LDPE films were characterised using SEM.42,43 After visible light exposure of LDPE films for 10 days, the SEM images provided interesting information as shown in Fig. 13. Surface of pristine LDPE film was very smooth with no visible fractures and cracks compared to other measured samples. However, some minor damages occurred in pristine LDPE film when it was exposed to visible light without a catalyst resulting in few minor wrinkles and cracks being formed. Nevertheless, there were dramatic changes on the surface of the LDPE film when it underwent photocatalytic degradation using GO/SCN; leading to an increase in number of wrinkles and peppered cavities of all sizes across the entire surface. Importantly, treatment with SCN, GO or GO/CN only caused fewer cavities on LDPE films indicating less level of destruction compared to that exhibited by GO/SCN treatment. These cavities are formed due to volatile compounds being trapped within LDPE film during photocatalysis which subsequently escape from this polymer matrix. This SEM analysis demonstrates that GO/SCN composite is more effective than SCN, GO and GO/CN treatments at degrading LDPE films.
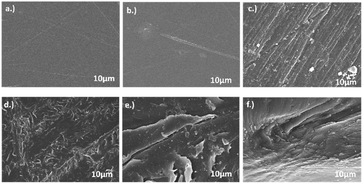 |
| | Fig. 13 FESEM images of LDPE films (a) before irradiation (b) without catalyst (c) with GO (d) with SCN (e) with GO/CN (f) with GO3/SCN after irradiation for 10 days. | |
5.3. FTIR analysis of LDPE film
FTIR spectroscopy is a powerful analytical technique for examining polymer degradation because it gives non-destructive analysis to assess oxidation levels. FTIR reveals valuable information about the molecular changes occurring within polymers by observing absorption pattern at specific wavenumbers. In the case of LDPE films (Fig. 14), before irradiation, distinct peaks within defined regions signify the presence of various functional groups and their vibrational modes.44 The asymmetric and symmetric stretching of –CH2 is identified by peaks at 2916 cm−1 and 2847 cm−1, respectively, while a medium-type rocking deformation of CH2 is observed at 712 cm−1. The stretching of the C![[double bond, length as m-dash]](https://www.rsc.org/images/entities/char_e001.gif) C bond is indicated by peak at 1466 cm−1, and the weak symmetric deformation of the CH3 group is detected by peak at 1378 cm−1. These peaks are all significant in determining the structural characteristics of LDPE. These peaks remain unchanged even after the photocatalytic process. However, the appearance of carbonyl groups between 1700–1760 cm−1 after irradiation suggests oxidation products such as carboxylic acids, ketones, aldehydes, and esters. Photocatalytic processes induce the formation of unsaturated groups, observable through peaks at 888 cm−1 and 909 cm−1, on the other hand formation of alcoholic species is indicated by weak stretching within the 3450–3650 cm−1 range. Important indicators of degradation, peroxides present up as complex patterns of absorption between 1000 and 1350 cm−1, which indicate the development of oxygenated products.45,46 Different absorption peaks identify different peroxide groups, such as primary and secondary peroxides. The information obtained from the IR spectra allowed the calculation of carbonyl index which represents the degree of degradation of particles.
C bond is indicated by peak at 1466 cm−1, and the weak symmetric deformation of the CH3 group is detected by peak at 1378 cm−1. These peaks are all significant in determining the structural characteristics of LDPE. These peaks remain unchanged even after the photocatalytic process. However, the appearance of carbonyl groups between 1700–1760 cm−1 after irradiation suggests oxidation products such as carboxylic acids, ketones, aldehydes, and esters. Photocatalytic processes induce the formation of unsaturated groups, observable through peaks at 888 cm−1 and 909 cm−1, on the other hand formation of alcoholic species is indicated by weak stretching within the 3450–3650 cm−1 range. Important indicators of degradation, peroxides present up as complex patterns of absorption between 1000 and 1350 cm−1, which indicate the development of oxygenated products.45,46 Different absorption peaks identify different peroxide groups, such as primary and secondary peroxides. The information obtained from the IR spectra allowed the calculation of carbonyl index which represents the degree of degradation of particles.
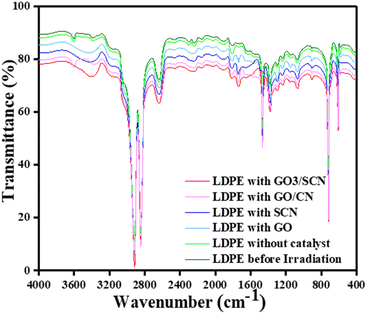 |
| | Fig. 14 FTIR spectrum of LDPE films before irradiation, without catalyst, with GO, with SCN, with GO/CN, and with GO/SCN after irradiation for 10 days. | |
5.4. Carbonyl index method
The carbonyl index method is frequently employed to estimate the degree of photo-oxidation in LDPE films. The carbonyl index (C.I.) was determined as
C.I.C![[double bond, length as m-dash]](https://www.rsc.org/images/entities/char_e001.gif) O = A1850–1650/A1420–1500 O = A1850–1650/A1420–1500 |
where A1850–1650 is the area under the carbonyl peak at band ranges 1850–1650 and A1420–1500 is the area under the reference peak at band ranges 1420–1500. The areas were calculated using the ORIGIN software after correction of baseline by a linear function and using peak analysis tool.47–50 As shown in Table 2, LDPE films irradiated for 10 days without any catalyst in visible light showed a C.I. of 0.37, while those treated with GO and SCN catalysts displayed C.I. of 0.81 and 0.99, respectively. Also, the binary composite GO3/SCN had a C.I. of 1.24, indicating a significant increase of 53% over GO. Furthermore, the GO/CN composite demonstrated a lower carbonyl index of 1.04, highlighting the enhanced degradation efficiency resulting from sulfur incorporation in the GO3/SCN composite. These results underscore the heightened concentration of carbonyl products resulting from exposure to visible light irradiation, thereby causing an increase in degradation of LDPE film.
Table 2 Carbonyl index of LDPE films without catalyst, with GO, SCN and GO/SCN
| Catalyst |
Without catalyst |
GO |
SCN |
GO/CN |
GO3/SCN |
| Carbonyl index |
0.37 |
0.81 |
0.99 |
1.04 |
1.24 |
5.5. Photodegradation of BPA by prepared photocatalyst
The degradation efficiency of BPA using synthesized catalysts was evaluated under visible light illumination as shown in Fig. 15. The degradation study weas conducted using 150 mL of 20 mg per L BPA solution and 25 mg of the catalyst, following a manual agitation of the solution for 45 minutes before initiating the degradation process. BPA degradation was studied over time using GO, SCN, GO/CN and series of GO/SCN nanocomposite, results indicated that GO exhibited a degradation efficiency of 54.4% for BPA, which was lower than that of SCN, GO/CN and series of GO/SCN nanocomposites. The degradation efficiencies for SCN, GO/CN and GO3/SCN were 68.5%, 83% and 89.5%, respectively. This enhancement in degradation performance can be related to several factors. Firstly, the sp2 hybridized atoms of carbon in GO/SCN binary composites possess unique electrical properties, facilitating rapid electron transport from excited SCN to the GO sheet. Additionally, GO enhances electron conductivity, reducing electron–hole pair recombination and improving charge carrier separation. Consequently, electrons from SCN are transferred to GO, preventing electron–hole pairs recombination and thus increasing the catalytic activity of GO/SCN. Moreover, the presence of sulfur in SCN further improves the harvesting of visible light, which is critical for initiating the photocatalytic degradation process. In a detailed analysis of the series of nanocomposites, degradation efficiencies were recorded as follows: GO1/SCN at 86%, GO2/SCN at 89%, GO3/SCN at 89.5%, GO4/SCN at 88%, and GO5/SCN at 85.5%. Interestingly, the degradation efficiency initially increased with the incorporation of GO, peaking at GO3/SCN, before declining with further additions of GO. This trend may be attributed to a decrease in the surface area available for BPA adsorption, which ultimately affects degradation efficiency. The kinetics of BPA photodegradation were analysed using the Langmuir–Hinshelwood model, which followed pseudo-first-order kinetics as described by the equation
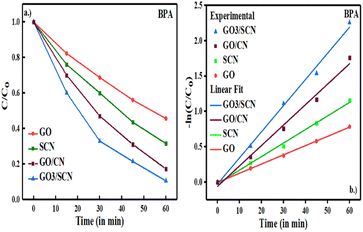 |
| | Fig. 15 (a) Photocatalytic degradation performance of SCN, GO, GO/CN and GO/SCN against BPA under visible light (b) first-order kinetics plots of BPA over prepared nanocomposite under visible light. | |
The photodegradation reactions adhered to pseudo-first-order kinetic processes.51,52 The rate constants (k) for the GO, SCN, and GO/SCN catalysts were 0.01303, 0.01914, and 0.03694 min−1, respectively.
5.6. Mechanistic degradation of BPA
To investigate the intermediates generated during BPA breakdown and to understand the possible mechanistic route facilitated by GO3/SCN nanocomposites Liquid Chromatography-Mass Spectrometry (LC-MS) analysis was conducted. This analysis unveiled a variety of intermediate products emerging from BPA's breakdown. It emerged that BPA and its fragments, reacted with reactive oxygen species and eventually transform into water and carbon dioxide. Over time, BPA was converted into smaller molecules, including carboxylic acids, aromatic intermediates, and benzoquinones. Many processes, including substitution on the aromatic ring, hydroxylation, decarboxylation, dehalogenation, bond cleavage, and ring-opening, are the mechanisms behind this degradation process. The distinct mass-to-charge ratio (m/z) values 208, 197, 104, 108, 152, 122, and 135 were observed and used to identify different intermediates formed during degradation of BPA. The detailed insight into the degradation pathway is shown in Fig. 16 which offers a greater understanding of the transformation process at the molecular level.
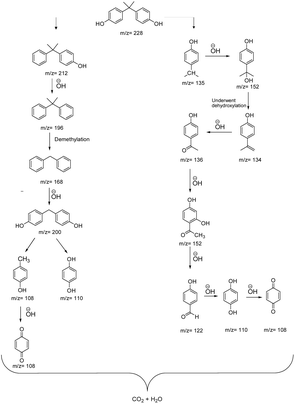 |
| | Fig. 16 Proposed pathway for BPA degradation. | |
5.7. Recyclability and photostability
The recovery and recyclability of the photocatalyst were investigated across three consecutive reactions under visible light. After each reaction, the photocatalyst was recovered by centrifugation, rinsed using distilled water, and dried at 60 °C for two hours53 The nanocomposite continued to degrade BPA with a degradation efficiency greater than 87%. However, for the reusability test of the GO/3SCN nanocomposite, the weight loss percentage of LDPE film decreased from 21% to 17% over the cycles. Interestingly, the carbonyl index of LDPE film also decreases with each cycle, reducing from 1.24 to 0.93 in the third cycle. The decrease in carbonyl index suggests a decrease in the extent of LDPE film degradation with each cycle, further corroborating the observed decrease in weight loss percentage. The prolonged experiment conditions, with each cycle lasting for 10 days, likely contributed to catalyst deactivation. The photocatalyst may deactivate due to surface fouling or chemical poisoning which reduces the number of active sites available for photodegradation. Additionally, the generation of reactive oxygen species, which are crucial for the photodegradation process, might decline over cycles due to changes in the nanocomposite's ability to produce or sustain these species effectively (Table 3).
Table 3 Recyclability results of GO/SCN observed over three cycles
| Recycalibity results of GO3/SCN |
| |
1st cycle |
2nd cycle |
3rd cycle |
![[thin space (1/6-em)]](https://www.rsc.org/images/entities/char_2009.gif) |
| Photodegradation efficiency against BPA |
| % photodegradation |
89.5 |
89 |
88 |
![[thin space (1/6-em)]](https://www.rsc.org/images/entities/char_2009.gif) |
| Weight loss % study for LDPE film |
| Weight loss % |
21 |
18 |
17 |
![[thin space (1/6-em)]](https://www.rsc.org/images/entities/char_2009.gif) |
| Carbonyl index for LDPE film |
| Carbonyl index (C.I) |
1.24 |
0.99 |
0.93 |
To further investigate the structural and compositional stability of the photocatalyst after repeated use, post-reaction characterizations using XRD, XPS, and FTIR were performed as shown in Fig. 17. XRD analysis revealed that the crystalline structure of the nanocomposite remained unchanged after three cycles, confirming its stability at the molecular level. XPS analysis validated that the surface composition and oxidation states of key elements were preserved, indicating no significant surface degradation or loss of photocatalytic activity due to oxidation or contamination. Furthermore, FTIR analysis demonstrated the retention of key functional groups in the composite, with no detectable changes in chemical bonding, affirming the material's structural integrity.
 |
| | Fig. 17 Comparison of photostability of GO3/SCN before and irradiation using (a) XRD pattern, (b) FTIR spectrum, and (c) XPS analysis. | |
Collectively, these characterizations provide compelling evidence of the robustness of the GO/SCN nanocomposite. Despite a gradual decline in photocatalytic efficiency over multiple cycles, the material's fundamental structure and functional capacity remain intact, making it a highly resilient photocatalyst for long-term environmental applications. This robust performance, paired with its high reusability, further strengthens its viability for practical use in photocatalytic degradation processes.
5.8. Determination of reactive oxygen species (ROS) for degradation of BPA
Radical scavenging studies were performed to identify the primary ROS involved in the photocatalytic degradation of bisphenol A (BPA). EDTA, IPA, and BQ were used as scavengers for h+, hydroxyl radicals (˙OH), and superoxide radicals (O2˙−), respectively, each at a concentration of 0.1 mM.54 The addition of these scavengers to the reaction mixture led to a noticeable decrease in degradation efficiency, indicating the involvement of the targeted ROS. Comparative analysis revealed that all scavengers partially suppressed photocatalytic activity, as shown in Fig. 18. IPA caused the most significant reduction in the photodegradation rate, indicating that ˙OH radicals play a crucial role in the photocatalytic degradation of BPA. BQ also had a notable effect, suggesting that O2˙− radicals are the second most important species. In contrast, EDTA had only a marginal effect, indicating a lesser role for h+ radicals in the degradation process.
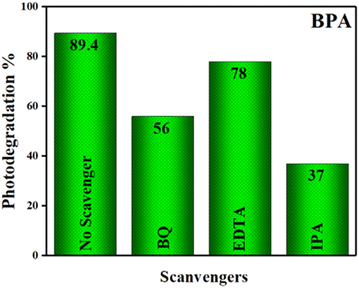 |
| | Fig. 18 Influence of radical scavengers for photodegradation of BPA on GO/SCN under visible light irradiation. | |
5.9. Possible mechanism for degradation of LDPE film and BPA
Based on the aforementioned characterization and experimental findings, a plausible mechanism is proposed to elucidate the degradation pathways of LDPE film and BPA. Upon exposure to visible light irradiation, LDPE films undergo a series of intricate reactions, leading to subsequent chain scission, branching, cross-linking, and oxidation reactions within the polymer matrix. When GO/SCN nanocomposite is introduced, SCN acts as a visible light absorber, generating mobile e− and h+ within the conduction band (CB) and valence band (VB), respectively. Upon deposition of GO onto SCN, the degradation process is catalysed due to the exceptional charge carrier mobility of GO. Acting as an electron collector and transporter, GO efficiently separates photogenerated electron–hole pairs, thereby prolonging the lifetime of charge carriers. Consequently, oxygen molecules (O2) adsorbed onto the composite surface capture these e−, yielding several active oxygen species, notably (˙OH), (O2˙−), and per hydroxyl radicals (HOO˙), with (˙OH) being the predominant oxidant in photocatalytic oxidation. These active oxygen species initiate degradation by attacking neighbouring polymer chains, propagating the process spatially into the polymer matrix via the diffusion of reactive oxygen species. Introduction of carbon-centred radicals into the polymer chain results in successive reactions with oxygen incorporation, leading to chain cleavage with oxygen incorporation and the formation of intermediate species bearing carbonyl, carboxyl, and hydroxyl groups, such as formic acid, acetic acid, methanol, and ethanol. Ultimately, these intermediates undergo further photocatalytic oxidation, facilitated by reactive oxygen species, culminating in the degradation of LDPE film to carbon dioxide and water. Similarly, generated radicals can attack BPA, facilitating its degradation into smaller molecules.| | |
GO/SCN + hν → GO/SCN (e− + h+)
| (2) |
| |
 | (4) |
| |
 | (5) |
| | |
–(CH2CH2)– + ˙OH → –(˙CHCH2)– + H2O
| (8) |
| | |
–(˙CHCH2)– + O2 → –(CH(˙OO)CH2)–
| (9) |
| | |
–(CH(˙OO)CH2)– → –(CH(OOH)CH2)– + –(CH2CH2)– + –(CH2CH˙)–
| (10) |
| | |
–(CH(OOH)CH2)– + hν → –(CH˙OCH2)– + ˙OH
| (11) |
| | |
–(CH˙OCH2)– → –(CHO)– + –(˙CH2CH2)–
| (12) |
| | |
–(˙CH2CH2)– + O2 → –(CH2COOH)– + –(HOCCH2)– + –(CH2OCCH2)–
| (13) |
| | |
–(˙CH2COOH)– + –(˙HOCCH2)– → CO2 + H2O + –(˙CH2OCCH2)– + O2
| (14) |
| | |
BPA + ˙OH → CO2 + H2O
| (15) |
6. Conclusions
The sonication-assisted synthesis of GO/SCN nanocomposite proved highly effective in enhancing the degradation of BPA and LDPE microplastics film under visible light irradiation. Comprehensive characterization and experimental investigation provided a detailed understanding of the nanocomposite's properties and performance.
XRD analysis clarified that the lattice structure of SCN was not altered by addition of GO. FTIR revealed interaction between GO and SCN indicated by slight shifts in peaks. XPS confirmed the presence of sulfur, verifying the incorporation of S in the g-C3N4 lattice. PL studies helped elucidate the electronic properties of GO/SCN with reduced PL intensity suggesting a decreased rate of recombination of e− and h+ which was further supported by EIS findings. UV DRS and Mott–Schottky plots were used to determine the band gap and flat band potentials of the composite providing deeper insight into the electronic structure of the nanocomposite.
The weight loss percentage of LDPE film reached 21% after 10 days of irradiation, indicating significant degradation. This degradation of LDPE was further supported by SEM and FTIR analyses, which confirmed morphological and chemical alterations in the LDPE films consistent with degradation processes. Additionally, the degradation efficiency for BPA was measured at 89.5% within 60 min. Mechanistically, the GO/SCN nanocomposite facilitated efficient charge carrier separation, leading to the generation of active oxygen species crucial for degradation. These findings underscore the promising application of GO/SCN nanocomposites in mitigating plastic pollution and harmful chemical contaminants in the environment.
Data availability
The authors confirm that the data supporting the findings of this study are available within the article. Raw data that support the finding of this study are available from the corresponding author upon reasonable request.
Author contributions
Ankoor Sura: conceptualization, formal analysis, investigation, writing – original draft preparation, methodology, data curation, visualization and investigation. Sonia Nain: project administration, conceptualization, resources, investigation, supervision, reviewing and editing.
Conflicts of interest
There are no conflicts to declare.
Acknowledgements
We would like to clarify that we have not received any direct funding for this work from any institution. The acknowledgment reflects only the provision of instrumentation facilities by SAIF-AIIMS (New Delhi), Central Research Facility, IIT Delhi, and Central Instrumentation Laboratory at Deenbandhu Chhotu Ram University of Science and Technology, Murthal, and the JRF support provided to Ankoor Sura by CSIR.
References
- A. Sura, A. Singh, A. Singh, S. Narwal, P. Malik, M. S. Goyat, Y. K. Mishra, S. Nain and S. Duhan, Mater. Adv., 2024, 5(13), 5514–5526 RSC
 .
. - X. Cheng, Z. Cheng, B. Jing, Z. Ao, C. Shang and L. Ling, Water Res., 2023, 235, 119889 CrossRef PubMed
 .
. - A. Hassani, P. Eghbali, F. Mahdipour, S. Wacławek, K.-Y. A. Lin and F. Ghanbari, Chem. Eng. J., 2023, 453, 139556 CrossRef
 .
. - J. I. Kim, Y. A. Lee, C. H. Shin, Y.-C. Hong, B.-N. Kim and Y.-H. Lim, Environ. Int., 2022, 161, 107093 CrossRef PubMed
 .
. - B. E. Llorente-García, J. M. Hernández-López, A. A. Zaldívar-Cadena, C. Siligardi and E. I. Cedillo-González, Coatings, 2020, 10, 658 CrossRef
 .
. - K. Parveen, A. Parvaiz, M. Subhan and A. Khan, in Microplastic Pollution, Springer Nature Singapore, Singapore, 2024, pp. 419–429 Search PubMed
 .
. - N. A. Sacco, F. M. Zoppas, A. Devard, M. del, P. González Muñoz, G. García and F. A. Marchesini, Microplastics, 2023, 2, 278–303 CrossRef
 .
. - P. D. Phonsy, S. G. Anju, K. P. Jyothi, S. Yesodharan and E. P. Yesodharan, J. Adv. Oxid. Technol., 2015, 18(1), 85–97 Search PubMed
 .
. - A. O. Oluwole, E. O. Omotola and O. S. Olatunji, Bioorg. Med. Chem., 2020, 14, 62 Search PubMed
 .
. - M. Surana, D. S. Pattanayak, V. Yadav, V. K. Singh and D. Pal, Environ. Res., 2024, 247, 118268 CrossRef
 .
. - A. G. Rana, M. Tasbihi, M. Schwarze and M. Minceva, Catalysts, 2021, 11, 662 CrossRef
 .
. - N. El Messaoudi, Z. Ciğeroğlu, Z. M. Şenol, M. Elhajam and L. Noureen, J. Water Proc. Eng., 2023, 55, 104150 CrossRef
 .
. - X. Liu, R. Ma, L. Zhuang, B. Hu, J. Chen, X. Liu and X. Wang, Crit. Rev. Environ. Sci. Technol., 2021, 51, 751–790 CrossRef
 .
. - M. Zuo, X. Li, Y. Liang, F. Zhao, H. Sun, C. Liu, X. Gong, P. Qin, H. Wang, Z. Wu and L. Luo, Sep. Purif. Technol., 2023, 308, 122875 CrossRef
 .
. - K. Guan, J. Li, W. Lei, H. Wang, Z. Tong, Q. Jia, H. Zhang and S. Zhang, J. Materiomics., 2021, 7, 1131–1142 CrossRef
 .
. - C. Prasad, Q. Liu, H. Tang, G. Yuvaraja, J. Long, A. Rammohan and G. V. Zyryanov, J. Mol. Liq., 2020, 297, 111826 CrossRef
 .
. - S. H. Alrefaee, A. Ben Gouider Trabelsi, A. E. Abdelhamid, A. A. Ward, W. Elsharkawy, F. H. Alkallas, A. M. Mostafa, A. N. Al-Ahmadi, S. S. Nafee, R. A. Pashameah and A. M. Khalil, Recycled polystyrene/polyvinylpyrrolidone/reduced graphene oxide nanocomposites for optoelectronic devices, J. Mater. Res. Technol., 2023, 25, 2631–2640 CrossRef
 .
. - S. Y. Tan, W. C. Chong, S. Sethupathi, Y. L. Pang, L. C. Sim and E. Mahmoudi, Chem. Eng. Res. Des., 2023, 190, 550–565 CrossRef
 .
. - H. Lv, Y. Huang, R. T. Koodali, G. Liu, Y. Zeng, Q. Meng and M. Yuan, ACS Appl. Mater. Interfaces, 2020, 12, 12656–12667 CrossRef
 .
. - Y. Xu, H. Bai, G. Lu, C. Li and G. Shi, J. Am. Chem. Soc., 2008, 130, 5856–5857 CrossRef PubMed
 .
. - J. Li, Y. Tang, R. Jin, Q. Meng, Y. Chen, X. Long, L. Wang, H. Guo and S. Zhang, Solid State Sci., 2019, 97, 105990 CrossRef
 .
. - T. S. Tofa, F. Ye, K. L. Kunjali and J. Dutta, Catalysts, 2019, 9, 819 CrossRef
 .
. - T. S. Tofa, K. L. Kunjali, S. Paul and J. Dutta, Environ. Chem. Lett., 2019, 17, 1341–1346 CrossRef
 .
. - A. Singh, A. Goswami and S. Nain, Appl. Nanosci., 2020, 10, 2255–2268 CrossRef
 .
. - G. Vinodha, P. D. Shima and L. Cindrella, J. Mater. Sci., 2019, 54, 4073–4088 CrossRef CAS
 .
. - R. R. Ikreedeegh and M. Tahir, Fuel, 2021, 305, 121558 CrossRef
 .
. - L. Sun, T. Du, C. Hu, J. Chen, J. Lu, Z. Lu and H. Han, ACS Sustain. Chem. Eng., 2017, 5, 8693–8701 CrossRef
 .
. - G. Surekha, K. V. Krishnaiah, N. Ravi and R. Padma Suvarna, J. Phys. Conf., 2020, 1495, 012012 CrossRef
 .
. - T. F. Emiru and D. W. Ayele, Egypt. J. Basic Appl. Sci., 2017, 4, 74–79 Search PubMed
 .
. - T. D. An, N. Van Phuc, N. N. Tri, H. T. Phu, N. P. Hung and V. Vo, Appl. Mech. Mater., 2019, 889, 43–50 Search PubMed
 .
. - J. Li, Y. Tang, R. Jin, Q. Meng, Y. Chen, X. Long, L. Wang, H. Guo and S. Zhang, Solid State Sci., 2019, 97, 105990 CrossRef
 .
. - T. F. Emiru and D. W. Ayele, Egypt. J. Basic Appl. Sci., 2017, 4, 74–79 Search PubMed
 .
. - K. Krishnamoorthy, M. Veerapandian, R. Mohan and S.-J. Kim, Appl. Phys. A, 2012, 106, 501–506 CrossRef CAS
 .
. - K. Maślana, R. J. Kaleńczuk, B. Zielińska and E. Mijowska, Materials, 2020, 13, 1349 CrossRef PubMed
 .
. - R. R. Ikreedeegh and M. Tahir, Fuel, 2021, 305, 121558 CrossRef CAS
 .
. - J. Li, Y. Tang, R. Jin, Q. Meng, Y. Chen, X. Long, L. Wang, H. Guo and S. Zhang, Solid State Sci., 2019, 97, 105990 CrossRef CAS
 .
. - X. Wang, X. Zhang, L. Li, L. Zhang, J. Bao and N. Zhang, Fuel, 2023, 340, 127413 CrossRef CAS
 .
. - X. Fang, Y. Tang, Y.-J. Ma, G. Xiao, P. Li and D. Yan, Sci. China Mater., 2023, 66, 664–671 CrossRef CAS
 .
. - H. A. El-Sabban, S. Y. Attia, M. A. Diab and S. G. Mohamed, J. Energy Storage, 2023, 60, 106593 CrossRef
 .
. - Z. Zhou, X. Ji, S. Pourhashem, J. Duan and B. Hou, Composites, Part A, 2021, 149, 106568 CrossRef CAS
 .
. - Y. An, J. Hou, Z. Liu and B. Peng, Mater. Chem. Phys., 2014, 148, 387–394 CrossRef CAS
 .
. - X. Zhao, Z. Li, Y. Chen, L. Shi and Y. Zhu, Appl. Surf. Sci., 2008, 254, 1825–1829 CrossRef CAS
 .
. - M. C. Ariza-Tarazona, C. Siligardi, H. A. Carreón-López, J. E. Valdéz-Cerda, P. Pozzi, G. Kaushik, J. F. Villarreal-Chiu and E. I. Cedillo-González, Mar. Pollut. Bull., 2023, 193, 115206 CrossRef CAS
 .
. - K. Zhang, A. H. Hamidian, A. Tubić, Y. Zhang, J. K. H. Fang, C. Wu and P. K. S. Lam, Environ. Pollut., 2021, 274, 116554 CrossRef CAS PubMed
 .
. - R. L. Kovács, M. Csontos, S. Gyöngyösi, J. Elek, B. Parditka, G. Deák, Á. Kuki, S. Kéki and Z. Erdélyi, Polym. Test., 2021, 96, 107080 CrossRef
 .
. - Ö. M. Doğan and İ. Kayacan, Energy Sources, Part A, 2008, 30, 392–400 CrossRef
 .
. - J. Almond, P. Sugumaar, M. N. Wenzel, G. Hill and C. Wallis, E-Polymers, 2020, 20, 369–381 CrossRef
 .
. - P. Kaewkam, A. Kanchanapaetnukul, J. Khamyan, N. Phadmanee, K.-Y. A. Lin, K. Kobwittaya and S. Sirivithayapakorn, J. Environ. Chem. Eng., 2022, 10, 108131 CrossRef
 .
. - K. I. Martínez, R. González-Mota, J. J. Soto-Bernal and I. Rosales-Candelas, J. Appl. Polym. Sci., 2021, 138(14), e50158 CrossRef
 .
. - R. S. Gomes, A. N. Fernandes and W. R. Waldman, Environ. Sci. Technol., 2024, 58, 7609–7616 CrossRef PubMed
 .
. - A. Singh, V. Kaushik, V. Kumari, A. Goswami and S. Nain, Bionanoscience, 2023, 13, 1885–1895 CrossRef
 .
. - A. Singh, V. Kaushik, S. Chahal, A. Goswami and S. Nain, ChemistrySelect, 2021, 6, 10038–10050 CrossRef
 .
. - K. Pandiselvi, H. Fang, X. Huang, J. Wang, X. Xu and T. Li, J. Hazard. Mater., 2016, 314, 67–77 CrossRef CAS
 .
. - L. Bai, R. Guo, Z. Chen, L. Liu, G. Dong, J. Zhang, Y. Wu, H. Zhao, D. Shan, Y. Su, J. Zhang and B. Wang, J. Clean. Prod., 2022, 363, 132481 CrossRef CAS
 .
.
|
| This journal is © The Royal Society of Chemistry 2024 |
Click here to see how this site uses Cookies. View our privacy policy here.  Open Access Article
 *
*
![[double bond, length as m-dash]](https://www.rsc.org/images/entities/char_e001.gif) C stretching from unoxidized graphitic domains, while a notable peak at 1778 cm−1 is assigned to the C
C stretching from unoxidized graphitic domains, while a notable peak at 1778 cm−1 is assigned to the C![[double bond, length as m-dash]](https://www.rsc.org/images/entities/char_e001.gif) O stretch of carboxyl groups.28,29 In SCN spectrum, terminal amino group N–H stretching vibrations (–NH2 or
O stretch of carboxyl groups.28,29 In SCN spectrum, terminal amino group N–H stretching vibrations (–NH2 or ![[double bond, length as m-dash]](https://www.rsc.org/images/entities/char_e001.gif) NH groups) are responsible for a broad band in 3050–3400 cm−1 range. The triazine unit's C
NH groups) are responsible for a broad band in 3050–3400 cm−1 range. The triazine unit's C![[double bond, length as m-dash]](https://www.rsc.org/images/entities/char_e001.gif) N stretching vibration are represented by peaks at 1636 cm−1 and 1538 cm−1. Additional peaks at 1206 cm−1, 1315 cm−1 and 1400 cm−1 are associated with C–N stretching vibrations, while the out-of-plane bending of the tri-s-triazine unit is detected at 815 cm−1. Minimal vibrations related to S-containing groups are noted, likely due to low sulfur quantity and their coincide with C–N vibration peaks.30 The FTIR spectrum of the GO/SCN composite closely resembles that of pristine SCN, suggesting that the structural integrity of SCN is well-maintained despite the incorporation of GO. This preservation is likely due to the low quantity of GO in the composite. However, slight shifts in the peaks are observed in the GO/SCN composite compared to SCN, indicating interactions between GO and SCN components, a phenomenon also reported in other studies.31,32
N stretching vibration are represented by peaks at 1636 cm−1 and 1538 cm−1. Additional peaks at 1206 cm−1, 1315 cm−1 and 1400 cm−1 are associated with C–N stretching vibrations, while the out-of-plane bending of the tri-s-triazine unit is detected at 815 cm−1. Minimal vibrations related to S-containing groups are noted, likely due to low sulfur quantity and their coincide with C–N vibration peaks.30 The FTIR spectrum of the GO/SCN composite closely resembles that of pristine SCN, suggesting that the structural integrity of SCN is well-maintained despite the incorporation of GO. This preservation is likely due to the low quantity of GO in the composite. However, slight shifts in the peaks are observed in the GO/SCN composite compared to SCN, indicating interactions between GO and SCN components, a phenomenon also reported in other studies.31,32
![[double bond, length as m-dash]](https://www.rsc.org/images/entities/char_e001.gif) C–OH); another at 287.8 eV, indicating sp2 N–C
C–OH); another at 287.8 eV, indicating sp2 N–C![[double bond, length as m-dash]](https://www.rsc.org/images/entities/char_e001.gif) N bonds; and third at 284.3 eV which is related to C–C atoms in the triazine ring. A number of nitrogen-containing groups, including sp2 hybridized localized nitrogen (C–N
N bonds; and third at 284.3 eV which is related to C–C atoms in the triazine ring. A number of nitrogen-containing groups, including sp2 hybridized localized nitrogen (C–N![[double bond, length as m-dash]](https://www.rsc.org/images/entities/char_e001.gif) C), tertiary N–(C)3 groups, and amino groups with hydrogen (C–N–H), were identified in the high-resolution XPS of the N 1s region at 398.6 eV, 399.4 eV, and 401 eV which validated the presence of the g-C3N4 matrix. For the region of O 1s, peaks appeared at 529.9 eV and 532.0 eV possibly due to C
C), tertiary N–(C)3 groups, and amino groups with hydrogen (C–N–H), were identified in the high-resolution XPS of the N 1s region at 398.6 eV, 399.4 eV, and 401 eV which validated the presence of the g-C3N4 matrix. For the region of O 1s, peaks appeared at 529.9 eV and 532.0 eV possibly due to C![[double bond, length as m-dash]](https://www.rsc.org/images/entities/char_e001.gif) O and C–O–C components respectively, derived from GO. Further proof of a C–S bond and sulfur inclusion into the lattice structure, presumably by substitution with lattice nitrogen, was provided by a unique peak at 164.1 eV.35–37 The low sulfur content is further verified by its atomic weight percentage, measured at 0.26%, as shown in Table 1.
O and C–O–C components respectively, derived from GO. Further proof of a C–S bond and sulfur inclusion into the lattice structure, presumably by substitution with lattice nitrogen, was provided by a unique peak at 164.1 eV.35–37 The low sulfur content is further verified by its atomic weight percentage, measured at 0.26%, as shown in Table 1.


![[double bond, length as m-dash]](https://www.rsc.org/images/entities/char_e001.gif) C bond is indicated by peak at 1466 cm−1, and the weak symmetric deformation of the CH3 group is detected by peak at 1378 cm−1. These peaks are all significant in determining the structural characteristics of LDPE. These peaks remain unchanged even after the photocatalytic process. However, the appearance of carbonyl groups between 1700–1760 cm−1 after irradiation suggests oxidation products such as carboxylic acids, ketones, aldehydes, and esters. Photocatalytic processes induce the formation of unsaturated groups, observable through peaks at 888 cm−1 and 909 cm−1, on the other hand formation of alcoholic species is indicated by weak stretching within the 3450–3650 cm−1 range. Important indicators of degradation, peroxides present up as complex patterns of absorption between 1000 and 1350 cm−1, which indicate the development of oxygenated products.45,46 Different absorption peaks identify different peroxide groups, such as primary and secondary peroxides. The information obtained from the IR spectra allowed the calculation of carbonyl index which represents the degree of degradation of particles.
C bond is indicated by peak at 1466 cm−1, and the weak symmetric deformation of the CH3 group is detected by peak at 1378 cm−1. These peaks are all significant in determining the structural characteristics of LDPE. These peaks remain unchanged even after the photocatalytic process. However, the appearance of carbonyl groups between 1700–1760 cm−1 after irradiation suggests oxidation products such as carboxylic acids, ketones, aldehydes, and esters. Photocatalytic processes induce the formation of unsaturated groups, observable through peaks at 888 cm−1 and 909 cm−1, on the other hand formation of alcoholic species is indicated by weak stretching within the 3450–3650 cm−1 range. Important indicators of degradation, peroxides present up as complex patterns of absorption between 1000 and 1350 cm−1, which indicate the development of oxygenated products.45,46 Different absorption peaks identify different peroxide groups, such as primary and secondary peroxides. The information obtained from the IR spectra allowed the calculation of carbonyl index which represents the degree of degradation of particles.

![[double bond, length as m-dash]](https://www.rsc.org/images/entities/char_e001.gif) O = A1850–1650/A1420–1500
O = A1850–1650/A1420–1500
![[thin space (1/6-em)]](https://www.rsc.org/images/entities/char_2009.gif)
![[thin space (1/6-em)]](https://www.rsc.org/images/entities/char_2009.gif)
![[thin space (1/6-em)]](https://www.rsc.org/images/entities/char_2009.gif)


.
.
.
.
.
.
.
.
.
.
.
.
.
.
.
.
.
.
.
.
.
.
.
.
.
.
.
.
.
.
.
.
.
.
.
.
.
.
.
.
.
.
.
.
.
.
.
.
.
.
.
.
.
.


