 Open Access Article
Synthesis of copper nanoparticles by a sonication-mediated method using Malpighia glabra fruit extract and their applications
Trung Dien Nguyen *,
Yen Hai Hoang,
Nhung Thi-Tuyet Thai and
Gia Thi-Ngoc Trinh
School of Education, Can Tho University, 3/2 Street, Ninh Kieu, Can Tho, 94000, Vietnam. E-mail: ndtrung@ctu.edu.vn
First published on 28th October 2024
Abstract
This study introduces an environmentally friendly technique for copper nanoparticle synthesis utilizing Malpighia glabra fruit extract under the sonication treatment. The synthesis process and phenol red removal were optimized by a central composite full and response surface design. Highly pure and spherical-shaped copper nanoparticles with an average size of 22.5 nm were formed using 7.4 mL of Malpighia glabra fruit extract and 21.9 mM (AcO)2Cu. Additionally, the extract-mediated nanoparticles opposed the negative charges with a zeta potential of −11.8 mV and high stability of 30 days storage time. The sonication-assisted nanoparticles exhibited the highest inhibition against Gram-positive bacteria (Bacillus subtilis and Staphylococcus aureus), MCF7 human breast cancer cells, and Fusarium solani with 50% inhibition concentrations reaching 12, 0.82, and 80 ppm, respectively. Additionally, the green-synthesized nanomaterials functioned as an effective catalyst to remove phenol red. A conversion of 97% after a 540 seconds reaction was determined on 10 ppm phenol red with the presence of 21.5 ppm copper nanoparticles and 51.8 mM NaBH4. This research highlights the potential of Malpighia glabra fruit extract in the sustainable production of copper nanoparticles, with promising applications in biomedicine, agriculture, and environmental remediation.
1. Introduction
Nanotechnology has emerged as a pivotal field with profound implications spanning diverse scientific disciplines, presenting unprecedented opportunities in materials science, medicine, electronics, and environmental remediation. Amidst the vast array of nanomaterials, copper nanoparticles (Cu NPs) have drawn substantial attention due to their exceptional electrical, thermal, catalytic, and biomedical attributes.1 The methods employed for Cu NPs synthesis not only dictate their dimensions and structure but also exert a profound influence on their physicochemical characteristics,2,3 thereby shaping their suitability for specific applications. Consequently, the synthesis of Cu NPs has become a central research focus, marked by relentless endeavors to refine their production methodologies and intrinsic properties. Recent years have witnessed an escalating emphasis on sustainable and eco-friendly approaches to nanoparticle synthesis. One such pioneering method revolved around the utilization of natural extracts teeming with bioactive compounds, serving as eco-friendly reducing agents. This innovative approach not only aligned with the principles of green chemistry but also conferred distinctive attributes upon the resultant nanoparticles.4,5In this context, Malpighia glabra (M. glabra), commonly recognized as ‘acerola’ or the ‘cherry of the Antilles’ has been suggested as a new candidate for creating nanoparticles. The fruit extract of M. glabra was rich in ascorbic acid, also referred to as vitamin C, in addition to flavonoids, carotenoids, and anthocyanins.6,7 This characteristic highlighted the substantial potential for reduction and antioxidation within the fruit extract of M. glabra, which remained unexplored in Cu NPs synthesis research until now. During the synthesis of Cu NPs, ascorbic acid acted as an effective reductant for converting Cu2+ ions to Cu NPs and an alternative antioxidant to counteract the oxidation of nanoparticles to maintain the stability/purity of the synthesized Cu NPs without inert gas.8 Furthermore, nanoparticle stability was an imperative feature, as it directly influenced their operational stability and functional efficacy in practical applications. To address this critical concern, starch, an environmentally friendly and biodegradable polysaccharide, has risen to prominence as an amicable stabilizing agent.9,10 Its remarkable affinity for metallic surfaces established a protective layer that impeded aggregation and upheld the dispersion stability of nanoparticles.11 This dual functionality of starch, both as a stabilizer and an ecologically sound additive, enhanced its appeal in the realm of nanoparticle synthesis. The use of starch in the Cu NPs synthesis has been explored for a certain duration.12–14 Another concern issue was due to the high oxidation potential of Cu2+/Cu, it is necessary to provide enough energy for the Cu2+ reduction process to completely take place. Consequently, several techniques have been used to facilitate the synthesis such as microwave, conventional heating, sonication, and hydrothermal.15–18 In particular, ultrasound was found to be an effective way to reinforce Cu2+ reduction. Notably, the role of sonication treatment in nanoparticle synthesis cannot be underestimated. The application of high-intensity ultrasound waves to reaction mixtures conferred an array of benefits, encompassing enhanced mixing, reduced reaction durations, and precise control over particle dimensions, shapes, and uniform distribution within the suspension.19,20 Sonication, therefore, served as a potent instrument for tailoring the properties of Cu NPs synthesized by utilizing natural extracts and starch, thereby optimizing their performance for an array of applications. To unlock the potential of Cu NPs, their biological activities were evaluated for diverse biomedical, agricultural, and environmental applications. Previous research has shown their strong antibacterial properties against various pathogens and potential to combat cancer cells.1,21–23 In the context of South Vietnamese agriculture, where Fusarium solani (F. solani) and Rhizoctonia solani (R. solani) pose threats to a wide range of plants while withstanding adverse climate conditions,24 the antifungal activity of Cu NPs has been explored.25–28 Also, Cu NPs were found to be an effective catalyst for dye removal such as methylene blue, methyl orange, phenol red, and safranin.29–31
This study explores the Cu NPs synthesis using M. glabra fruit extract with the assistance of sonication to enhance synthesis efficiency. Response surface methodology optimized synthesis parameters and operational factors for phenol red removal. The study also evaluates the biological activities of the sonication-assisted Cu NPs, including their antibacterial effects on bacteria (Bacillus subtilis, Staphylococcus aureus, Pseudomonas aeruginosa, and Salmonella enterica), cancer cells (A549, HepG2, KB, MCF7), and fungal pathogens (Fusarium solani and Rhizoctonia solani).
2. Experimental
2.1. Materials
The chemicals used for manufacturing and analyzing the characteristics of Cu NPs were supplied by Sigma-Aldrich. Copper(II) acetate monohydrate (AcO)2Cu·H2O, starch (C6H10O5)n, and extract from M. glabra fruit were employed as the precursor, stabilizer, and reductant, respectively, to synthesize the Cu NPs. Potato dextrose agar (PDA) and agar (C12H18O9)n were used for treating fungi. Dimethyl sulfoxide (DMSO, C2H6OS), L-glutamine (C5H10N2O3), sodium bicarbonate (NaHCO3), glucose (C6H12O6), HEPES (C8H18N2O4S), sodium pyruvate (C3H3NaO3), and 3-(4,5-dimethyl-2-thiazolyl)-2,5-diphenyl-2H-tetrazolium bromide (MTT, C18H16BrN5S) were used for evaluating anticancer activity of the synthesized Cu NPs (MG) against human breast cancer cell lines. The Power-Sonic 410 ultrasonic cleaner provided the necessary heat to reduce Cu2+ to Cu0, while the Panasonic NN-ST25JW 22L 800W microwave oven was used to dissolve PDA, (C12H18O9)n, and (C6H10O5)n in the distilled water.2.2. Preparing the extract
Fresh M. glabra fruits were acquired from An Lac market, Can Tho, Vietnam, and thoroughly rinsed with distilled water. The fruits were then processed using a juicer to extract the juice. The resulting juice was further subjected to centrifugation at 4800 rpm for 45 min to separate the solution from the residue. Lastly, the centrifuged solution was vacuum filtrated to obtain a pink extract.2.3. Synthesis of Cu NPs (MG)
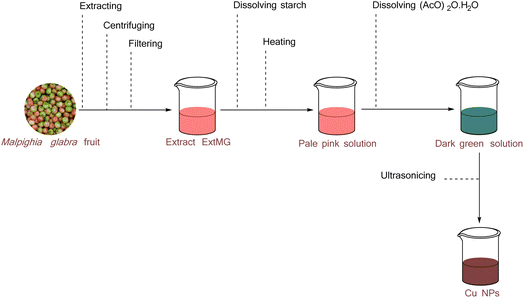
Starch was dissolved in M. glabra extract with constant magnetic stirring and heating, resulting in a homogeneous pale pink solution. This was achieved using a magnetic stirrer (Phoenix RSM-10 HS) set to 800 rpm at 60 °C for 50 min. Subsequently, (AcO)2Cu·H2O was added to each test tube containing the above solution, and the mixture was shaken thoroughly until completely dissolved, producing a dark green solution. Sonication was then conducted on the test tubes at 40 °C for 30 min by Power-Sonic 410 ultrasonic cleaner to obtain Cu NPs. The change from pale pink to red indicated the Cu NPs formation in the studied tubes. The process for synthesizing Cu NPs using M. glabra extract with the assistance of ultrasound was illustrated in Fig. 1.Starch concentration was fixed at 10 g L−1. Two continuous factors included varying volumes of M. glabra extract (X1 = 4, 7, and 10 mL) and (AcO)2Cu concentrations (X2 = 10, 20, and 30 mM) on the response variables: maximum absorbance Y1 and minimizing the surface plasmon resonance (SPR) Y2. Response surface design (RSD) was used to evaluate the individual variables' interactions with the response variables. Central composite full (CCF) benefited from the experiment design. A randomized experiment of 13 runs was investigated with five center points: X1 = 7 mL and X2 = 20 mM. The values of parameters for synthesizing Cu NPs were fixed in columns 2 and 3 of Table 1. Model terms including main and quadratic were used to describe the influence of synthesis parameters (X1 and X2) on the response variables (Y1 and Y2), corresponding to the following formula (1).
 | (1) |
| Run order | Ext, mL | Cu, mM | Absorbance | SPR, nm |
|---|---|---|---|---|
| 1 | 7 | 30 | 0.827 | 602.4 |
| 2 | 4 | 30 | 0.516 | 604.6 |
| 3 | 10 | 10 | 0.416 | 608.8 |
| 4 | 7 | 10 | 0.564 | 605.8 |
| 5 | 7 | 20 | 1.196 | 598.6 |
| 6 | 4 | 20 | 0.694 | 604.4 |
| 7 | 7 | 20 | 1.202 | 598.2 |
| 8 | 10 | 30 | 0.705 | 603.2 |
| 9 | 10 | 20 | 0.922 | 600.6 |
| 10 | 7 | 20 | 1.212 | 599.2 |
| 11 | 7 | 20 | 1.187 | 598.4 |
| 12 | 7 | 20 | 1.179 | 597.4 |
| 13 | 4 | 10 | 0.374 | 610.2 |
The suitability of the produced models was evaluated by the coefficient of determination (denoted R-square R2) and probability value p. The values were considered statistically meaningful for the models with p < 0.05 and R2 approximately approaching 1. Optimize responses were utilized to determine the optimal values (X1 and X2) for Cu NPs synthesis reaching the highest point of Y1 and the lowest point of Y2. Experiment design, model generation, and optimization were conducted using the OriginPro 2024 software. Cu NPs produced under the optimal operating conditions were designated as Cu NPs (MG).
2.4. Characteristics of Cu NPs (MG)
UV-Vis spectrophotometry (V730, Jasco) was performed using a double-beam spectrophotometer with a 10 mm quartz cell. Wavelengths were measured between 400–700 nm at a scanning speed of 1000 nm min−1 with a data interval of 0.2 nm to monitor the formation of Cu NPs and assess the stability of Cu NPs (MG) over a 6 days period. For morphological analysis, a transmission electron microscope/high-resolution transmission electron microscopy (TEM/HRTEM, Jem-2100 LaB6, Jeol) was used to examine the shape and particle size distribution of the synthesized Cu NPs (MG). The test sample was placed on a 300 mesh carbon-coated copper grid, and images were captured at an acceleration voltage of 200 kV. The chemical composition and functional groups of the materials were analyzed using a Thermo Nicolet 6700 Fourier transform infrared (FTIR) spectrometer, with wavenumbers scanned from 4000 to 400 cm−1. The zeta potential and particle size distribution of the Cu NPs (MG) were determined using an SZ-100 nanoparticle analyzer at 25 °C, with the mean zeta potential and average particle size reported using a Malvern Zetasizer Nano ZS. The crystalline phase of the studied sample was verified with a Bruker D2 Phaser X-ray diffraction (XRD) instrument using Cu Kα radiation with 40 mA and 40 kV, and diffracted intensities were measured at 2θ angles between 10° and 80°. The estimation of the average crystallite size of the synthesized Cu NPs (MG) was accomplished through the utilization of Debye Scherrer's formula (2).
 | (2) |
To evaluate the synthesis efficiency, the concentration of Cu2+ ions in the samples was analyzed using inductively coupled plasma optical emission spectroscopy (ICP-OES). The evaluation encompassed both the initial solution consisting solely of the precursor 21.9 mM (AcO)2Cu and the resulting solution of Cu NPs (MG). Prior to analysis, the Cu NPs (MG) solution synthesized at the optimal parameter underwent at 6800 rpm for 3 hours centrifugation to remove solid components. The synthesis percentage, denoted as H, was determined using formula (3).
 | (3) |
The absorption wavelength was measured using diffuse reflectance spectroscopy (DRS) on a Cary 5000 UV-Vis-NIR spectrophotometer. The resulting data was then processed to calculate the band gap energy (Eg) of Cu NPs (MG) using the Tauc plot, as given in the Kubelka–Munk function (4).
| [hνF(R)]2 = A(hν − Eg) | (4) |
2.5. Antibacterial activity of Cu NPs (MG)
To assess the antibacterial activity, the well-diffusion method was employed for the synthesized Cu NPs (MG), investigated against various bacterial and fungal strains, including Bacillus subtilis (B. subtilis) ATCC 6633 and Staphylococcus aureus (S. aureus) ATCC 12600 for Gram-positive bacteria testing, as well as Pseudomonas aeruginosa (P. aeruginosa) ATCC 15442 and Salmonella enterica (S. enterica) ATCC 35664 for Gram-negative bacteria testing. Following MacFarland's standard guidelines, the pathogenic cultures were subcultured and incubated at 37 °C 24 h to achieve a concentration of 5 × 10⁵ CFU mL−1. Gram-positive bacteria were exposed to ampicillin as the control, while Gram-negative bacteria were exposed to cefotaxime. The sonication-mediated Cu NPs (MG) was prepared at four concentrations of 0.25, 1.00, 4.00, and 16.00 ppm. The concentration at which 50% inhibition was reached, indicated by the IC50 value, was observed for the synthesized Cu NPs (MG) on 96-well microplates, and the absorbance was measured at the wavelength of 630 nm.2.6. Antiproliferative activity of Cu NPs (MG) on cancer cell lines
The cytotoxicity assay of Cu NPs (MG) was carried out on four cancer cell lines, namely lung cancer A549, hepatic cancer HepG2, epidermal carcinoma KB, and breast cancer MCF7, using the MTT method. The MTT method involved culturing the cancer cell lines in a 96-well plate with a cell density of 5000 cells per well, using DMEM (Dulbecco's modified Eagle's medium) supplemented with the following components: 2 mM L-glutamine, 1.5 g L−1 sodium bicarbonate, 4.5 g L−1 glucose, 10 mM HEPES, 1.0 mM sodium pyruvate, and 10% FBS (fetal bovine serum). The culture was incubated at 37 °C with 5% CO2. After 24 h of incubation, the 96-well plate was switched to an FBS-free DMEM medium. Cu NPs (MG) diluted with DMSO solvent at varying concentrations of 0.25, 1.00, 4.00, and 16.00 ppm, were added to the wells, ensuring that the final concentration of DMSO in the culture medium did not exceed 0.05% to avoid solvent toxicity. After 48 h, 20 μL of MTT solution with a concentration of 2 mg mL−1 was added to each well, followed by a further 4 hours incubation period. The surviving cells' cellular enzymes converted MTT to formazan crystals that were insoluble in the culture medium. Subsequently, DMSO was used to dissolve the formazan crystals, and the absorbance was measured at 550 nm. The percentage of surviving cells represented the toxicity of Cu NPs (MG), with higher toxicity leading to a lower number of surviving cells. The percentage toxicity was determined by the absorbance in the test wells compared to the control wells. In this experiment, ellipticine was used as a control sample.2.7. Antifungal activity of Cu NPs (MG)
The antifungal activity of the sonication-assisted Cu NPs (MG) was evaluated using the poison plate method. Cu NPs were diluted to four different concentrations for evaluating antifungal activity. For F. solani, Cu NPs were tested at concentrations of 60, 70, 80, and 90 ppm, while for R. solani, the concentrations used were 80, 100, 120, and 140 ppm. A mixture of 20 g L−1 PDA and 20 g L−1 (C12H18O9)n in water was irradiated with a microwave and used as the culture medium for reference samples. For the test samples, the culture medium was prepared similarly, but with the addition of the synthesized Cu NPs at various concentrations. Each Cu NPs concentration was added separately to sterilized Petri dishes, and a 5.0 mm diameter piece of active mycelium was placed at the center of each plate in a sterile laminar flow cabinet. The plates were then incubated at 25 °C for one week for F. solani and two weeks for R. solani. Each test was conducted five times. The inhibition of mycelial growth (I) was calculated using a specified formula (5).
 | (5) |
2.8. Phenol red removal
To prepare the catalyst for PR removal, Cu NPs (MG) solution was centrifugated at 6800 rpm for 2 h to obtain precipitates. The resulting precipitates were washed with water as well as ethanol and vacuum dried at 60 °C overnight. The red-brown product as-prepared by drying in a vacuum oven was used as a catalyst in the reaction for PR removal and denoted as Cat-Cu NPs (MG). The experiments were conducted at 25 °C using a 100 mL solution of 10 ppm PR. The suspension with the presence of Cat-Cu NPs (MG) was stirred for 50 min to establish adsorption/desorption equilibrium. After continuous agitation, varying amounts of reductants NaBH4 were introduced. The reaction process was monitored for 9 min. The reaction solution was then filtered to eliminate Cat-Cu NPs (MG) and the resulting solution on a UV-visible spectrophotometer at 560 nm wavelength. PR removal efficiency (RE) was measured by PR concentration and calculated by the formula (6).
 | (6) |
For determining the efficiency of PR conversion, two operated components were established changing Cat-Cu NPs (MG) dosage (X3 = 10, 20, and 30 ppm) and NaBH4 concentrations (X4 = 40, 50, and 60 mM) on the response variables: PR conversion Y3. RSD and CCF were designed to calculate the interactions of the separate variables with the response variable. A randomized experiment of 14 runs was considered with six center points: X3 = 20 ppm and X4 = 50 mM. The optimal values for investing catalytic activity of Cat-Cu NPs (MG) were set in columns 2 and 3 of Table 6. Model terms including main and quadratic were employed to illustrate the influence of X3 and X4 on Y4, according to the following formula (1).
2.9. Data analysis
The statistical analysis for bacteria, cancer cells, and fungi was performed using Descriptive Statistics in Excel with the Data Analysis Toolpak. The data were presented as the mean value ± standard deviation, based on triplicate measurements for bacteria and cancer cells, and five separate experiments for fungi. Results were considered significant if the confidence level was below 5%.3. Results and discussion
3.1. Determining optimal values for Cu NPs (MG) synthesis
Table 1 presented the values of the response variables obtained from the designed experiments. From the obtained results, a model for investigating the synthesis parameters was fitted. The predictable regression coefficients for the CCF model were provided in Table 2. Regularly, a lower p-value indicated a higher meaning for the studied response variations while a high R2-value confirmed the fitness of the suggested model. In the current study, R2 values were 0.970 and 0.967, respectively, verifying that the proposed model for the dependence of absorbance, as well as SPR on extract volume and (AcO)2Cu concentration, was completely consistent. Additionally, main and quadratic terms of extract volume and precursor concentration exhibited significant effects on the studied response variables (absorbance and SPR) with p < 0.05. The influence of extract volume and precursor concentration on the response variables was identical in the Cu NPs synthesis.| Regression coefficients | Absorbance | SPR, nm | p-Value of αi and αii | |
|---|---|---|---|---|
| Absorbance | SPR | |||
| α0 | 1.168 | 598.6 | ||
| α1 | 0.077 | −1.1 | 0.025 | 0.020 |
| α2 | 0.116 | −2.4 | 0.003 | < 0.001 |
| α11 | −0.293 | 3.4 | < 0.001 | < 0.001 |
| α22 | −0.406 | 5.0 | < 0.001 | < 0.001 |
| R2 | 0.970 | 0.967 | ||
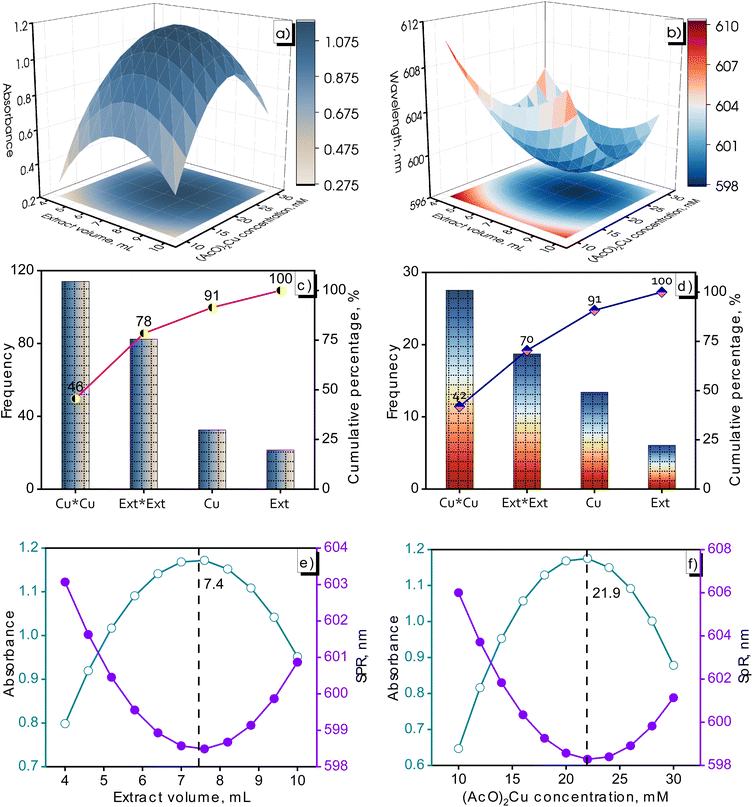
In the synthesis of metallic nanomaterials, the concentration and size of the formed nanoparticles are considered vital factors besides the shape of the materials. Metal-based nanoparticle concentration and particle size were quantified by UV-Vis spectroscopy. The Cu NPs formation was confirmed by SPR appearance located in the range of 550–600 nm.32 Small nanoparticles exhibited a blue-shifted SPR. Conversely, a red-shifted SPR was recognized for larger nanoparticles. In addition, the SPR peak tended to shift toward longer wavelengths as the particle size increased.33 The metallic nanoparticle concentration in a solution is proportional to the intensity of SPR-related absorbance. The influence of continuous parameters (volume of M. glabra fruit extract and precursor concentration) on the response variables (absorbance and SPR) was shown in Fig. 2. The absorbance of the designed samples ranged from 0.374 to 1.212 while the SPR fluctuated in a range of 598.2–610.2 nm.
Generally, the process of converting Cu2+ ions into Cu0 occurred in two distinct steps. During the initial period, the ascorbic acid was transformed into ascorbate radicals. Subsequently, Cu2+ ions constantly reacted with the ascorbate radicals to form Cu0. Interestingly, effective reduction of Cu2+ ions was found in a high concentration of ascorbic acid. The presence of Cu2O phases was confirmed at low concentrations of ascorbic acid.34 Furthermore, precursor concentration played a fundamental role in the nucleation and growth of Cu NPs. There was a speedy enhancement in the nucleation rate at high precursor concentration, directing to the Cu NPs formation with smaller particles. In opposition, lower concentrations of precursor led to slow down the nucleation. A higher concentration of Cu2+ was commonly followed by the faster growth of existing Cu NPs. On the other hand, excessive concentrations of precursors caused to aggregation.35,36
As clearly observed in Fig. 2a and Table 1, increasing the M. glabra fruit extract volume from 4 to 7 mL was advantageous to the Cu NPs formation. Reductant deficiency during the Cu2+ conversion to Cu0 at low extract volume resulted in limited Cu NPs formation and following aggregation. The presence of abundant reducing agents at a high M. glabra fruit extract considerably influenced the production and protection of Cu NPs. Reductants facilitated the reduction of Cu2+ ions to form stable Cu NPs, preventing effective aggregation for the produced nanoparticles. The nanoparticle size increased for agglomeration began to occur and the Cu2+ conversion rate heightened at 10 mL of M. glabra fruit extract, leading to a decline in the absorbance of Cu NPs. The results of this experiment aligned well with a previous study by Din and Ghosh.37,38
The influence of the (AcO)2Cu precursor on absorbance and SPR was shown in Fig. 2b and Table 1. The relationship between (AcO)2Cu concentration, absorbance, and SPR was analogous to the effect of the extract volume. Thus, an appropriate concentration of (AcO)2Cu was required for synthesizing Cu NPs. As maintaining a consistent volume of M. glabra fruit extract, the absorption intensity exhibits an interesting trend with varying concentrations of (AcO)2Cu. The absorbance substantially increased with the samples prepared at (AcO)2Cu concentrations from 10 to 20 mM and then considerably decreased with a further increase of 30 mM (AcO)2Cu. Meanwhile, SPR exhibited intriguing behavior as the concentration of (AcO)2Cu varied and the lowest value occurred at 20 mM (AcO)2Cu. According to Sadia, high CuSO4 concentrations contributed to particle size enlargement and a broader size distribution.39
Fig. 2c and d demonstrated the significance of various terms in the Cu NPs formation, as assessed by the cumulative percentages for the absorbance value and SPR of the produced Cu NPs. The results show that the Cu*Cu term had the greatest impact on the synthesis process, followed by Ext*Ext. The contributions of the Cu*Cu and Ext*Ext terms account for 78% of the absorbance value and 70% of the SPR, respectively. The contribution percentages of the factors decreased in the following order: Cu*Cu > Ext*Ext > Cu > Ext. Based on the obtained results, it can be concluded that both the extract volume and Cu(AcO)2 concentration significantly influenced the Cu NPs production.
The variations in absorbance and SPR at different extract volumes and (AcO)2Cu concentrations are depicted in Fig. 2e and f. The changes in absorbance as a function of extract volume and (AcO)2Cu concentration follow a curve with a maximum point. Conversely, the curve showing dependence of SPR-extract volume/Cu(AcO)2Cu concentration reached a minimum point. Optimal conditions for the Cu NPs (MG) synthesis were acknowledged with maximum absorbance and minimum SPR of the obtained Cu NPs. An optimized response model was used to determine the optimal volume of M. glabra fruit extract and (AcO)2Cu concentration. The calculated results pointed to an optimal combination for the Cu NPs (MG) synthesis as the following: 7.4 mL of M. glabra fruit extract and 21.9 mM of (AcO)2Cu. Through investigations, the synthesis of Cu NPs (MG) was carried out successfully with optimal parameters, which involved using 7.4 mL of M. glabra fruit extract, 10 g L−1 of starch, (AcO)2Cu concentration of 21.9 mM, and sonicating the system at 40 °C for 30 min. The synthesis efficiency was assessed to be 86% based on the Cu2+ concentration using ICP-OES analysis. The detailed outcomes were provided in Table 3.
| Sample | Cu2+ concentration, ppm | Cu NPs concentration, ppm | Synthesis efficiency, % |
|---|---|---|---|
| (AcO)2Cu | 357.5 | 86 | |
| Cu NPs (MG) | 50.9 | 306.6 |
3.2. Analyzing characteristics of the synthesized Cu NPs (MG)
Fig. 3 was used to illustrate the optical properties of Cu NPs (MG) and evaluate the stability of the Cu NPs (MG) solution at room temperature. The synthesized Cu NPs (MG) using M. glabra fruit extract at the obtained optimal parameters was identified initially on UV-Vis spectra. As can be seen in Fig. 3a, there was an apparition of an emission peak located at 600.8 nm, characterizing the SPR of Cu NPs. The location of SPR was consistent with a study by Yaremchuk et al.40 The adsorption intensity of Cu NPs (MG) at 600.8 nm reached 1.328. The alterations in absorbance and SPR of Cu NPs (MG) solution during storage were presented in Fig. 3b. The stability of the Cu NPs (MG) solution was evaluated in a 30 days storage period. Basically, Cu NPs (MG) was highly stable at room temperature for 30 days of testing. There was continued formation of nanoparticles in the as-synthesized Cu NPs (MG) solution during the storage time. This was explained by the presence of the unreacted Cu2+ ions and the reductants in the Cu NPs (MG) solution. Along with the increase in Cu NPs (MG) concentration, there was a slight alteration in the particle size based on a redshift of SPR from 600 to 608 nm. A major reason was a deficiency of stabilizers to protect the further nucleated nanoparticles in long-term storage.41 An additional explanation was attributed to the slow oxidation of the nanoparticles, leading to a gradual growth of the oxide phases.42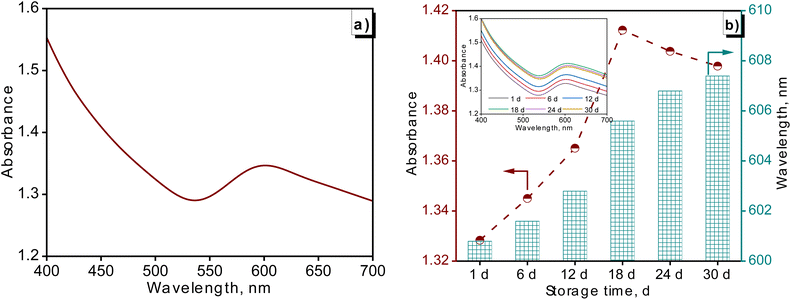 | ||
| Fig. 3 UV-vis of Cu NPs (MG) synthesized at optimal parameters (a) and the presence of Cu NPs in the UV-vis spectra at altered storage times (b). | ||
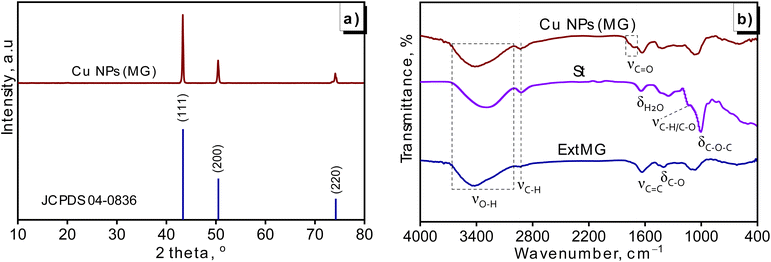
The X-ray diffraction (XRD) analysis was a fundamental technique used to characterize the crystalline structure of nanoparticles. In this study, the XRD pattern of the generated Cu NPs (MG) was shown in Fig. 4a. The pattern exhibited three distinct peaks at 2θ values of 43.4, 50.4, and 74.1°, indicative of the copper face-centered cubic (fcc) lattice with corresponding Miller indices of (111), (200), and (220) (JCPDS, No. 04-0836). Notably, the peak intensity for (111) was significantly higher than the others, suggesting that the primary orientation of the crystal structure in Cu NPs (MG) was the (111) plane. Furthermore, the XRD pattern demonstrated the absence of significant impurity peaks, indicating a clean sample. The average crystallite size of the generated Cu NPs (MG), as documented in Table 4, measured 17.0 nm.
| Position 2θ, o | FWHM | Size of nanoparticle, nm | Average size, nm |
|---|---|---|---|
| 43.4 | 0.486 | 17.6 | 17.0 |
| 50.4 | 0.505 | 17.4 | |
| 74.1 | 0.621 | 16.0 |
The comparison of FTIR spectra among the produced Cu NPs (MG), M. glabra fruit extract (ExtMG), and pure starch (St) samples was depicted in Fig. 4b. The spectrum of starch exhibited typical patterns observed in polysaccharides of this nature, characterized by features like hydroxyl bands within the range of 3650–3000 cm−1 attributed to glucopyranose rings, aliphatic group C–H stretching vibrations at 2920 cm−1, indications of adsorbed water at 1640 cm−1, C–C and C–O stretching at 1140 cm−1, as well as C–O–C bending vibration at 1010 cm−1.43 For the fruit extract of M. glabra, the FTIR spectrum also displayed a characteristic band of the hydroxyl group in 3600–3000 cm−1, as well as stretching vibrations at 1632 cm−1 and 1402 cm−1, corresponding to the C![[double bond, length as m-dash]](https://www.rsc.org/images/entities/char_e001.gif) C double bond in the lactone ring and the C–O bond of enol hydroxyl groups in the structure of ascorbic acid.44 These discernible signals of both starch and fruit extract were distinctly replicated in the FTIR spectrum of Cu NPs (MG), affirming the proficient coating ability of starch and ascorbic acid on the particle surface, leading to robust stabilization. Notably, additional signals emerged within the 1800–1690 cm−1 range in Cu NPs (MG), attributed to the transformation of enol hydroxyl groups in ascorbic acid into carbonyl groups through reduction.45 The hydroxyl (–OH) and carbonyl (–C
C double bond in the lactone ring and the C–O bond of enol hydroxyl groups in the structure of ascorbic acid.44 These discernible signals of both starch and fruit extract were distinctly replicated in the FTIR spectrum of Cu NPs (MG), affirming the proficient coating ability of starch and ascorbic acid on the particle surface, leading to robust stabilization. Notably, additional signals emerged within the 1800–1690 cm−1 range in Cu NPs (MG), attributed to the transformation of enol hydroxyl groups in ascorbic acid into carbonyl groups through reduction.45 The hydroxyl (–OH) and carbonyl (–C![[double bond, length as m-dash]](https://www.rsc.org/images/entities/char_e001.gif) O) groups played a key role in forming hydrogen bonds with phenol red, while the C–O and C
O) groups played a key role in forming hydrogen bonds with phenol red, while the C–O and C![[double bond, length as m-dash]](https://www.rsc.org/images/entities/char_e001.gif) C groups contributed to dipole–dipole interactions and π–π stacking. Together, these functional groups enhanced the binding affinity of the Cu NPs (MG) for phenol red, making the material highly effective for adsorption applications.
C groups contributed to dipole–dipole interactions and π–π stacking. Together, these functional groups enhanced the binding affinity of the Cu NPs (MG) for phenol red, making the material highly effective for adsorption applications.
In order to investigate the morphology of the synthesized Cu NPs (MG), TEM images were captured to examine the shape and size distribution of the particles. Fig. 5a showed spherical and monodisperse particles in Cu NPs (MG) solution, each displaying equivalent sizes. A detailed analysis was performed to obtain a comprehensive understanding of the particle size distribution, as depicted in Fig. 5b, revealing particle diameters ranging from 11 to 44 nm. The average diameter of the spherical particles was calculated to be 22.5 nm, with a standard deviation of 6.9 nm. These findings affirmed the successful stabilization of the system through the combination of starch and M. glabra fruit extract as well as the enhancement by sonication treatment, leading to the formation of small and stable particles. The HRTEM image provided valuable insights into the structural characteristics of the synthesized Cu NPs (MG), particularly regarding their crystallinity and atomic arrangement in Fig. 5c. The distinct lattice fringes corresponding to the (111) planes of copper, measured spacings of 0.22, 0.24, and 0.25 nm, indicated a well-organized crystalline structure. These interplanar distances aligned well with the theoretical values for the face-centered cubic structure of metallic copper, close to the d-spacing value of the Cu (111) plane (JCPDS 04-0836, Fm![[3 with combining macron]](https://www.rsc.org/images/entities/char_0033_0304.gif) m, and d111 = 0.21 nm).
m, and d111 = 0.21 nm).
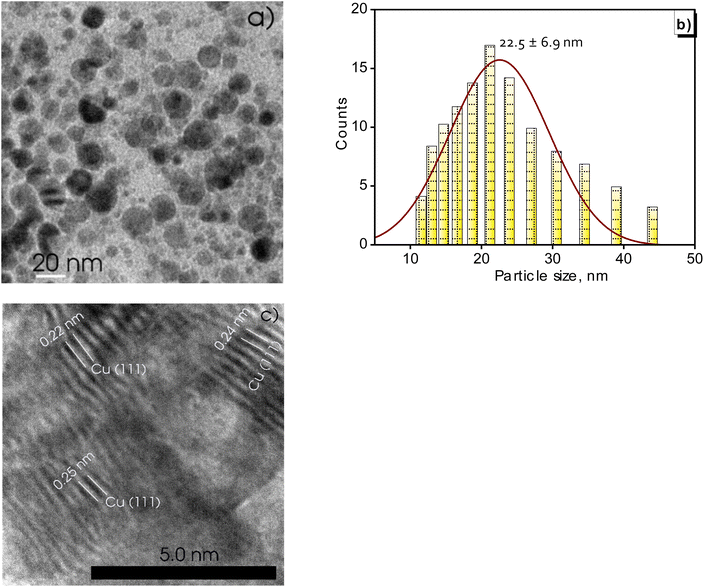 | ||
| Fig. 5 TEM image (a), size distribution analysis (b), and high-resolution TEM (c) of the green-synthesized Cu NPs (MG). | ||
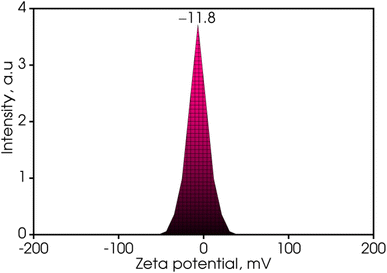
The surface of the synthesized Cu NPs (MG) in this investigation exhibited a negative zeta potential, as evidenced in Fig. 6. The zeta potential of metallic nanoparticles was known to be significantly influenced by the presence of a stabilizing agent. Specifically, the zeta potential of the generated Cu NPs (MG) was measured at −11.8 mV. This negative charge suggested the stability of the nanoparticles due to an increase in electrostatic repulsion forces, aligning with the findings reported in a study conducted by Ilbasmis-Tamer.46 However, it should be noted that this value falls short of the optimal range of −30 mV required for achieving the best state of stable dispersion for Cu NPs (MG).47 This discrepancy could be attributed to the presence of ascorbic acid which results in a low pH medium. The zeta potential of the suspension could display a pH-responsive behavior, revealing the possibility of weak positive values on starch under acidic conditions.48
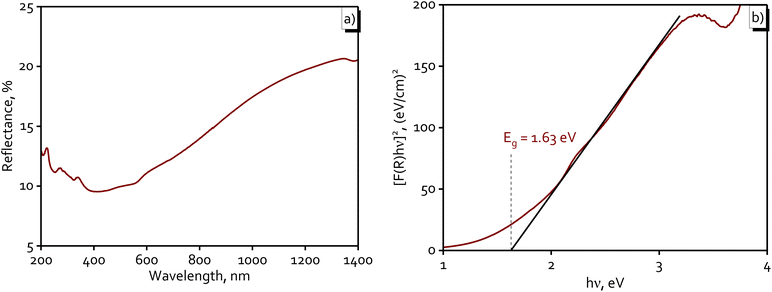
Fig. 7 provided important insights into the optical properties and potential applications of Cu NPs (MG). In Fig. 7a, the DRS spectra showed that the nanoparticles exhibited low reflectance in the UV region (200–400 nm), indicating strong absorption in this range, with reflectance gradually increasing towards the visible and near-infrared regions. This behavior suggested that Cu NPs (MG) could absorb light over a broad spectrum, particularly within the visible light range (400–700 nm), making them highly suitable for photocatalytic applications under sunlight. Fig. 7b displayed the Tauc plot, which revealed an Eg of 1.63 eV, placing the nanoparticles in an optimal range for visible light activation. This relatively small Eg enhanced light absorption and facilitated electron–hole pair generation, a critical factor in catalytic reactions. The combination of visible light absorption and semiconductor-like properties made Cu NPs (MG) promising candidates for visible light-driven photocatalytic applications.
3.3. Investigating antimicrobial activity of the produced Cu NPs (MG)
This study encompassed an assessment of the biological efficacy of the synthesized Cu NPs (MG), spanning both bacteria and cancer cells. The findings of these investigations were displayed in Fig. 8, which illustrated the impact of varying Cu NPs concentrations on Gram-positive bacteria (S. aureus and B. subtilis), Gram-negative bacteria (S. enterica and P. aeruginosa), cancer cells (A549, HepG2, KB, and MCF7), and fungi (F. solani and R. solani). It was evident that treating Gram-positive bacteria with Cu NPs at 4.00 ppm led to a potential inhibitory effect, which escalated substantially to 59–68% at 16.00 ppm. In contrast, the inhibitory response against Gram-negative bacteria within the same range of Cu NPs concentrations was unremarkable, remaining below 25% for S. enterica and P. aeruginosa. Moving to anticancer activity, the outcomes of the cancer cell tests were encouraging. Cu NPs exhibited inhibitory effects even at low concentrations of 0.25 and 1.00 ppm, surpassing the 50% inhibitory threshold at 4.00 ppm. The value for half-maximal inhibitory concentration (IC50) was computed and was presented in Table 5. This calculation further reaffirmed the significant inhibitory impact of Cu NPs on positive-gram bacteria. For B. subtilis and S. aureus, the IC50 values were acceptable with 12.01 and 12.06 ppm, respectively. Conversely, against Gram-negative bacteria, Cu NPs showed limited inhibition, rendering an unattainable IC50 value. Regarding cancer cell treatment, Cu NPs showcased improved performance, exhibiting IC50 values ranging from 0.82 to 3.03 ppm, increasing from MCF7, A549, and KB to HepG2. The strong antibacterial and antifungal effects of the synthesized Cu NPs were likely due to a common mechanism where the release of Cu2+ ions leads to damage to microbial cell membranes.49,50 This mechanism was particularly potent against Gram-positive bacteria compared to Gram-negative bacteria due to the structural intricacies of Gram-negative bacteria strains. The Gram-positive bacteria's thinner cell wall facilitates a more efficient exchange of compounds, thereby enhancing inhibition.51 In the realm of anticancer activity, Cu NPs have proven their capability to elicit apoptosis and manifest cytotoxic effects across diverse cancer cell lines. This was achieved by degrading isolated DNA molecules via singlet oxygen generation, thereby contributing to their anti-cancer potential.21 These findings highlight the potential of Cu NPs (MG) as an effective agent for targeting both Gram-positive bacteria and cancer cells.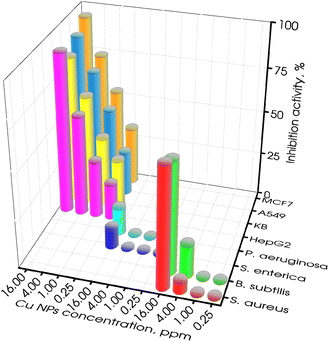 | ||
| Fig. 8 Inhibition activity of the sonication-assisted Cu NPs (MG) for Gram-positive bacterial, Gram-negative bacterial, and cancer cells. | ||
| Bacteria/cancer cells | IC50 of Cu NPs, ppm | IC50 of control, ppm | |
|---|---|---|---|
| Positive-gram bacteria | S. aureus | 12.06 ± 0.48 | 0.03 ± 0.01 |
| B. subtilis | 12.01 ± 0.26 | 4.93 ± 0.20 | |
| Negative-gram bacteria | S. enterica | — | 0.59 ± 0.07 |
| P. aeruginosa | — | 5.91 ± 0.20 | |
| Cancer cells | HepG2 | 3.03 ± 0.14 | 0.61 ± 0.14 |
| KB | 2.33 ± 0.10 | 0.38 ± 0.01 | |
| A549 | 1.09 ± 0.05 | 0.56 ± 0.03 | |
| MCF7 | 0.82 ± 0.04 | 0.63 ± 0.04 | |
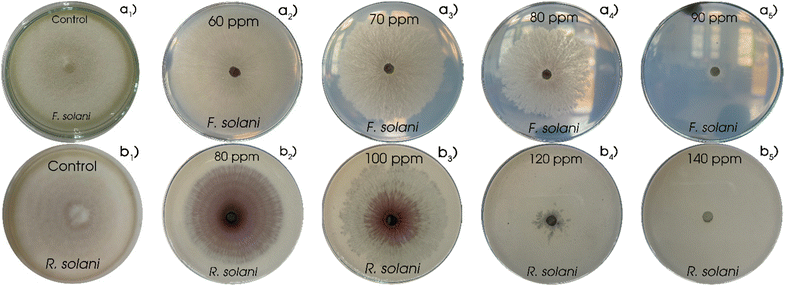
For antifungal activity testing, individual fungal samples of F. solani and R. solani were subjected to varying concentrations of Cu NPs. Subsequently, the assessment of diffuse growth occurred to explore the initial antifungal efficacy of the generated Cu NPs (MG). As was evident from the data presented in Fig. 9 and 10, robust antifungal activity against F. solani and R. solani was demonstrated by Cu NPs (MG). In the control samples (Fig. 9a1 and b1), the fungi spread circularly, blanketing the medium layer with a pale white haze. In subsequent samples where Cu NPs (MG) was introduced, the presence of visible mycelium and reddish-brown colored Cu NPs (MG) was observed to signify the growth inhibition of the fungi. Fig. 10 exemplified the antifungal efficacy of Cu NPs through a variable concentration range of 60–90 ppm with an interval of 10 ppm for F. solani and 80–140 ppm with a gap of 20 ppm for R. solani. Overall, elevating Cu NPs concentration resulted in a distinct decline in fungal growth, with pronounced inhibition at higher concentrations. In the case of F. solani, control sample expansion reached 68.0 mm, diminishing by 5, 23, 56, and 94% in samples with escalating Cu NPs concentration within the tested range. Similarly, for R. solani, the corresponding figures were 18, 21, 85, and 99%, respectively, with initial expansion at 67.3 mm. Evidently, modest Cu NPs concentrations showed limited antifungal effects, while efficacy became prominent at higher levels. Complete growth inhibition occurred at 90 ppm of Cu NPs for R. solani while Cu NPs concentration was found at 120 ppm, showcasing the potent effect. The IC50 value of Cu NPs for F. solani reached 80 ppm while Cu NPs inhibited 50% of R. solani growth at a higher concentration of 111 ppm, reinforcing the efficacy of Cu NPs against both fungal strains. As can be seen, F. solani was more sensitive to R. solani for Cu NPs. Among various pathogens, F. solani and R. solani were considered substantial, affecting damping-off and root-rot infections to reduce agricultural productivity.52,53 Therefore, the synthesized Cu NPs (MG) was predicted to be a potential material for eliminating harmful fungal pathogens: F. solani and R. solani on plants.
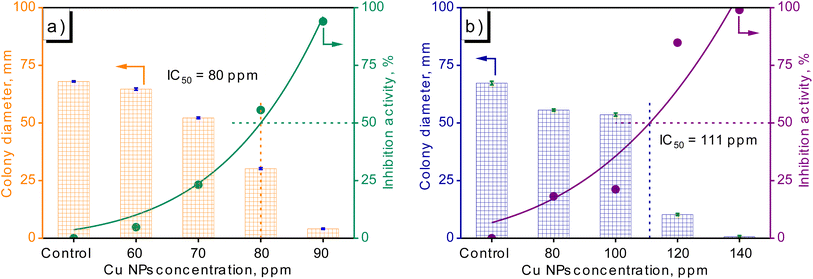 | ||
| Fig. 10 Growth diameter and inhibitory activity of fungi at various Cu NPs concentrations: F. solani (a) and R. solani (b). | ||
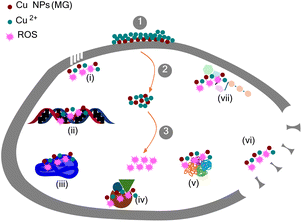
The mechanism for the growth inhibition of microorganisms was outlined in Fig. 11. Initially, Cu NPs attached to the cell wall and released Cu2+ ions. In the following phase, Cu NPs-Cu2+ adhered to the cell membrane and penetrated the cell. Reactive oxygen species (ROS) production by the formed Cu NPs-Cu2+ occurred in the third stage. The combined presence of Cu NPs, Cu2+, and ROS led to the destruction of the cell membrane through various mechanisms: Cu NPs/Cu2+ ions increased membrane permeability (i), disrupted adenosine triphosphate production (vii), and damaged the cell wall and membrane (vii); a mixture of Cu NPs-Cu2+-ROS interrupted deoxyribonucleic acid replication, triggered deoxyribonucleic acid degradation (ii), denatured ribosomes (iii), interfered with enzymatic activities (iv), and denatured proteins (v).54,55
3.4. Determining removal efficiency for phenol red
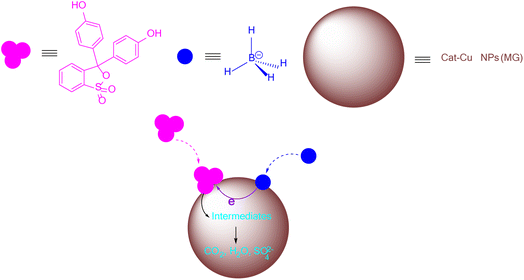
The degradation of PR in the presence of NaBH4 occurred through electron transfer. The mechanism of PR degradation in the presence of NaBH4 on the catalytic surface of Cat-Cu NPs (MG) was described in Fig. 12. NaBH4 was recognized as a strong reducer and was incapable of reducing dyes without a catalyst due to high redox potentials.56 To promote the effectiveness of NaBH4 for dye removal, catalysts acted as an electron transfer system between the hydride ions donors and the textile dye receptors. The process of dye elimination catalyzed metallic nanocatalysts by NaBH4 was described through an electron transfer mechanism. The reducer and dyes were adsorbed on the large surface of metallic nanoparticles. As NaBH4 reductant adsorbed on the nanoparticles, reductive activity declined due to strong nucleophiles and formed BH4− ions. Alternatively, dyes acted as electrophiles when adsorbed on nanoparticles, increasing reducing activity and producing positive charges. Electron transfer reaction simultaneously occurred on the surface of metal nanoparticles, destroying dye structure to form small molecules, CO2, H2O, and SO42−.57,58Table 6 displayed the values of the response variable-PR conversion attained by the created tests with catalyst dosages and reductant concentrations. Based on the results obtained from the CCF design, a model for predicting an effective PR conversion was fitted. The predictable regression coefficients for the CCF model were detailed in Table 7. R2 values were found at 0.957, confirming that the proposed model for the dependence of PR conversion on Cat-Cu NPs (MG) dosage and NaBH4 concentration was entirely reliable. Furthermore, main and quadratic terms of Cat-Cu NPs (MG) dosage and NaBH4 concentration significantly affected the studied response variables-PR conversion with p < 0.05. The impacts of Cat-Cu NPs (MG) dosage and NaBH4 concentration on the catalytic activity for eliminating PR tend to be similar.
| Run order | Cat, ppm | Rec, mM | PR removal efficiency, % |
|---|---|---|---|
| 1 | 20 | 50 | 97 |
| 2 | 20 | 40 | 53 |
| 3 | 10 | 50 | 60 |
| 4 | 30 | 60 | 58 |
| 5 | 20 | 50 | 95 |
| 6 | 20 | 60 | 88 |
| 7 | 10 | 60 | 50 |
| 8 | 30 | 50 | 85 |
| 9 | 20 | 50 | 98 |
| 10 | 20 | 50 | 97 |
| 11 | 20 | 50 | 98 |
| 12 | 30 | 40 | 49 |
| 13 | 10 | 40 | 39 |
| 14 | 20 | 50 | 96 |
| Regression coefficients | PR conversion, % | p-Value of αi and αii |
|---|---|---|
| α0 | 97 | |
| α3 | 7 | 0.021 |
| α4 | 9 | 0.006 |
| α33 | −23 | <0.001 |
| α44 | −25 | <0.001 |
| R2 | 0.957 |
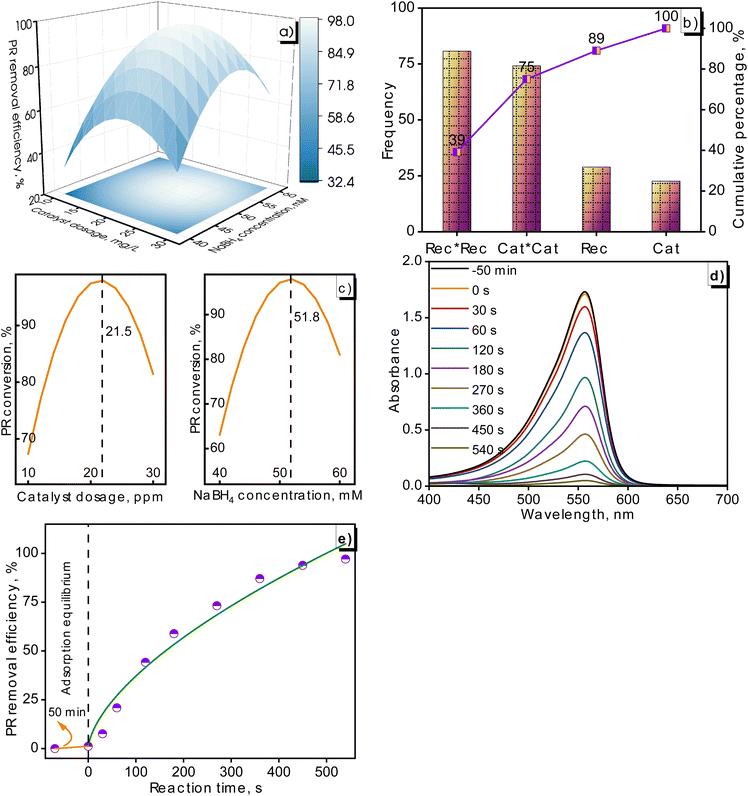
The influence of NaBH4 concentrations on the catalytic degradation of PR was investigated in Fig. 13a. It was noted that the PR removal improved as the NaBH4 dosage increased from 40 to 50 mM. An additional increase in NaBH4 amounts from 50 to 60 mM reduced the PR conversion. A competitive adsorption between dyes clarified this tendency, BH4− ions, and surface hydrogens on the catalyst surface. Surface hydrogens were formed from NaBH4 and also absorbed on the catalyst surface to react with dyes. With the increase in NaBH4 dosages, more surface hydrogen was generated and adsorbed onto the catalyst surface, leading to a lowering in the adsorption capacity of species and saturation of active sites. This was identified as a key factor leading to the reduction in dye degradation when the NaBH4 concentration was further increased.59,60 This variation was also found in previous studies about the effect of NaBH4 concentration on dye elimination. For example, ZnS nanomaterials tested with 0.01 mol NaBH4 exhibited the highest rhodamine B conversion of 94% followed by 0.005 mol NaBH4 reaching 86%, and 0.03 mol NaBH4 achieving 80%. The rhodamine B removal of a sample prepared with 0.02 mol NaBH4 descended dramatically at a value of 53%.61 Another study conducted on Ag/Ni bimetallic catalysts for the dye conversion including methyl orange, congo red, and eriochrome black T also found an identical trend. When the NaBH4 concentration exceeded the optimal value, the occupation of active sites began, and there was a decrease in adsorption capacity on the catalytic surface.62
The effect of the catalyst dosage on the PR degradation was summarized in Table 6 and Fig. 13a. It can be observed that the degradation efficiency of PR increased with the boost of the nanocatalyst dosage from 10 to 20 ppm. This was explained by increasing the high surface area, leading to an enhancement in PR removal. Conversely, there was a decline in PR removal with a further increase in the Cat-Cu NPs (MG) dosage at 30 ppm, which was caused by the turbidity of the suspension and the accumulation of intermediate substances in the pore/on the surface of the photocatalyst.63–65 PR conversion varied in an approximate range of 39–53–50% with 10 ppm Cat-Cu NPs (MG), 53–98–88% with 20 ppm Cat-Cu NPs (MG), and 50–88–58% with 30 ppm Cat-Cu NPs (MG) corresponding to NaBH4 concentration of 30–40–60 mM.
Fig. 13b was presented as a Pareto chart, illustrating the frequency distribution of four categories: Rec*Rec, Cat*Cat, Rec, and Cat. The bar graph indicated that the Rec*Rec and Cat*Cat terms had the highest frequencies, each at approximately 75. These terms characterized a significant portion of the total frequency, as shown by the cumulative percentage line, accounting for 75% of the total frequency. Moving to the Rec category, there was a noticeable drop in frequency compared to the first two categories. This category still contributed to the overall distribution with a smaller portion, bringing the cumulative percentage to 89%. The smallest contribution occurred from the Cat category with a further increase in the cumulative percentage to 100%.
The optimal values of the operated parameters were determined by the optimized response. From the calculated results in Fig. 13c, nanocatalyst dosages of 21.5 ppm and 51.8 mM NaBH4 were considered optimum values for PR removal. The PR removal of the fabricated Cat-Cu NPs (MG) has been tested at optimal conditions. The results in absorbance of PR and PR conversion at various reaction times were illustrated in Fig. 13d and e. The presence of PR was confirmed at 560 nm on the UV-Vis spectra. It was observed that the absorbance of the PR solution diminished gradually prolonging reaction time. The equilibrium between PR and active sites of the nanocatalyst occurred after 50 min. The process was evaluated on 10 ppm PR solution by introducing 21.5 ppm Cat-Cu NPs (MG) and 51.8 mM NaBH4. The reaction mixture was stirred magnetically thoroughly at continuous times. The removal process of PR dye using the green-synthesized Cat-Cu NPs (MG) was significantly high, reaching 97% for a 540 seconds reaction.
A comprehensive analysis was conducted to compare our findings with recent research, as presented in Table 8. Previous studies encountered several challenges, including inadequate exploration of operating parameters for the synthesis process and unoptimized functional factors for dye removal. In certain studies, the fusion of biogenic synthesis and modern processing, particularly sonication, has led to the presence of unidentified phases caused by the high amorphous state and bio-capping of nanoparticles. The significant potential of M. glabra plant extract as a reductant has been underexplored in studies on metallic nanoparticles. In contrast, the synthesis of Cu NPs (MG) harnessed eco-friendly agents by combining the reductant from M. glabra fruit extract with the capping capabilities of starch, further enhanced through sonication treatment. This process achieved exceptional synthesis efficiency without impurities in phase analysis by meticulously optimizing synthesis parameters. As a result, it demonstrated remarkable efficacy in harnessing the potential of Cu NPs (MG), making them highly effective against Gram-positive bacteria (S. aureus and B. subtilis) and cancer cells (MCF7, A549, KB, and HepG2), particularly in combating two prevalent fungal strains: F. solani and R. solani. Also, Cu NPs (MG) exhibited an effective catalyst for PR elimination. These findings underscore the pivotal role of the involved substances in enhancing overall performance, offering promising applications in biomedicine, agriculture, and the environment.
| Stabilizer, reductant | Treatment | Phase | Shape, size | Applications | References | |
|---|---|---|---|---|---|---|
| Cu NPs-a | Hydrazine, starch | Conventional heating | Cu | Spherical, 20 nm | — | 14 |
| Cu NPs-b | Ascorbic acid, starch | Conventional heating | Cu, Cu2O | Cubic, 29 nm | — | 12 |
| Cu NPs-c | Hydrazine, starch | Conventional heating | Cu | Spherical, 50–70 nm | — | 13 |
| Cu NPs-d | Syzygium aromaticum bud extract | Conventional heating | Cu | Spherical, 20 nm | Antibacteria, antifungi | 66 |
| Cu NPs-e | Ananas comosus peel extract, polyethylene glycol | Conventional heating | Cu | Spherical, 53 nm | — | 67 |
| Cu NPs-f | Fraxinus excelsior methanolic extract | Sonication | Unidentified | Spherical, 10 nm | — | 68 |
| Cu NPs (MG) | M. glabra fruit extract, starch | Sonication | Cu | Spherical, 23 nm | Antibacterial, anticancer cells, antifungal, dye removal | This work |
4. Conclusions
In this work, the utilization of M. glabra fruit extract, in conjunction with starch as a stabilizer and sonication treatment, has been vital for the successful synthesis of Cu NPs (MG). This synthesis demonstrated significant biological efficacy against a variety of microorganisms and effective removal of PR. The FTIR analysis has highlighted the substantial contribution of ascorbic acid, a key component within the M. glabra fruit extract, and the stabilizer starch to this synthesis process. Additionally, TEM images have clearly shown the effective system stabilization achieved through the combined action of starch and M. glabra fruit extract, enhanced by sonication treatment, resulting in uniformly sized particles with an average diameter of 22.5 nm. Leveraging these exceptional attributes, Cu NPs (MG) has exhibited a unique ability to inhibit cancer cells (A549, HepG2, KB, and MCF7) and Gram-positive bacteria (B. subtilis and S. aureus). Cu NPs (MG) nanomaterial has also displayed significant antifungal activity against two challenging fungal strains (F. solani and R. solani) with IC50 values of 80 and 111 ppm, respectively. Remarkably, Cat-Cu NPs (MG) was considered an effective PR elimination catalyst, reaching 97% after a 540 seconds reaction. This study underscores the promising properties of Cu NPs (MG) synthesized with the assistance of M. glabra fruit extract, paving the way for potential applications in eco-friendly nanotechnology, biomedicine, and environment.Data availability
Data for this article, including figures and tables are available at RA-ART-08-2024-006087.R1 at https://doi.org/10.5281/zenodo.13961797.Author contributions
Trung Dien Nguyen: investigation, data curation, software, formal analysis, writing review, editing. Yen Hai Hoang: conceptualization, methodology, investigation, writing – original draft. Nhung Thi-Tuyet Thai: data curation, investigation, methodology. Gia Thi-Ngoc Trinh: supervision, writing review, editing.Conflicts of interest
The authors have no competing interests to declare that are relevant to the content of this article.Acknowledgements
This study is funded in part by the Can Tho University, Code: T2023-74.References
- M. F. Al-Hakkani, SN Appl. Sci., 2020, 2, 505 CrossRef CAS.
- M. E. S. Anu and M. P. Saravanakumar, IOP Conf. Ser.: Mater. Sci. Eng., 2017, 263, 032019 Search PubMed.
- M. I. Din and R. Rehan, Anal. Lett., 2016, 50, 50–62 CrossRef.
- A. Q. Malik, T. u. G. Mir, D. Kumar, I. A. Mir, A. Rashid, M. Ayoub and S. Shukla, Environ. Sci. Pollut. Res., 2023, 30, 69796–69823 CrossRef CAS.
- S. Jadoun, R. Arif, N. K. Jangid and R. K. Meena, Environ. Chem. Lett., 2021, 19, 355–374 CrossRef CAS.
- S. Nunes Rda, V. F. Kahl, S. Sarmento Mda, M. F. Richter, J. A. Abin-Carriquiry, M. M. Martinez, B. Ferraz Ade and J. Da Silva, Phytother. Res., 2013, 27, 1495–1501 CrossRef PubMed.
- E. M. M. Nascimento, F. F. G. Rodrigues, W. D. Costa, R. N. P. Teixeira, A. A. Boligon, E. O. Sousa, F. F. G. Rodrigues, H. D. M. Coutinho and J. G. M. da Costa, Food Chem. Toxicol., 2018, 119, 457–463 CrossRef CAS PubMed.
- E. Beltrán-Partida, B. Valdez-Salas, E. Valdez-Salas, G. Pérez-Cortéz and N. Nedev, J. Nanomater., 2019, 2019, 5287632 Search PubMed.
- T. Jiang, Q. Duan, J. Zhu, H. Liu and L. Yu, Adv. Ind. Eng. Polym. Res., 2020, 3, 8–18 Search PubMed.
- P. Cheviron, F. Gouanve and E. Espuche, Carbohydr. Polym., 2014, 108, 291–298 CrossRef CAS.
- S. M. Yakout and A. A. Mostafa, Int. J. Clin. Exp. Med., 2015, 8, 3538–3544 Search PubMed.
- A. Khan, A. Rashid, R. Younas and R. Chong, Int. Nano Lett., 2015, 6, 21–26 CrossRef.
- A. Olad, M. Alipour and R. Nosrati, Bull. Mater. Sci., 2017, 40, 1013–1020 CrossRef CAS.
- Y. Suresh, S. Annapurna, G. Bhikshamaiah and A. K. Singh, International Conference on Advanced Nanomaterials & Emerging Engineering Technologies, 2013, vol. 2013, pp. 63–67 Search PubMed.
- N. Jayarambabu, A. Akshaykranth, T. Venkatappa Rao, K. Venkateswara Rao and R. Rakesh Kumar, Mater. Lett., 2020, 259, 126813 CrossRef CAS.
- M. I. M. Ismail, Mater. Chem. Phys., 2020, 240, 122283 CrossRef CAS.
- B. Ashok, N. Hariram, S. Siengchin and A. V. Rajulu, J. Bioresour. Bioprod., 2020, 5, 180–185 CrossRef CAS.
- S. Lee, H. Jeong, Y. Noh, S. K. Hyun, D. Lee and C. Jin, Surf. Interface Anal., 2017, 49, 405–409 CrossRef CAS.
- A. Afzal, I. Nawfal, I. M. Mahbubul and S. S. Kumbar, J. Therm. Anal. Calorim., 2018, 135, 393–418 CrossRef.
- A. Nouri, M. Tavakkoli Yaraki, A. Lajevardi, Z. Rezaei, M. Ghorbanpour and M. Tanzifi, Colloids Interface Sci. Commun., 2020, 35, 100252 CrossRef CAS.
- M. C. Crisan, M. Teodora and M. Lucian, Appl. Sci., 2021, 12, 141 CrossRef.
- R. C. Kasana, N. R. Panwar, R. K. Kaul and P. Kumar, Environ. Chem. Lett., 2017, 15, 233–240 CrossRef CAS.
- G. Naikoo, F. Al-Mashali, F. Arshad, N. Al-Maashani, I. U. Hassan, Z. Al-Baraami, L. H. Faruck, A. Qurashi, W. Ahmed, A. M. Asiri, A. A. Aljabali, H. A. Bakshi and M. M. Tambuwala, Curr. Pharm. Des., 2021, 27, 4416–4432 CrossRef CAS PubMed.
- A. Sisic, J. Bacanovic-Sisic, A. M. S. Al-Hatmi, P. Karlovsky, S. A. Ahmed, W. Maier, G. S. de Hoog and M. R. Finckh, Sci. Rep., 2018, 8, 1252 CrossRef PubMed.
- N. Pariona, A. I. Mtz-Enriquez, D. Sanchez-Rangel, G. Carrion, F. Paraguay-Delgado and G. Rosas-Saito, RSC Adv., 2019, 9, 18835–18843 RSC.
- H. Mahawar, R. Prasanna and R. Gogoi, Plant Physiol. Rep., 2019, 24, 533–540 CrossRef CAS.
- G. L. Vanti, S. Masaphy, M. Kurjogi, S. Chakrasali and V. B. Nargund, Int. J. Biol. Macromol., 2020, 156, 1387–1395 CrossRef CAS.
- R. M. Kiriyanthan, S. A. Sharmili, R. Balaji, S. Jayashree, S. Mahboob, K. A. Al-Ghanim, F. Al-Misned, Z. Ahmed, M. Govindarajan and B. Vaseeharan, Photodiagn. Photodyn. Ther., 2020, 32, 102058 CrossRef CAS PubMed.
- S. Raina, A. Roy and N. Bharadvaja, Environ. Nanotechnol., Monit. Manage., 2020, 13, 100278 Search PubMed.
- S. Y. Sharaf Zeebaree, A. Y. Sharaf Zeebaree, O. I. Haji Zebari and A. Y. Sharaf Zebari, Curr. Res. Green Sustainable Chem., 2021, 4, 100103 CrossRef CAS.
- M. F. El-Berry, S. A. Sadeek, A. M. Abdalla and M. Y. Nassar, Mater. Res. Bull., 2021, 133, 111048 CrossRef CAS.
- N. Nagar and V. Devra, Mater. Chem. Phys., 2018, 213, 44–51 CrossRef CAS.
- A. Salim, R. Vishnoi, H. Dixit, V. Chaudhary, J. Bhardwaj, D. Gupta, S. Aggarwal, U. K. Dwivedi, P. Kumar, S. Bishnoi, G. D. Sharma and R. Singhal, J. Mater. Sci.: Mater. Electron., 2022, 33, 15533–15545 CrossRef CAS.
- N. Al-Dayan, Pak. J. Biol. Sci., 2021, 24, 1034–1039 CrossRef CAS.
- S. A. Al-Thabaiti, A. Y. Obaid, Z. Khan, O. Bashir and S. Hussain, Colloid Polym. Sci., 2015, 293, 2543–2554 CrossRef CAS.
- J. Suárez-Cerda, H. Espinoza-Gómez, G. Alonso-Núñez, I. A. Rivero, Y. Gochi-Ponce and L. Z. Flores-López, J. Saudi Chem. Soc., 2017, 21, 341–348 CrossRef.
- M. I. Din, F. Arshad, Z. Hussain and M. Mukhtar, Nanoscale Res. Lett., 2017, 12, 638 CrossRef.
- M. K. Ghosh, S. Sahu, I. Gupta and T. K. Ghorai, RSC Adv., 2020, 10, 22027–22035 RSC.
- B. O. Sadia, J. K. Cherutoi and C. M. Achisa, J. Nanotechnol., 2021, 2021, 5611434 Search PubMed.
- I. Yaremchuk, Š. Meškinis, T. Bulavinets, A. Vasiliauskas, M. Andrulevičius, V. Fitio, Y. Bobitski and S. Tamulevičius, Diam. Relat. Mater., 2019, 99, 107538 CrossRef CAS.
- G. Habibullah, J. Viktorova, P. Ulbrich and T. Ruml, RSC Adv., 2022, 12, 30386–30403 RSC.
- V. N. Popok, S. M. Novikov, Y. Y. Lebedinskij, A. M. Markeev, A. A. Andreev, I. N. Trunkin, A. V. Arsenin and V. S. Volkov, Plasmonics, 2021, 16, 333–340 CrossRef CAS.
- M. G. Lomelí-Ramírez, A. J. Barrios-Guzmán, S. García-Enriquez, J. D. J. Rivera-Prado and R. Manríquez-González, Bioresources, 2014, 9, 2960–2974 CrossRef.
- A. Umer, S. Naveed, N. Ramzan, M. S. Rafique and M. Imran, Matéria, 2014, 19, 197–203 Search PubMed.
- J. Xiong, Y. Wang, Q. Xue and X. Wu, Green Chem., 2011, 13, 900 RSC.
- S. Ilbasmis-Tamer, E. S. Saral-Acarca, S. Tort, Ç. Yücel, U. Tamer and F. Acartürk, J. Drug Delivery Sci. Technol., 2022, 72, 103401 CrossRef CAS.
- A. Sankhla, R. Sharma, R. S. Yadav, D. Kashyap, S. L. Kothari and S. Kachhwaha, Mater. Chem. Phys., 2016, 170, 44–51 CrossRef CAS.
- F. G. Torres and G. E. De-la-Torre, Int. J. Biol. Macromol., 2022, 194, 289–305 CrossRef CAS.
- V. D. Cao, P. P. Nguyen, V. Q. Khuong, C. K. Nguyen, X. C. Nguyen, C. H. Dang and N. Q. Tran, Bull. Korean Chem. Soc., 2014, 35, 2645–2648 CrossRef.
- A. P. Ingle, N. Duran and M. Rai, Appl. Microbiol. Biotechnol., 2014, 98, 1001–1009 CrossRef CAS.
- P. Sharma, S. Pant, V. Dave, K. Tak, V. Sadhu and K. R. Reddy, J. Microbiol. Methods, 2019, 160, 107–116 CrossRef CAS PubMed.
- K. Zitnick-Anderson, A. Oladzadabbasabadi, S. Jain, C. Modderman, J. M. Osorno, P. E. McClean and J. S. Pasche, Front. Genet., 2020, 11, 475 CrossRef CAS.
- C. Zhang, S. Yu, H. Tian, Z. Wang, B. Yu, L. Ma, Z. Nan and X. Fang, Eur. J. Plant Pathol., 2021, 160, 983–989 CrossRef CAS.
- V. W. Xu, M. Z. Nizami, I. X. Yin, O. Y. Yu, C. Y. Lung and C. H. Chu, Nanomaterials, 2022, 12, 805 CrossRef CAS PubMed.
- X. Ma, S. Zhou, X. Xu and Q. Du, Front. Surg., 2022, 9, 905892 CrossRef PubMed.
- R. Vijayan, S. Joseph and B. Mathew, IET Nanobiotechnol., 2018, 12, 850–856 CrossRef PubMed.
- S. A. Moon, B. K. Salunke, P. Saha, A. R. Deshmukh and B. S. Kim, Korean J. Chem. Eng., 2018, 35, 702–708 CrossRef CAS.
- D. Gola, A. kriti, N. Bhatt, M. Bajpai, A. Singh, A. Arya, N. Chauhan, S. K. Srivastava, P. K. Tyagi and Y. Agrawal, Curr. Res. Green Sustainable Chem., 2021, 4, 100132 CrossRef CAS.
- S. H. Ammar, H. J. Khadim and A. Al-Farraji, Nanotechnol. Environ. Eng., 2020, 5, 16 CrossRef CAS.
- Z. H. Farooqi, K. Naseem, R. Begum and A. Ijaz, J. Inorg. Organomet. Polym. Mater., 2015, 25, 1554–1568 CrossRef CAS.
- T. Amakali, A. Živković, M. E. A. Warwick, D. R. Jones, C. W. Dunnill, L. S. Daniel, V. Uahengo, C. E. Mitchell, N. Y. Dzade and N. H. de Leeuw, Front. Chem., 2022, 10, 835832 CrossRef CAS.
- M. Arif, RSC Adv., 2023, 13, 3008–3019 RSC.
- N. P. de Moraes, F. N. Silva, M. L. C. P. da Silva, T. M. B. Campos, G. P. Thim and L. A. Rodrigues, Mater. Chem. Phys., 2018, 214, 95–106 CrossRef.
- A. Aziz, N. Ali, A. Khan, M. Bilal, S. Malik, N. Ali and H. Khan, Int. J. Biol. Macromol., 2020, 153, 502–512 CrossRef CAS.
- P. Gnanamozhi, V. Renganathan, S.-M. Chen, V. Pandiyan, M. Antony Arockiaraj, N. S. Alharbi, S. Kadaikunnan, J. M. Khaled and K. F. Alanzi, Ceram. Int., 2020, 46, 18322–18330 CrossRef CAS.
- K. M. Rajesh, B. Ajitha, Y. A. K. Reddy, Y. Suneetha and P. S. Reddy, Optik, 2018, 154, 593–600 CrossRef CAS.
- B. M. H. Ali, Biochem. Cell. Arch., 2020, 20, 5965–5971 Search PubMed.
- F. Hadinejad, M. Jahanshahi and H. Morad, Nano Biomed. Eng., 2020, 13, 6–19 Search PubMed.
| This journal is © The Royal Society of Chemistry 2024 |

