 Open Access Article
Novel PPAR-γ agonists as potential neuroprotective agents against Alzheimer's disease: rational design, synthesis, in silico evaluation, PPAR-γ binding assay and transactivation and expression studies†
Priya D.a,
Umme Hanib,
Nazima Haiderc,
Sirajunisa Talathd,
Dhivya Shanmugarajana,
Prabitha P.a,
Archana P. a and
B. R. Prashantha Kumar
 *a
*a
aDepartment of Pharmaceutical Chemistry, JSS College of Pharmacy, JSS Academy of Higher Education and Research, Sri Shivarathreeshwara Nagara, Mysuru 570015, India. E-mail: brprashanthkumar@jssuni.edu.in; Fax: +91-821-2548359; Tel: +91-821-2548353
bDepartment of Pharmaceutics, College of Pharmacy, King Khalid University, Abha 62529, Saudi Arabia
cDepartment of Pathology, College of Medicine, King Khalid University, Abha 62529, Saudi Arabia
dDepartment of Pharmaceutical Chemistry, RAK College of Pharmacy, RAK Medical and Health Sciences University, Ras Al Khaimah 11172, United Arab Emirates
First published on 21st October 2024
Abstract
Alzheimer's disease (AD) is a neurological disorder. It is caused by accumulation of amyloid beta (Aβ) plaques and tau tangles, which gradually leads to cognitive decline and memory loss. Peroxisome proliferator-activated receptor gamma (PPAR-γ), a nuclear receptor, plays a significant role in regulating genes responsible for metabolism and inflammation. Studies have shown that PPAR-γ activation has neuroprotective effects, can potentially reduce inflammation and oxidative stress, and stimulates mitochondrial biogenesis. Current study presents the design, synthesis and in vitro evaluation of PPAR-γ agonists for AD that are tailored to optimize binding with the PPAR-γ receptor. The compounds 4a, 4h and 4j exhibited notable binding affinities towards PPAR-γ LBD, with IC50 values of 8.607, 9.242, and 5.974 μM, respectively, in TR-FRET binding assay. These compounds were cell proliferative and non-cytotoxic in a neuroblastoma cell line (SH-SY5Y). They also demonstrated dose-dependent PPAR-γ activation in transactivation assay. Their neuroprotective effect was studied based on their anti-inflammatory and anti-oxidant potential by reducing the levels of proinflammatory markers (TNF-α, IL-6 and IL-1β) and ROS in Aβ-induced SH-SY5Y neuroblastoma cells using a flow cytometry method. The synthesized compounds also showed interactions in molecular docking study with the PPAR-γ receptor and demonstrated good stability in MD simulation. Our results highlight that through activation of PPAR-γ, the compounds 4a, 4h and 4j offer neuroprotective effects by reducing neuroinflammation and oxidative stress, and hence, they may be considered lead molecules for treating AD.
1. Introduction
AD is a progressive neurodegenerative disorder that largely affects cerebral functions, particularly, memory, thinking and behavior.1 Neuroinflammation is an inflammation in the brain that contributes to the damage to nerve cells in AD. This inflammation may be triggered by abnormal proteins and immune responses,2 and it is characterized by a rapid activation of microglia, leading to the production of pro-inflammatory cytokines, oxidative radicals, and the infiltration of peripheral immune cells into brain tissue, ultimately contributing to neurodegeneration.3 Aspects such as genetics, chronic diseases and a compromised blood–brain barrier worsen this inflammation. Neuroinflammation accelerates the progression of AD by harming brain cells and promoting the formation of harmful plaques and tangles.4 In AD, oxidative stress is linked to Aβ plaque formation, AD pathophysiological events and synaptic dysfunction. Elevated ROS generation and downregulation of antioxidant defence mechanisms may lead to oxidative stress-mediated neurodegeneration.5 Targeting inflammation and oxidative stress through therapeutic interventions may hold promise for the treatment or prevention of AD, although more research is needed to understand the underlying mechanisms and develop effective therapies fully.PPAR-γ plays a critical role in regulating genes responsible for numerous physiological processes, such as fat cell differentiation, glucose homeostasis, lipid metabolism, and ligand-dependent signal transduction.6 PPAR-γ activation is associated with anti-inflammatory, anti-oxidant and neuroprotective effects. It improves cognitive function, reduces the accumulation of Aβ plaques and inhibits the production of inflammatory cytokines, such as interleukin-6 (IL-6) and TNF-alpha (TNF-α), which are elevated in AD that contribute to neuroinflammation.7 Aβ accumulation in the brain activates an immune cell called microglia. PPAR-γ agonists can inhibit the activation of microglia that are induced by Aβ, thereby reducing neuroinflammation.8 They also modulate the processing of amyloid precursor protein (APP), the precursor of Aβ, and alter the activity of enzymes involved in Aβ synthesis.9 PPARs have been implicated in various neuroprotective mechanisms, including the activation of genes responsible for defending against oxidative stress, promoting anti-inflammatory responses, and stimulating mitochondrial biogenesis.10,11
PPAR-γ activation has advanced as a potential therapeutic avenue in the realm of chronic neurological diseases, such as Alzheimer's disease (AD), multiple sclerosis (MS), amyotrophic lateral sclerosis (ALS), and Parkinson's disease (PD). This is achieved through the modulation of multiple signaling pathways associated with detrimental events in these conditions.12 Natural compounds that can activate PPAR-γ include eicosanoids, natural lipid ligands, long-chain fatty acids, nitroalkenes, and prostaglandins.13 However, synthetic ligands called glitazones have gathered significant attention also due to their ability to activate PPAR-γ.14 Glitazones possess three essential structural features in their binding portion: an acidic head, an aromatic trunk with two carbon linkers, and a lipophilic tail. The ligand binding domain (LBD) of PPAR-γ, which refers to the region of the receptor where ligands attach, is larger than that of most receptors and features a Y-shaped binding pocket that can accommodate diverse ligand structures.15 When an agonist binds to PPARs, these receptors pair up with RXR receptors to form heterodimers. These PPAR–RXR heterodimers then interact with specific proteins called PPAR-cofactors, such as PGC-1α, to regulate gene expression.16,17 When PGC-1α is activated by PPAR-γ agonist binding, it enhances gene expression related to energy metabolism, mitochondrial biogenesis, and oxidative stress defense.18,19 This leads to improved energy production, reduced oxidative damage, increased fatty acid oxidation, and anti-inflammatory effects. Overall, PGC-1α activation supports better metabolic health and cellular function. The development of synthetic ligands has allowed researchers to mimic the binding of ligands endogenously to activate PPAR-γ more effectively. Conditions such as AD, PD, ALS, MS, Huntington's disease, and stroke have all exhibited benefits from PPAR-γ ligand-induced receptor activation.20
Therefore, after complete analysis of the structural features of available PPAR-γ agonists, novel PPAR-γ agonists were designed, synthesized, analyzed, and utilized in further in vitro studies. A TR-FRET binding assay was used to confirm the binding affinity of the synthesized compounds to PPAR-γ.21 Subsequent assessments were carried out to evaluate the in vitro cytotoxicity of these compounds. The results suggest that the development of novel PPAR-γ agonists with enhanced binding affinity and a predicted lower toxic profile holds promise for future therapeutic applications in AD. Notably, our studies demonstrated that novel PPAR-γ agonists have the potential to mitigate the production of pro-inflammatory cytokines, including TNF-α, IL-6, and IL-1β, and also reduce oxidative stress in Aβ-induced SH-SY5Y neuroblastoma cell lines. This study delved into the potential binding interactions of these compounds with PPAR-γ using molecular docking and dynamics studies. Therefore, it becomes evident that the activation of PPAR-γ receptors holds promise in regulating neuroinflammation and alleviating oxidative stress in the context of neurodegenerative diseases. In light of this, we undertook the design and synthesis of novel PPAR-γ agonists to explore their neuroprotective properties.
2. Results and discussion
2.1. Design rationale
Glitazones are primarily used to manage type 2 diabetes due to their ability to improve insulin sensitivity, but some studies have also suggested glitazones may have potential benefits in AD.22 In the context of such research efforts, PPAR-γ agonists are known as glitazones that contain thiazolidinedione (TZD), a heterocyclic ring in the head region that is responsible for the activation of PPAR-γ receptor activation.23 Our recent study aimed to design novel PPAR-γ agonists by replacing the TZD ring structure with a hydroxyl amine in the head region for PPAR-γ activation. With the understanding of the structural features of available glitazones, such as acidic head, aromatic trunk with two carbon linkers, and lipophilic tail, a newer focused library of molecules was designed (Fig. 1). Our study's approach of replacing the TZD ring with a hydroxyl amine in the head region for PPAR-γ activation is based on the concept of bioisosterism.24 Bioisosteres are functional groups with a similar size, shape, and electron distribution, leading to comparable biological properties. In this case, the hydroxyl amine group might mimic the hydrogen-bonding interactions and polarity of the TZD ring, potentially maintaining PPAR-γ agonistic activity. A study by Saha et al.25 supported this concept. They explored replacing the TZD ring in known drugs like rosiglitazone and pioglitazone with a pyrrolidinedione ring. Their findings showed that these analogs retained some PPAR-γ activity while exhibiting reduced toxicity compared to the parent TZD drugs. This highlights the potential for altering the heterocyclic ring structure while maintaining PPAR-γ agonism.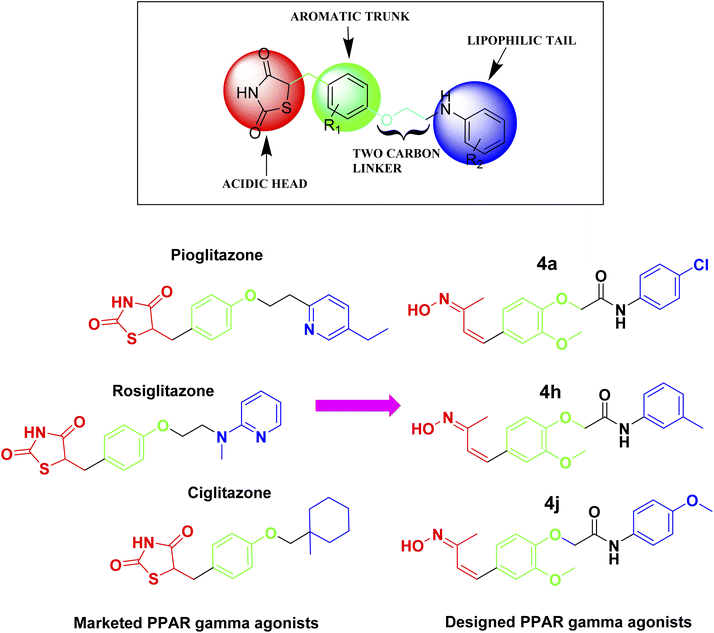 | ||
| Fig. 1 Design strategy for the novel PPAR-γ agonists based on the structural features of available glitazones (PPAR-γ agonists). | ||
While specific examples of hydroxylamine-containing compounds with PPAR-γ activity are limited, the concept of using bioisosteric replacements is well-documented in medicinal chemistry. However, the replacement of TZD with a hydroxyl amine is a relatively unexplored bioisosteric approach. While there might not be documented examples yet, the rationale based on bioisosterism and the potential for hydrogen-bonding interactions justifies further investigation. Both functional groups can form hydrogen bonds, potentially interacting with similar binding sites on PPAR-γ. Our innovative structural features-guided design and synthesis of novel PPAR-γ agonists may offer a new perspective for this class of agonists for AD. The below graphical demonstration compares the structural and functional attributes of the TZD ring (Original) and hydroxylamine moiety (Replacement), highlighting their respective roles in molecular interactions.
• TZD ring (Original):
(1) Hydrogen bond donors and acceptors.
(2) Electrostatic interactions.
(3) Planar structure facilitating binding.
• Hydroxylamine moiety (Replacement):
(1) Hydrogen bond donors and acceptors.
(2) Similar electronic properties.
(3) Potential to mimic planar interactions.
2.2. ADMET, TOPKAT, and drug likeness
Many drugs are out of the market due to their pharmacokinetics and dynamic properties, so this is a critical parameter that needs to be assessed at the beginning of the drug discovery cycle as a cost-effective and time-saving process.26 By employing the small molecule tools in Discovery studio, the absorption–distribution–metabolism–excretion–toxicity (ADMET) scores and toxicity profiles27 of compounds were calculated and are presented in Table 1. The compounds possessed good (level = 0) human intestinal absorption with good solubility (level = 3),28,29 except for compound 4g, which showed optimal solubility (level = 4). All the compounds were non-inhibitors of the metabolizing enzyme CYP450 activity30,31 and possessed a low (level = 3) to moderate (level = 2) ability to cross the blood–brain barrier (BBB). Furthermore, all the compounds obeyed Lipinski's rule of 5, which is a key descriptor for oral bioavailability, and potentially all the compounds were free from mutagenicity and carcinogenicity according to the rat oral LD50, inhalation LC50, and carcinogenic potency TD50 (ref. 32) indicators, as shown in Table 2.| Compd code | Solubility | BBB | HIA | CPY2D6 | NTP_RAT | Ames mutagen | |
|---|---|---|---|---|---|---|---|
| Male | Female | ||||||
| a BBB: blood–brain barrier, HIA: human intestinal absorption, CYP2D6: cytochrome P450 2D6 (CYP2D6), NTP: national toxicology program. | |||||||
| 4a | 3 | 2 | 0 | NI | NC | NC | NM |
| 4b | 3 | 2 | 0 | NI | NC | NC | NM |
| 4c | 3 | 3 | 0 | NI | NC | NC | NM |
| 4d | 3 | 2 | 0 | NI | NC | NC | NM |
| 4e | 3 | 2 | 0 | NI | NC | NC | NM |
| 4f | 3 | 2 | 0 | NI | NC | NC | NM |
| 4g | 4 | 3 | 0 | NI | NC | NC | NM |
| 4h | 3 | 2 | 0 | NI | NC | NC | NM |
| 4i | 3 | 2 | 0 | NI | NC | NC | NM |
| 4j | 3 | 3 | 0 | NI | NC | NC | NM |
| Compound code | A![[thin space (1/6-em)]](https://www.rsc.org/images/entities/char_2009.gif) log log![[thin space (1/6-em)]](https://www.rsc.org/images/entities/char_2009.gif) p p |
MW | HBA | HBD | Rat oral LD50 g per kg_body_weight | Rat inhalational LC50 mg m−3 h−1 | Carcinogenic potency TD50_Rat mg per kg_body_weight per day |
|---|---|---|---|---|---|---|---|
| a MW: molecular weight, HBA/D: hydrogen bond acceptor/donor. | |||||||
| 4a | 3.363 | 374.82 | 6 | 2 | 2.55922 | 1361.53 | 17.3925 |
| 4b | 3.185 | 354.41 | 6 | 2 | 0.92198 | 2000.58 | 544.362 |
| 4c | 2.699 | 340.38 | 6 | 2 | 2.40968 | 1869.87 | 62.4133 |
| 4d | 3.363 | 374.81 | 6 | 2 | 2.07843 | 1381.73 | 43.2746 |
| 4e | 3.185 | 354.41 | 6 | 2 | 3.912 | 2107.68 | 114.23 |
| 4f | 2.926 | 328.33 | 5 | 2 | 0.64346 | 2117.29 | 55.0068 |
| 4g | 1.249 | 331.40 | 6 | 2 | 0.45388 | 867.721 | 150.922 |
| 4h | 3.185 | 354.41 | 6 | 2 | 2.74511 | 2000.58 | 1.22823 |
| 4i | 2.715 | 310.34 | 5 | 2 | 1.22902 | 1272.58 | 145.198 |
| 4j | 2.682 | 370.39 | 7 | 2 | 4.63321 | 1289.51 | 1873.07 |
Replacing the TZD ring with a hydroxyimine group in PPAR-γ agonists could improve their ADME properties, reduce toxicity, and enhance BBB penetration. Hydroxyimines can modulate lipophilicity for better absorption, improve metabolic stability, and decrease hepatotoxicity. They also have the potential to cross the BBB due to their favorable hydrophilic–lipophilic balance and molecular flexibility. Although specific examples of hydroxyimine-containing PPAR-γ agonists are limited, the principles of bioisosterism33 and the existing literature on hydroxylamine derivatives support their potential. However, further empirical studies are needed to validate these theoretical benefits. There are reported studies that compounds containing hydroxyl amine moieties are able to cross the BBB.34 The designed ligands were studied for their favorable ADME properties, drug likeness, and toxicity, with a special focus on their ability to cross the BBB. The ability of a compound to penetrate the BBB can often be estimated by its log![[thin space (1/6-em)]](https://www.rsc.org/images/entities/char_2009.gif) P value, which represents the compound's lipophilicity. A
P value, which represents the compound's lipophilicity. A![[thin space (1/6-em)]](https://www.rsc.org/images/entities/char_2009.gif) log
log![[thin space (1/6-em)]](https://www.rsc.org/images/entities/char_2009.gif) P is useful for an initial assessment, and is one of Lipinski's rules to predict the logarithm of the partition coefficient (P) of a compound between octanol and water phases. It measures how well a compound can dissolve in lipids (octanol) versus water. To estimate the ability to cross the BBB, Egan and Lauri's method was employed based on the log
P is useful for an initial assessment, and is one of Lipinski's rules to predict the logarithm of the partition coefficient (P) of a compound between octanol and water phases. It measures how well a compound can dissolve in lipids (octanol) versus water. To estimate the ability to cross the BBB, Egan and Lauri's method was employed based on the log![[thin space (1/6-em)]](https://www.rsc.org/images/entities/char_2009.gif) P values, whereby:
P values, whereby:
1 Low log![[thin space (1/6-em)]](https://www.rsc.org/images/entities/char_2009.gif) P (typically less than 2): compounds with very low log
P (typically less than 2): compounds with very low log![[thin space (1/6-em)]](https://www.rsc.org/images/entities/char_2009.gif) P values are usually too hydrophilic to efficiently cross the lipid-rich environment of the BBB.
P values are usually too hydrophilic to efficiently cross the lipid-rich environment of the BBB.
2 Moderate log![[thin space (1/6-em)]](https://www.rsc.org/images/entities/char_2009.gif) P (between 2 and 5): compounds with moderate log
P (between 2 and 5): compounds with moderate log![[thin space (1/6-em)]](https://www.rsc.org/images/entities/char_2009.gif) P values are often well-suited for BBB penetration. This range is considered optimal as it balances the hydrophilic and lipophilic properties necessary for crossing the BBB.
P values are often well-suited for BBB penetration. This range is considered optimal as it balances the hydrophilic and lipophilic properties necessary for crossing the BBB.
3 High log![[thin space (1/6-em)]](https://www.rsc.org/images/entities/char_2009.gif) P (greater than 5): compounds with high log
P (greater than 5): compounds with high log![[thin space (1/6-em)]](https://www.rsc.org/images/entities/char_2009.gif) P values tend to be very lipophilic, which can result in poor aqueous solubility and increased non-specific binding to proteins and other components, potentially limiting their ability to penetrate the BBB effectively.
P values tend to be very lipophilic, which can result in poor aqueous solubility and increased non-specific binding to proteins and other components, potentially limiting their ability to penetrate the BBB effectively.
3. Chemistry and synthesis
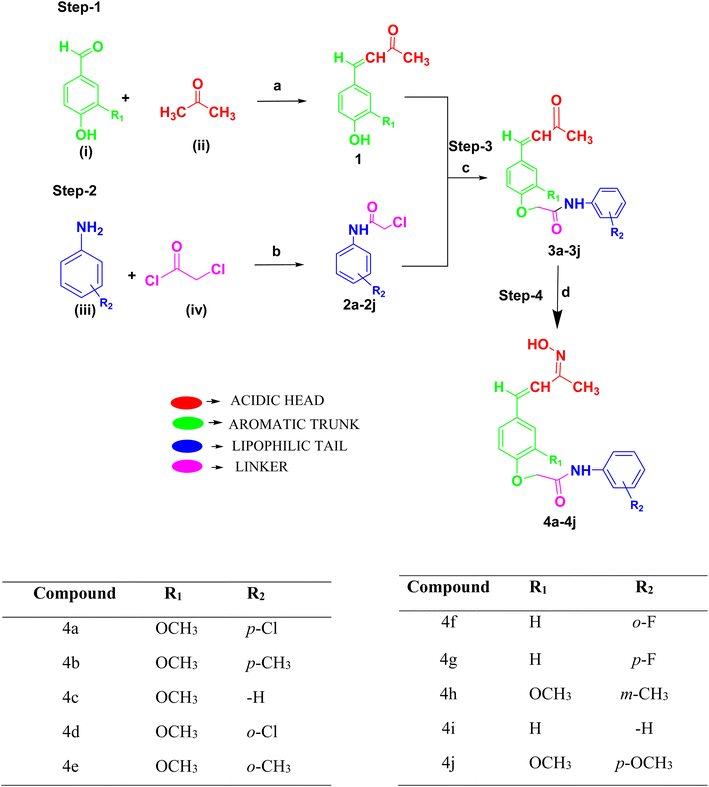
Rationally designed compounds 2-(4-((1E,3E)-3-(hydroxyimino)but-1-en-1-yl)-2-methoxyphenoxy)-N-phenylacetamide derivatives (4a–4j) were synthesized according to Scheme 1. The structures of the synthesized compounds were confirmed using IR, 1H NMR, 13C NMR, and mass spectral techniques. Four steps were employed to synthesize the final compounds. In the first step, two different aromatic aldehydes, such as 4-hydroxy-3-methoxy benzaldehyde (vanillin) and 4-hydroxy benzaldehyde, were (i) treated with acetone (ii) in the presence of NaOH to form the (E)-4-(4-hydroxy-3-methoxyphenyl)but-3-en-2-one derivative (1). In the second step, different aromatic amines (iii) were condensed with chloroacetyl chloride (iv) in the presence of triethylamine to form 2-chloro-N-(substituted phenyl) acetamide derivatives (2a–2j). The synthesized substituted phenols (1) and substituted phenyl acetamides (2a–2j) were reacted together in the presence of anhydrous K2CO3 and KI to form the prefinal compounds (E)-2-(4-(3-oxobut-1-en-1-yl)phenoxy)-N-(substituted phenyl) acetamide derivatives (3a–3j). The final compounds (4a–4j) were obtained by treating compounds 3a–3j with hydroxylamine hydrochloride in the presence of sodium acetate. In Scheme 1, the final compounds (4a–4j) hydroxyimine (N![[double bond, length as m-dash]](https://www.rsc.org/images/entities/char_e001.gif) OH) were formed in the final step using hydroxylamine hydrochloride in the presence of sodium acetate and ethanol as a solvent under optimum temperature. The conditions provided in the synthesis of the titled compounds did not favor the formation of nitrosamine impurity. Therefore, we ruled out the possibility of the formation of nitroso amines as by-products in our synthesis of oximes. Moreover, the final synthesized compounds were purified by column chromatography and their formation was confirmed by checking their mass spectra. Then the structures were characterized and analyzed by NMR spectroscopy. The final compounds were confirmed by the appearance of ∼1520.03 and ∼3313.11 cm−1 signals in the IR spectra, indicating C
OH) were formed in the final step using hydroxylamine hydrochloride in the presence of sodium acetate and ethanol as a solvent under optimum temperature. The conditions provided in the synthesis of the titled compounds did not favor the formation of nitrosamine impurity. Therefore, we ruled out the possibility of the formation of nitroso amines as by-products in our synthesis of oximes. Moreover, the final synthesized compounds were purified by column chromatography and their formation was confirmed by checking their mass spectra. Then the structures were characterized and analyzed by NMR spectroscopy. The final compounds were confirmed by the appearance of ∼1520.03 and ∼3313.11 cm−1 signals in the IR spectra, indicating C![[double bond, length as m-dash]](https://www.rsc.org/images/entities/char_e001.gif) N stretch and –OH stretch, respectively, while the appearance of a proton NMR peak at ∼11.01 δ ppm confirmed the –OH group formation, and an appropriate molecular ion peak (M) obtained by HRMS confirmed the formation of the final compounds.
N stretch and –OH stretch, respectively, while the appearance of a proton NMR peak at ∼11.01 δ ppm confirmed the –OH group formation, and an appropriate molecular ion peak (M) obtained by HRMS confirmed the formation of the final compounds.
4. PPAR gamma binding assay
For evaluation of the agonistic potential of the newly synthesized compounds, the Lanthascreen TR-FRET PPAR-γ competitive binding assay was employed. This assay pivots on the principle of competitive binding to PPAR-γ LBD, wherein the synthesized compounds displaced the fluorescent probe Fluromone. This displacement is quantifiable through a decrease in the 520/490 nm fluorescence ratio. The IC50 values, representing the concentration required to displace 50% of Fluromone, were calculated from concentration–response curves, as presented in Fig. 2.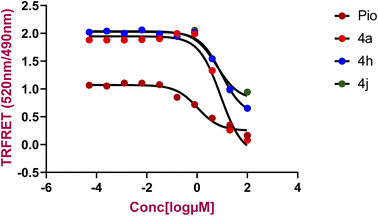 | ||
| Fig. 2 Comparison of Lanthascreen TR-FRET PPAR-γ competitive binding assay results for pioglitazone, 4a, 4h and 4j binding to the PPARγ LBD. | ||
Among the tested compounds, 4a, 4h, and 4j demonstrated binding to the PPAR-γ LBD, with IC50 values of 8.60, 9.24, and 5.97 μM, respectively. For comparison, pioglitazone (Pio), a known PPAR-γ agonist, exhibited an IC50 value of 1.052 μM represented in the Table 3. These findings indicate that the synthesized compounds exhibit a notable binding affinity to PPAR-γ LBD compared to pioglitazone.
| Compd code | IC50 (μM) |
|---|---|
| 4a | 8.60 |
| 4b | 17.25 |
| 4c | 19.46 |
| 4d | 13.27 |
| 4e | 15.62 |
| 4f | 14.03 |
| 4g | 10.89 |
| 4h | 9.24 |
| 4i | 22.79 |
| 4j | 5.97 |
| Pio | 1.05 |
5. In vitro studies
5.1. Cytotoxicity/cell viability assay
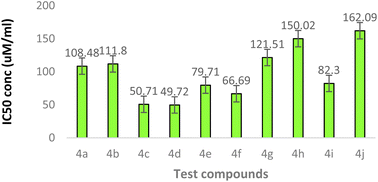
The synthetically derived compounds were assessed for their cytotoxicity against human neuroblastoma (SH-SY5Y) cells by MTT assay. The results of the cytotoxicity study performed by the MTT assay suggested that the compounds 4a (108.4 μM), 4b (111.8 μM), 4g (121.5 μM), 4h (150.0 μM), and 4j (162.0 μM) were cell proliferative and non-cytotoxic in nature with IC50 values greater than 100 μM, while the other compounds 4c, 4d, 4e, 4f, and 4i were cytotoxic in nature on SH-SY5Y cells with IC50 values of 50.71, 49.72, 79.71, 66.69, and 82.30 μM, respectively (Fig. 3). The compounds that showed greater than 70% cell viability at the concentration of 50 μM were considered as cell proliferative against SH-SY5Y cells.5.2. PPAR-γ transactivation assay
The PPAR-γ transactivation assay involved assessment of the particular transcription factor DNA binding activity in nuclear extracts. The findings showed that while all the compounds activated PPAR-γ in a cell-based transcription factor assay with a concentration range of 1–16 μM, notably, compounds 4a, 4h, and 4j demonstrated significant biological efficacy, showing a dose-dependent enhancement in PPAR-γ transcriptional activity, as illustrated in Fig. 4. These compounds showed a significant expression of PPAR-γ in a concentration-dependent manner in SH-SY5Y cells that was comparable to that of pioglitazone, a typical full agonist. Based on these findings 4a, 4h, and 4j are proposed as promising candidates for further inhibition assay to explore and optimize their therapeutic potential.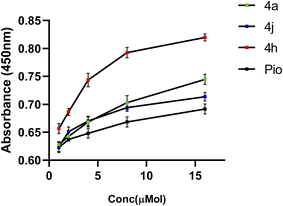 | ||
| Fig. 4 PPAR-γ expression in SH-SY5Y cells treated with the test compounds (4a, 4h, and 4j) and pioglitazone at different concentrations (1–16 μM). | ||
5.3. Anti-inflammatory and anti-oxidant activity in the Aβ-induced SH-SY5Y cell line
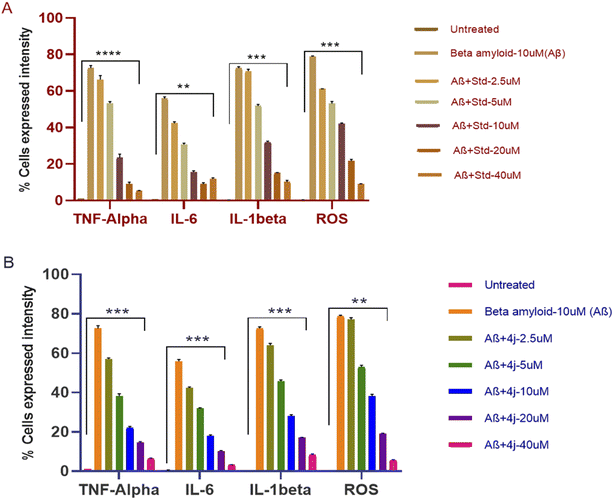
The anti-inflammatory and anti-oxidant activity of compounds 4a, 4h, and 4j, against the Aβ-induced SH-SY5Y cell line were analyzed by measuring the percentage expression of pro-inflammatory cytokines and ROS using flow cytometry. The compounds were taken in different concentration from 2.5 to 40 μM. Most importantly, three of the synthesized compounds 4a, 4h, and 4j showed promising anti-inflammatory activity and anti-oxidant activity by reducing the expression of pro-inflammatory cytokines and ROS, respectively, in comparison to the standard (pioglitazone). The percentage decrease in the expression of cells by compound 4j showed its better activity in comparison to pioglitazone, as shown in Fig. 5.| Culture condition and concentration used | Pioglitazone | Compound 4j | ||||||
|---|---|---|---|---|---|---|---|---|
| TNF-α% | IL-6% | IL-1β% | ROS% | TNF-α% | IL-6% | IL-1β% | ROS% | |
| Untreated | 1.05 | 0.58 | 0.26 | 0.37 | 1.05 | 0.58 | 0.26 | 0.37 |
| Aβ − 10 μM (BAM) | 73.52 | 56.51 | 72.05 | 79.13 | 73.52 | 56.51 | 72.05 | 79.13 |
| B-AM + 2.5 μM | 67.8 | 42.95 | 70.21 | 60.98 | 41.44 | 48.78 | 48.22 | 77.72 |
| B-AM + 5 μM | 53.92 | 30.23 | 52.38 | 53.96 | 35.32 | 36.58 | 45.00 | 53.58 |
| B-AM + 10 μM | 24.85 | 15.09 | 32.36 | 41.78 | 19.75 | 26.69 | 26.02 | 38.78 |
| B-AM + 20 μM | 9.8 | 9.51 | 15.15 | 21.01 | 15.35 | 23.22 | 16.4 | 18.82 |
| B-AM + 40 μM | 5.5 | 12.31 | 10.76 | 9.07 | 8.43 | 6.52 | 4.88 | 5.53 |
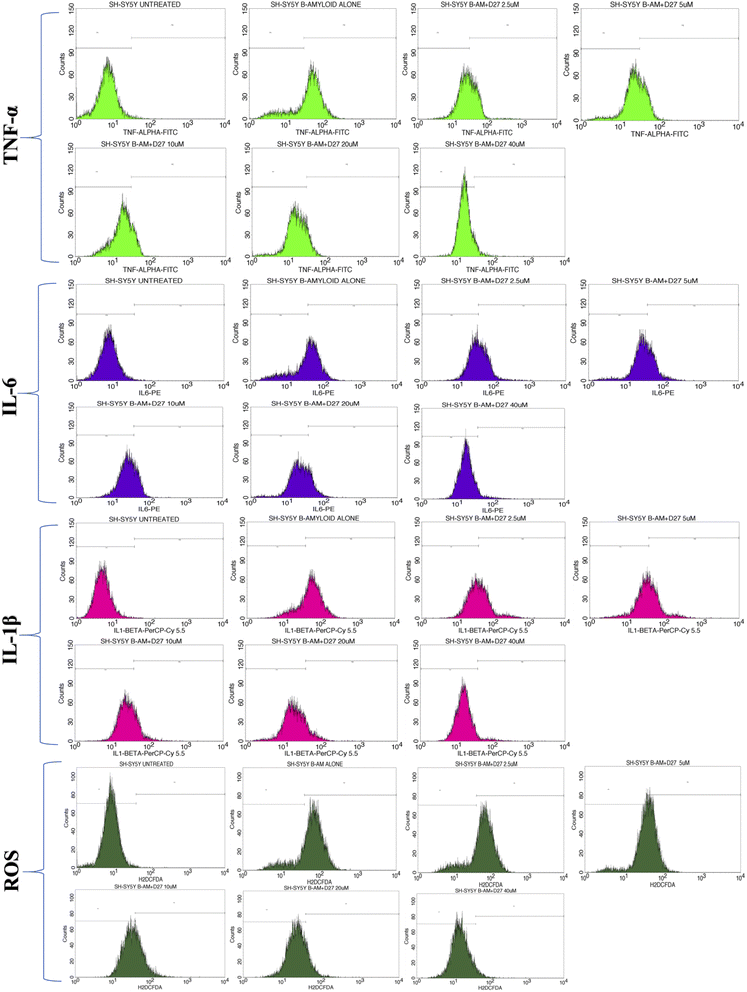
The overlay plot of compound 4j shows it reduced the markers associated with neuroinflammation and markers of stress in a dose-dependent manner compared to the untreated control cell line, as shown in Fig. 6. The histogram of compound 4j is shown in Fig. 7, while the histogram of compounds 4a and 4h are given in the ESI (S:57–S:59).†
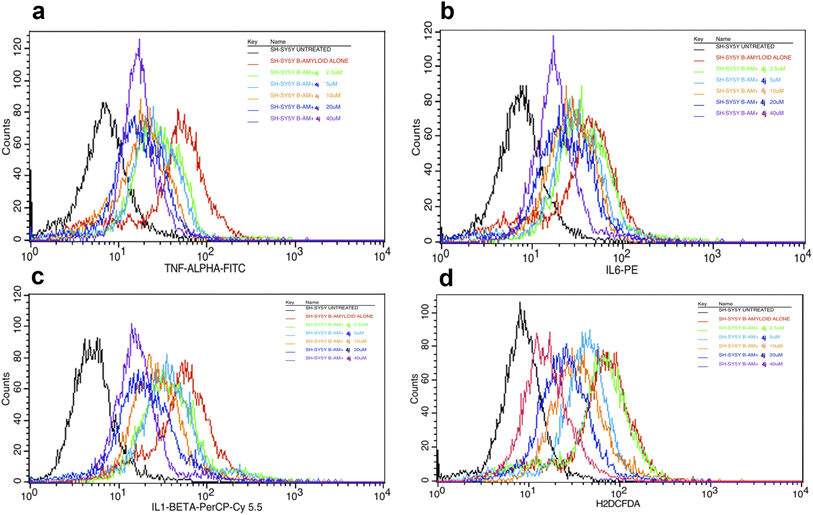 | ||
| Fig. 6 Overlaid TNF-α (a), IL-6 (b), IL-1β (c) and ROS (d) histograms in the Aβ-induced SH-SY5Y cell line for compound 4j under untreated and treated conditions. | ||
6. In silico evaluation
6.1. Molecular docking
The concept of structure-based drug design was implemented for known compounds and a drug target protein. The designed molecules were screened in silico by docking techniques using modeling suite software, such as Discovery Studio (DS). The molecular docking was performed on PPAR-γ to understand the mode of ligand binding to the protein's active site and predict ligand potency to activate the protein in an agonistic sense. The synthesized molecules were docked against Pdb code: 3CS8 protein and the results were obtained in terms of -Cdocker energy and -C-Docker interaction energy. The interaction analysis between the receptor–ligand showed that all the compounds have the potential to bind at the ligand binding site, with varying docking energy scores listed in the Table 5. The -Cdocker energy was found to be significantly high in 4a, 4h, 4j and in the standard (rosiglitazone). The ligand binding domain (LBD) regions of PPAR-γ amino acids were Lys261, Ile281, Cys285, Gln286, Ser289, Ile341, Met364, Lys367, His449, Leu453, Leu469, and Tyr473. Compounds 4a, 4h, and 4j interact with active site amino acids Ile281, Cys285, Ser289, Ile341, Met364, Lys367, Leu453. A one or two hydrogen bond interaction was favored with the amino acids Ile326, Ile281, Ser 289, and Lys367 for compounds 4a, 4h, and 4j, as well as pi–sulfur interaction with sulfur-containing amino acids at the active site, like Cys285 and Met364, while a hydrophobic interaction was observed with other active site amino acids. Common amino acids that interacted with the co-crystal ligand and the functional groups of the active molecules were Ile-341, Cys-285, Arg-288, Met-364, Leu-330, and Ala-292. These findings suggest that the compounds were successfully bound within the LBD of PPARγ, with the optimum binding pattern shown in Fig. 8. All the investigated compounds demonstrated strong quantitative docking results compared to the standard (rosiglitazone) when docked with PPARγ. The results of the docking study supported the proposed hypothesis for the biological activity studies. The stability of these complexes was further analyzed by a molecular dynamic (MD) simulation study.| Compounds | PPAR-gamma | Potential interacting amino acids | |
|---|---|---|---|
| -CDOCKER energy (kcal mol−1) | -CDOCKER interaction energy (kcal mol−1) | ||
| 4a | 30.4483 | 46.7715 | Ile281, Lys367 |
| 4b | 27.4946 | 45.5273 | Ser289, Met367 |
| 4c | 21.4506 | 47.9125 | Glu259, Met348 |
| 4d | 27.2152 | 50.9619 | Ser289, Leu330 |
| 4e | 28.1738 | 41.5233 | Leu453, Cys285 |
| 4f | 28.5051 | 42.6889 | His323, Ser342 |
| 4g | 26.3025 | 44.6894 | His323, Ile281 |
| 4h | 29.3867 | 47.3176 | Leu453, Ser289 |
| 4i | 24.2704 | 45.7233 | His323, Gly284 |
| 4j | 31.6036 | 48.4746 | Ile326, Lys367 |
| Std (rosiglitazone) | 36.3108 | 43.4691 | Lys261, Met364 |
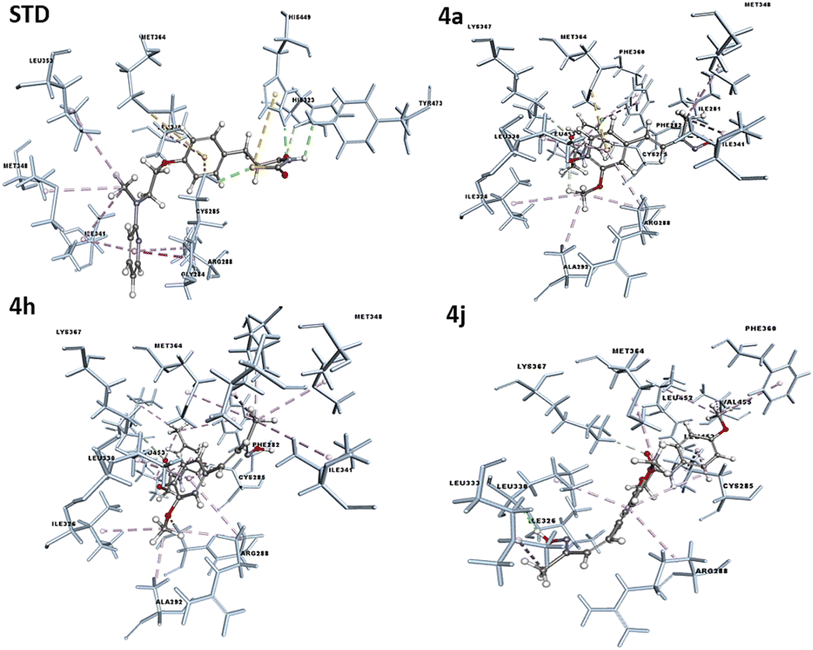 | ||
| Fig. 8 Docking pose of the compounds 4a, 4h, 4j and Std (rosiglitazone) to the active binding site of PPAR-γ. | ||
6.2. Molecular dynamic studies
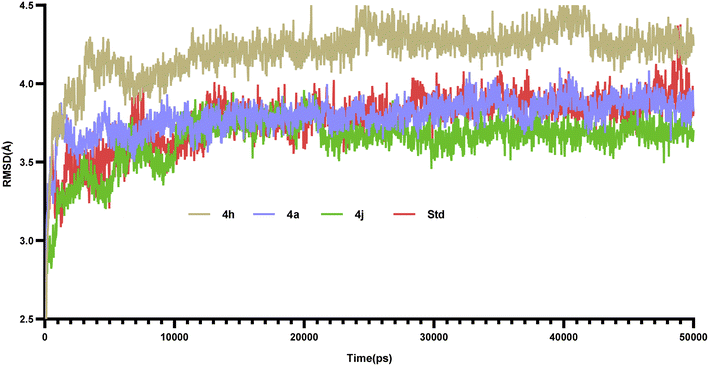
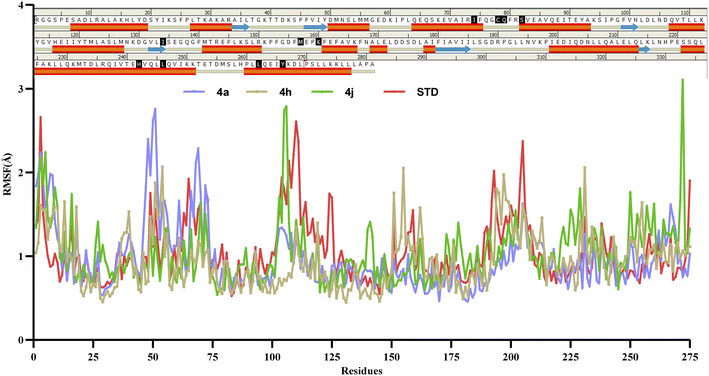
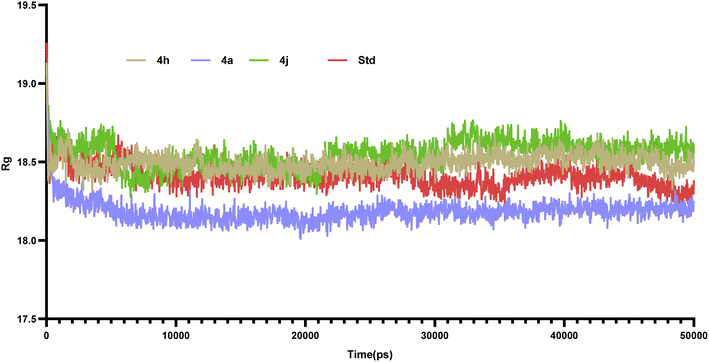
Molecular dynamics simulations of 50 ns duration were performed on 3CS8 protein complexed with compounds 4a, 4h, 4j and the standard. These simulations aimed to characterize the receptor–ligand interactions over time. Subsequent analysis of the trajectories focused on the RMSD, RMSF, and protein–ligand interactions.35| Compounds | Active site amino acids (Å) | ||||||||||
|---|---|---|---|---|---|---|---|---|---|---|---|
| Ile281 | Cys285 | Gln286 | Ser289 | Ile341 | Met364 | Lys367 | His449 | Leu453 | Leu469 | Tyr473 | |
| 4a | 0.913 | 0.634 | 0.845 | 0.592 | 0.817 | 1.02 | 0.565 | 0.797 | 0.782 | 1.299 | 1.259 |
| 4h | 0.687 | 0.589 | 0.552 | 0.937 | 0.718 | 1.233 | 0.91 | 0.926 | 0.849 | 1.045 | 0.921 |
| 4j | 0.777 | 0.603 | 0.622 | 0.609 | 0.889 | 0.831 | 0.669 | 0.976 | 0.925 | 1.024 | 1.281 |
| Std | 0.814 | 0.934 | 1.14 | 0.801 | 0.941 | 1.283 | 0.841 | 1.227 | 0.785 | 1.209 | 0.885 |
7. Structure–activity relationship
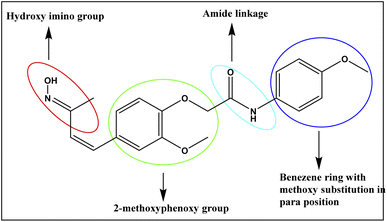
The structure–activity relationship (SAR)37 is a fundamental consideration in organic chemistry that is instrumental in guiding the synthesis of compounds with enhanced potency for various drug targets. It helps predict the biological activity of compounds based on their chemical structure, with functional moieties playing a crucial role. In this study, receptor–ligand complexes (4a–4j) and their derivatives were generated using interaction pharmacophores for detailed analysis. A common 3-hydroxyimino group in all compounds acted as a hydrogen donor or acceptor, while the phenoxy trunk is vital for hydrophobic interactions. Notably, a compound at the lipophilic tail (benzene ring) with a different substitution pattern is critical for mediating the hydrophobic interactions, which subsequently influences the activity. An optimal two-linker system is necessary to connect the phenoxy trunk and the lipophilic tail, ensuring these fragments fit into the active site pocket of PPAR-γ. The functional groups that contributes for the binding of compound to the active binding site of receptor was represented in the Fig. 12. The compound with a methoxy (–OCH3) group at the para position (4j) demonstrated the highest activity among all the tested compounds. Similarly, the compound with a chloride (Cl) group at the para position (4a) also showed enhanced activity, whereas the same chloride substitution at the ortho position resulted in lower activity. Halogen substitutions, such as fluorine (F), at the ortho/para positions, showed slight deviations in activity, while a sole benzene ring exhibited minimal activity. A compound with a methyl (CH3) group at the meta position (4h) showed optimal activity, whereas the para position substitution showed mild activity.Hence, the functional groups in the benzene ring on the para and meta positions are crucial pharmacophores that can interact with the active site residues of drug targets, enhancing the anti-inflammatory effects in PPAR-γ binding and the expression of pro-inflammatory cytokines, as demonstrated by flow cytometry assays. Additionally, electron-donating groups, like methyl and methoxy, are also essential for the biological activity of these compounds.
8. Conclusion
In our study, based on the structural features of available PPAR-γ agonists, such as glitazones, we designed 10 novel compounds for the development of PPAR-γ agonists as neuroprotective agents through their anti-inflammatory and anti-oxidant properties. The synthesized compounds were characterized using analytical techniques. The new compounds were assessed for in vitro TR-FRET by the PPAR-γ competitive binding assay. Among all 10 synthesized compounds, 4a, 4h, and 4j showed significant binding affinity with the target protein compared with the standard drug. In vitro cytotoxicity evaluation of the all 10 compounds was carried with the SH-SY5Y human neuroblastoma cell line. Among all the other compounds, 4a, 4h, and 4j were cell proliferative and non-cytotoxic in nature, with IC50 values greater than 100 μM. The PPAR-γ agonistic activity of all the compounds was assessed using the Human PPAR-γ Transcription Factor Activity Assay Kit. Compounds 4a, 4h, and 4j were found to express PPAR-γ in a concentration-dependent manner in the cell-based transcriptional factor assay. Compounds 4a, 4h, and 4j were assessed for their neuroprotective effect on the Aβ-induced SH-SY5Y cell line by measuring the intensity of reduction in proinflammatory cytokines and ROS by a flow cytometric method. The three compounds reduced the markers associated with neuroinflammation and markers of stress in a dose-dependent manner. Hence, we may infer that among the 10 new compounds, compounds 4a, 4h, and 4j showed the most promising activity by reducing neuroinflammation and reducing oxidative stress in the Aβ-induced cells, thereby exhibiting neuroprotection an effect by binding to PPAR-γ against AD. Furthermore, the molecular docking and MD simulation study results were correlated with the biological activity studies data, as the compounds with good binding interactions with PPAR-γ showed a promising effect on the SH-SY5Y cell line. Further analysis is required to clarify how these compounds ameliorate amyloid beta levels. Future pharmacodynamic and pharmacokinetic studies will be essential for advancing the application of these compounds. Hence, the findings of the current study suggest that the novel PPAR agonists exhibit potential neuroprotective properties, as inferred from their antioxidant and anti-inflammatory activities in the SH-SY5Y cell line under Aβ-induced stress. These findings support the potential use of novel PPAR-γ agonists in the treatment of Alzheimer's disease.Repurposing marketed glitazones for AD treatment is a promising but complex endeavor. Glitazones activate PPAR-γ, influencing pathways relevant to AD pathogenesis, like glucose metabolism, inflammation, and oxidative stress.38 Numerous preclinical studies have demonstrated the beneficial effects of glitazones in AD animal models.39 These effects include improved cognitive function, reduced Aβ levels, and decreased neuroinflammation. Pioglitazone, in particular, has attracted attention due to its potential cognitive benefits in AD patients. Clinical trials have shown mixed results, with some indicating potential cognitive benefits but also highlighting safety concerns, such as cardiovascular risks and side effects, like weight gain.40 The challenge lies in optimizing drug delivery to the brain, where effective concentrations are needed. Regulatory hurdles also exist, necessitating robust clinical evidence to support any new indication. While the evidence suggests that the drug repurposing of glitazones for AD treatment is a promising avenue, further research is needed to address the aforementioned challenges and fully realize the therapeutic potential of these compounds. A careful risk-benefit assessment is essential before their widespread clinical application in AD patients.
9. Experimental
9.1. ADMET, TOPKAT, and drug likeness
The pharmacokinetics and pharmacodynamics properties of the compounds were assessed through small molecular protocols (BIOVIA, Discovery Studio 2020) to understand the compounds behaviors. In addition, mutagenicity and carcinogenicity and the established dosage range of compounds were analyzed using a Bayesian model and regression model. Furthermore, the Lipinski rule of 5 scores were calculated to determine the oral bioavailability of the compounds.419.2. Synthesis and chemistry
A novel series of PPAR-γ agonists were synthesized through the implementation of strategic synthetic methodologies. All the reactants, reagents, and solvents were procured from Sigma-Aldrich and utilized without further purification. The progress of the synthetic reactions was monitored via thin-layer chromatography (TLC), using precoated silica gel 60 F254 on aluminum plates. The synthesized compounds were purified through column chromatography.42 The reaction outcomes were further substantiated through spectroscopic analyses, including infrared (IR) spectroscopy, proton nuclear magnetic resonance (1H-NMR), carbon-13 nuclear magnetic resonance (13C-NMR), and mass spectrometry. The melting points of the synthesized compounds were determined using the open capillary method in a manual melting point apparatus, with the results reported in degrees celsius (°C) without correction. Infrared spectra were recorded on a Shimadzu FT-IR 8400-S spectrometer employing the potassium bromide (KBr) pellet technique. Nuclear magnetic resonance (NMR) spectra (1H and 13C) were acquired using a Bruker 400 MHz FT-NMR spectrometer in deuterated dimethyl sulfoxide as a solvent, with the chemical shifts expressed in parts per million (ppm). Tetramethylsilane (TMS) was used as an internal standard. The coupling constants were recorded in Hertz (Hz). The HRMS of the synthesized molecules were determined utilizing ESI-MSMS (Make-Waters USS, Model-Xevo G2-XS Q TOF, Make-Waters, Illinois, IL, USA). For the analysis of the carbon, hydrogen, nitrogen, and sulfur (in the case of sulfur-containing compounds), an Elementar Vario (EL III Carl Erba11080) instrument was employed. The synthesis of the 10 novel PPAR-γ derivatives followed Scheme 1 and yielded compounds 4a–4j. The TR-FRET binding assay kit (Catlog No. PV4894) was purchased from Invitrogen. Human neuroblastoma SHSY5Y cells were acquired from the National Centre for Cell Science (NCCS) in Pune, India. The pioglitazone was obtained from TCI Chemicals (CAS 11259-15-4) Lot QDIBK-NJ; purity > 98.0%.![[double bond, length as m-dash]](https://www.rsc.org/images/entities/char_e001.gif) O stretch), 1591 (N–H bending), 1520 (N–O stretch), 1238 (C–N stretch). 1HNMR (400 MHz, δ ppm, DMSO-d6): 11.03 (s, 1H, –OH), 9.34 (s, 1H, NH), 8.07 (s, 1H, Ar–H), 7.59 (s, 1H, Ar–H), 7.27 (m, 3H, Ar–H, J = 8 Hz), 7.19 (d, 2H, Ar–H, J = 4 Hz), 7.17 (d, 1H, CH
O stretch), 1591 (N–H bending), 1520 (N–O stretch), 1238 (C–N stretch). 1HNMR (400 MHz, δ ppm, DMSO-d6): 11.03 (s, 1H, –OH), 9.34 (s, 1H, NH), 8.07 (s, 1H, Ar–H), 7.59 (s, 1H, Ar–H), 7.27 (m, 3H, Ar–H, J = 8 Hz), 7.19 (d, 2H, Ar–H, J = 4 Hz), 7.17 (d, 1H, CH![[double bond, length as m-dash]](https://www.rsc.org/images/entities/char_e001.gif) CH, J = 20 Hz), 7.08 (d, 1H, CH
CH, J = 20 Hz), 7.08 (d, 1H, CH![[double bond, length as m-dash]](https://www.rsc.org/images/entities/char_e001.gif) CH, J = 20 Hz), 4.87 (s, 2H, –OCH2), 3.87 (s, 3H, –OCH3), 2.20 (s, 3H, –CH3). 13CNMR (100 MHz, δ ppm, DMSO-d6): 27.84 (CH3), 56.34 (OCH3), 68.60 (OCH2), 111.72 (1ArC), 114.24 (1ArC), 120.02 (2ArC), 123.23 (1ArC), 124.26 (1ArC), 126.27 (1ArC), 128.82 (1ArC), 129.40 (2ArC), 148.53 (1ArC), 138.98 (
CH, J = 20 Hz), 4.87 (s, 2H, –OCH2), 3.87 (s, 3H, –OCH3), 2.20 (s, 3H, –CH3). 13CNMR (100 MHz, δ ppm, DMSO-d6): 27.84 (CH3), 56.34 (OCH3), 68.60 (OCH2), 111.72 (1ArC), 114.24 (1ArC), 120.02 (2ArC), 123.23 (1ArC), 124.26 (1ArC), 126.27 (1ArC), 128.82 (1ArC), 129.40 (2ArC), 148.53 (1ArC), 138.98 (![[double bond, length as m-dash]](https://www.rsc.org/images/entities/char_e001.gif) CH), 143.85 (ArC) 149.86 (
CH), 143.85 (ArC) 149.86 (![[double bond, length as m-dash]](https://www.rsc.org/images/entities/char_e001.gif) CH), 150.16 (C
CH), 150.16 (C![[double bond, length as m-dash]](https://www.rsc.org/images/entities/char_e001.gif) N), 166.83 (C
N), 166.83 (C![[double bond, length as m-dash]](https://www.rsc.org/images/entities/char_e001.gif) O). HRMS calculated [M + H] for C19H19ClN2O4, 375.1111; found [M + H] 375.1029. Anal. calc: C, 60.88; H, 5.11; Cl, 9.46; N, 7.47; found: C, 60.73; H, 5.12; Cl, 9.38; N, 7.41.
O). HRMS calculated [M + H] for C19H19ClN2O4, 375.1111; found [M + H] 375.1029. Anal. calc: C, 60.88; H, 5.11; Cl, 9.46; N, 7.47; found: C, 60.73; H, 5.12; Cl, 9.38; N, 7.41.![[double bond, length as m-dash]](https://www.rsc.org/images/entities/char_e001.gif) O stretch), 1591 (N–H bending), 1551 (N–O stretch), 1249 (C–N stretch). 1HNMR (400 MHz, δ ppm, DMSO-d6): 11.04 (s, 1H, –OH), 9.95 (s, 1H, NH), 7.51 (d, 2H, Ar–H, J = 8 Hz), 7.23 (s, 1H, Ar–H), 7.14 (d, 2H, Ar–H, J = 8 Hz), 7.08 (d, 1H, Ar–H, J = 4 Hz), 6.95 (d, 1H, Ar–H, J = 8 Hz), 6.89 (d, 1H, CH
O stretch), 1591 (N–H bending), 1551 (N–O stretch), 1249 (C–N stretch). 1HNMR (400 MHz, δ ppm, DMSO-d6): 11.04 (s, 1H, –OH), 9.95 (s, 1H, NH), 7.51 (d, 2H, Ar–H, J = 8 Hz), 7.23 (s, 1H, Ar–H), 7.14 (d, 2H, Ar–H, J = 8 Hz), 7.08 (d, 1H, Ar–H, J = 4 Hz), 6.95 (d, 1H, Ar–H, J = 8 Hz), 6.89 (d, 1H, CH![[double bond, length as m-dash]](https://www.rsc.org/images/entities/char_e001.gif) CH, J = 16 Hz), 6.80 (d, 1H, CH
CH, J = 16 Hz), 6.80 (d, 1H, CH![[double bond, length as m-dash]](https://www.rsc.org/images/entities/char_e001.gif) CH, J = 16 Hz), 4.67 (s, 2H, –OCH2), 3.86 (s, 3H, –OCH3), 2.26 (s, 3H, –CH3), 1.97 (s, 3H, –CH3). 13CNMR (100 MHz, δ ppm, DMSO-d6): 9.90 (CH3), 20.90 (CH3), 56.17 (OCH3), 69.02 (OCH2), 110.60 (1ArC), 114.92 (1ArC), 119.97 (2ArC), 120.28 (1ArC), 125.76 (1ArC), 129.61 (
CH, J = 16 Hz), 4.67 (s, 2H, –OCH2), 3.86 (s, 3H, –OCH3), 2.26 (s, 3H, –CH3), 1.97 (s, 3H, –CH3). 13CNMR (100 MHz, δ ppm, DMSO-d6): 9.90 (CH3), 20.90 (CH3), 56.17 (OCH3), 69.02 (OCH2), 110.60 (1ArC), 114.92 (1ArC), 119.97 (2ArC), 120.28 (1ArC), 125.76 (1ArC), 129.61 (![[double bond, length as m-dash]](https://www.rsc.org/images/entities/char_e001.gif) CH), 131.24 (1ArC), 131.71 (2ArC), 133.11 (1ArC), 136.31 (
CH), 131.24 (1ArC), 131.71 (2ArC), 133.11 (1ArC), 136.31 (![[double bond, length as m-dash]](https://www.rsc.org/images/entities/char_e001.gif) CH), 148.03 (1ArC), 149.85 (1ArC), 154.86 (C
CH), 148.03 (1ArC), 149.85 (1ArC), 154.86 (C![[double bond, length as m-dash]](https://www.rsc.org/images/entities/char_e001.gif) N), 166.75 (C
N), 166.75 (C![[double bond, length as m-dash]](https://www.rsc.org/images/entities/char_e001.gif) O). HRMS calculated [M + H] for C20 H22 N2O4, 355.1658; found [M + H] 355.1596. Anal. calc: C, 67.78; H, 6.26; N, 7.90; found: C, 67.62; H, 6.31; N, 7.86.
O). HRMS calculated [M + H] for C20 H22 N2O4, 355.1658; found [M + H] 355.1596. Anal. calc: C, 67.78; H, 6.26; N, 7.90; found: C, 67.62; H, 6.31; N, 7.86.![[double bond, length as m-dash]](https://www.rsc.org/images/entities/char_e001.gif) O stretch), 1602 (N–H bending), 1553 (N–O stretch), 1251 (C–N stretch). 1HNMR (400 MHz, δ ppm, DMSO-d6): 11.04 (s, 1H, –OH), 10.04 (s, 1H, NH), 7.62 (s, 2H, Ar–H), 7.33 (m, 3H, Ar–H), 7.23 (s, 1H, Ar–H), 7.07 (s, 1H, Ar–H), 6.95 (d, 1H, CH
O stretch), 1602 (N–H bending), 1553 (N–O stretch), 1251 (C–N stretch). 1HNMR (400 MHz, δ ppm, DMSO-d6): 11.04 (s, 1H, –OH), 10.04 (s, 1H, NH), 7.62 (s, 2H, Ar–H), 7.33 (m, 3H, Ar–H), 7.23 (s, 1H, Ar–H), 7.07 (s, 1H, Ar–H), 6.95 (d, 1H, CH![[double bond, length as m-dash]](https://www.rsc.org/images/entities/char_e001.gif) CH, J = 20 Hz), 6.85 (d, 1H, CH
CH, J = 20 Hz), 6.85 (d, 1H, CH![[double bond, length as m-dash]](https://www.rsc.org/images/entities/char_e001.gif) CH, J = 20 Hz), 4.70 (s, 2H, –OCH2), 3.86 (s, 3H, –OCH3), 1.91 (s, 3H, –CH3). 13CNMR (100 MHz, δ ppm, DMSO-d6): 9.90 (CH3), 56.17 (OCH3), 68.98 (OCH2), 110.60 (2ArC), 114.88 (1ArC), 119.25 (2ArC), 120.28 (1ArC), 124.14 (1ArC), 125.77 (1ArC), 129.25 (2ArC), 131.25 (1ArC), 131.71 (1ArC), 138.83 (ArC), 148.02 (
CH, J = 20 Hz), 4.70 (s, 2H, –OCH2), 3.86 (s, 3H, –OCH3), 1.91 (s, 3H, –CH3). 13CNMR (100 MHz, δ ppm, DMSO-d6): 9.90 (CH3), 56.17 (OCH3), 68.98 (OCH2), 110.60 (2ArC), 114.88 (1ArC), 119.25 (2ArC), 120.28 (1ArC), 124.14 (1ArC), 125.77 (1ArC), 129.25 (2ArC), 131.25 (1ArC), 131.71 (1ArC), 138.83 (ArC), 148.02 (![[double bond, length as m-dash]](https://www.rsc.org/images/entities/char_e001.gif) CH), 149.84 (
CH), 149.84 (![[double bond, length as m-dash]](https://www.rsc.org/images/entities/char_e001.gif) CH), 154.87 (C
CH), 154.87 (C![[double bond, length as m-dash]](https://www.rsc.org/images/entities/char_e001.gif) N), 167.01 (C
N), 167.01 (C![[double bond, length as m-dash]](https://www.rsc.org/images/entities/char_e001.gif) O). HRMS calculated, [M + H] for C19 H20 N2O4 341.1501; found [M + H] 341.1453. Anal. calc: C, 67.05; H, 5.92; N, 8.23; found: C, 67.15; H, 5.89; N, 8.26.
O). HRMS calculated, [M + H] for C19 H20 N2O4 341.1501; found [M + H] 341.1453. Anal. calc: C, 67.05; H, 5.92; N, 8.23; found: C, 67.15; H, 5.89; N, 8.26.![[double bond, length as m-dash]](https://www.rsc.org/images/entities/char_e001.gif) O) 1595 (N–H bending). 1HNMR (400 MHz, δ ppm, DMSO-d6): 10.99 (s, 1H, –OH), 9.29 (s, 1H, NH), 8.03 (s, 1H, Ar–H), 7.56 (d, 1H, Ar–H, J = 8 Hz), 7.21 (m, 3H, Ar–H, J = 8 Hz), 7.19 (d, 1H, Ar–H, J = 8 Hz), 7.14 (d, 1H, –CH
O) 1595 (N–H bending). 1HNMR (400 MHz, δ ppm, DMSO-d6): 10.99 (s, 1H, –OH), 9.29 (s, 1H, NH), 8.03 (s, 1H, Ar–H), 7.56 (d, 1H, Ar–H, J = 8 Hz), 7.21 (m, 3H, Ar–H, J = 8 Hz), 7.19 (d, 1H, Ar–H, J = 8 Hz), 7.14 (d, 1H, –CH![[double bond, length as m-dash]](https://www.rsc.org/images/entities/char_e001.gif) CH, J = 24 Hz),7.06 (d, 1H, –CH
CH, J = 24 Hz),7.06 (d, 1H, –CH![[double bond, length as m-dash]](https://www.rsc.org/images/entities/char_e001.gif) CH, J = 24 Hz), 6.98 (s, 1H, Ar–H), 4.72 (s, 2H, –OCH2), 3.80 (s, 3H, –OCH3), 2.18 (s, 3H, –CH3). 13CNMR (100 MHz, δ ppm, DMSO-d6): 17.86 (CH3) 55.96 (OCH3), 68.44 (OCH2), 109.47 (2ArC), 114.32 (1ArC), 120.45 (2ArC), 124.27 (1ArC), 125.62 (1ArC), 126.59 (1ArC), 127.49 (1ArC), 130.80 (2ArC), 131.12 (1ArC), 135.97 (1ArC), 148.13 (
CH, J = 24 Hz), 6.98 (s, 1H, Ar–H), 4.72 (s, 2H, –OCH2), 3.80 (s, 3H, –OCH3), 2.18 (s, 3H, –CH3). 13CNMR (100 MHz, δ ppm, DMSO-d6): 17.86 (CH3) 55.96 (OCH3), 68.44 (OCH2), 109.47 (2ArC), 114.32 (1ArC), 120.45 (2ArC), 124.27 (1ArC), 125.62 (1ArC), 126.59 (1ArC), 127.49 (1ArC), 130.80 (2ArC), 131.12 (1ArC), 135.97 (1ArC), 148.13 (![[double bond, length as m-dash]](https://www.rsc.org/images/entities/char_e001.gif) CH), 148.64 (
CH), 148.64 (![[double bond, length as m-dash]](https://www.rsc.org/images/entities/char_e001.gif) CH), 149.64 (C
CH), 149.64 (C![[double bond, length as m-dash]](https://www.rsc.org/images/entities/char_e001.gif) N), 166.76 (C
N), 166.76 (C![[double bond, length as m-dash]](https://www.rsc.org/images/entities/char_e001.gif) O). HRMS calculated [M + H] for C19H19Cl N2O4, 375.1111; found [M + H] 375.1029. Anal. calc: C, 60.88; H, 5.11; N, 7.47; found: C, 60.46; H, 5.21; N, 7.78.
O). HRMS calculated [M + H] for C19H19Cl N2O4, 375.1111; found [M + H] 375.1029. Anal. calc: C, 60.88; H, 5.11; N, 7.47; found: C, 60.46; H, 5.21; N, 7.78.![[double bond, length as m-dash]](https://www.rsc.org/images/entities/char_e001.gif) O stretch), 1591 (N–H bending), 1549 (N–O stretch), 1264 (C–N stretch). 1HNMR (400 MHz, δ ppm, DMSO-d6): 10.43 (s, 1H, –OH), 9.35 (s, 1H, NH), 7.60 (d, 2H, Ar–H, J = 8 Hz), 7.41 (d, 1H, Ar–H, J = 4 Hz), 7.29 (m, 3H, Ar–H), 7.10 (t, 1H, Ar–H, J = 8), 7.085 (d, 1H, CH
O stretch), 1591 (N–H bending), 1549 (N–O stretch), 1264 (C–N stretch). 1HNMR (400 MHz, δ ppm, DMSO-d6): 10.43 (s, 1H, –OH), 9.35 (s, 1H, NH), 7.60 (d, 2H, Ar–H, J = 8 Hz), 7.41 (d, 1H, Ar–H, J = 4 Hz), 7.29 (m, 3H, Ar–H), 7.10 (t, 1H, Ar–H, J = 8), 7.085 (d, 1H, CH![[double bond, length as m-dash]](https://www.rsc.org/images/entities/char_e001.gif) CH, J = 16 Hz), 6.80 (d, CH
CH, J = 16 Hz), 6.80 (d, CH![[double bond, length as m-dash]](https://www.rsc.org/images/entities/char_e001.gif) CH, J = 16 Hz), 4.67 (s, 2H, –OCH2), 3.86 (s, 3H, –OCH3), 2.26 (s, 3H, –CH3), 1.97 (s, 3H, –CH3). 13CNMR (100 MHz, δ ppm, DMSO-d6): 9.90 (CH3), 20.90 (CH3), 56.17 (OCH3), 69.02 (OCH2), 110.60 (1ArC), 114.92 (1ArC), 119.97 (2ArC), 120.28 (1ArC), 125.76 (1ArC), 129.61 (2ArC), 131.24 (1ArC), 131.71 (1ArC), 133.11 (1ArC), 136.31 (1ArC), 148.03 (
CH, J = 16 Hz), 4.67 (s, 2H, –OCH2), 3.86 (s, 3H, –OCH3), 2.26 (s, 3H, –CH3), 1.97 (s, 3H, –CH3). 13CNMR (100 MHz, δ ppm, DMSO-d6): 9.90 (CH3), 20.90 (CH3), 56.17 (OCH3), 69.02 (OCH2), 110.60 (1ArC), 114.92 (1ArC), 119.97 (2ArC), 120.28 (1ArC), 125.76 (1ArC), 129.61 (2ArC), 131.24 (1ArC), 131.71 (1ArC), 133.11 (1ArC), 136.31 (1ArC), 148.03 (![[double bond, length as m-dash]](https://www.rsc.org/images/entities/char_e001.gif) CH), 149.85 (
CH), 149.85 (![[double bond, length as m-dash]](https://www.rsc.org/images/entities/char_e001.gif) CH), 154.86 (C
CH), 154.86 (C![[double bond, length as m-dash]](https://www.rsc.org/images/entities/char_e001.gif) N), 166.75 (C
N), 166.75 (C![[double bond, length as m-dash]](https://www.rsc.org/images/entities/char_e001.gif) O). HRMS calculated [M + H] for C20H22N2O4, 355.1658; found [M + H] 355.1558. Anal. calc: C, 67.78; H, 6.26; N, 7.90; found: C, 67.57; H, 6.32; N, 7.95.
O). HRMS calculated [M + H] for C20H22N2O4, 355.1658; found [M + H] 355.1558. Anal. calc: C, 67.78; H, 6.26; N, 7.90; found: C, 67.57; H, 6.32; N, 7.95.![[double bond, length as m-dash]](https://www.rsc.org/images/entities/char_e001.gif) O stretch), 1596 (N–H bending), 1549 (N–O stretch), 1265 (C–N stretch). 1HNMR (400 MHz, δ ppm, DMSO-d6): 11.04 (s, 1H, –OH), 9.89 (s, 1H, NH), 7.84 (d, 1H, Ar–H, J = 4 Hz), 7.54 (d, 2H, Ar–H, J = 8 Hz), 7.31 (m, 4H, Ar–H), 7.00 (d, 2H, Ar–H, J = 8 Hz), 6.92 (d, 1H, CH
O stretch), 1596 (N–H bending), 1549 (N–O stretch), 1265 (C–N stretch). 1HNMR (400 MHz, δ ppm, DMSO-d6): 11.04 (s, 1H, –OH), 9.89 (s, 1H, NH), 7.84 (d, 1H, Ar–H, J = 4 Hz), 7.54 (d, 2H, Ar–H, J = 8 Hz), 7.31 (m, 4H, Ar–H), 7.00 (d, 2H, Ar–H, J = 8 Hz), 6.92 (d, 1H, CH![[double bond, length as m-dash]](https://www.rsc.org/images/entities/char_e001.gif) CH, J = 16 Hz), 6.76 (d, 1H, CH
CH, J = 16 Hz), 6.76 (d, 1H, CH![[double bond, length as m-dash]](https://www.rsc.org/images/entities/char_e001.gif) CH, J = 20 Hz), 4.79 (s, 2H, –OCH2), 1.982 (s, 3H, –CH3). 13CNMR (100 MHz, δ ppm, DMSO-d6): 9.91(CH3), 67.34 (OCH2), 115.42 (2ArC), 115.98 (1ArC), 116.17 (1ArC), 124.87 (1ArC), 125.29 (1ArC), 125.71 (
CH, J = 20 Hz), 4.79 (s, 2H, –OCH2), 1.982 (s, 3H, –CH3). 13CNMR (100 MHz, δ ppm, DMSO-d6): 9.91(CH3), 67.34 (OCH2), 115.42 (2ArC), 115.98 (1ArC), 116.17 (1ArC), 124.87 (1ArC), 125.29 (1ArC), 125.71 (![[double bond, length as m-dash]](https://www.rsc.org/images/entities/char_e001.gif) CH), 125.83 (1ArC) 126.47 (1ArC), 126.83 (d, JC–F = 7.1 Hz, C-3), 128.45 (2ArC), 130.32 (1ArC), 131.37 (
CH), 125.83 (1ArC) 126.47 (1ArC), 126.83 (d, JC–F = 7.1 Hz, C-3), 128.45 (2ArC), 130.32 (1ArC), 131.37 (![[double bond, length as m-dash]](https://www.rsc.org/images/entities/char_e001.gif) CH), 154.87 (C
CH), 154.87 (C![[double bond, length as m-dash]](https://www.rsc.org/images/entities/char_e001.gif) N), 158.15 (C–F), 167.03 (C
N), 158.15 (C–F), 167.03 (C![[double bond, length as m-dash]](https://www.rsc.org/images/entities/char_e001.gif) O). HRMS calculated [M + H] for C18H17FN2O3, 329.1301; found [M + H] 329.1189. Anal. calc. C, 65.85; H, 5.22; N, 8.53; found: C, 65.72; H, 5.43; N, 8.65.
O). HRMS calculated [M + H] for C18H17FN2O3, 329.1301; found [M + H] 329.1189. Anal. calc. C, 65.85; H, 5.22; N, 8.53; found: C, 65.72; H, 5.43; N, 8.65.![[double bond, length as m-dash]](https://www.rsc.org/images/entities/char_e001.gif) O stretch), 1579 (N–H bending), 1506 (N–O stretch), 1304 (C–N stretch). 1HNMR (400 MHz, δ ppm, DMSO-d6): 11.03 (s, 1H, –OH), 10.15 (s, 1H, NH), 7.68 (dd, 2H, Ar–H, J = 4 Hz), 7.54 (d, 2H,Ar–H, J = 12 Hz), 7.19 (t, 2H, Ar–H, J = 8 Hz), 7.01 (d, 2H, Ar–H, J = 8 Hz), 6.91 (d, 1H, CH
O stretch), 1579 (N–H bending), 1506 (N–O stretch), 1304 (C–N stretch). 1HNMR (400 MHz, δ ppm, DMSO-d6): 11.03 (s, 1H, –OH), 10.15 (s, 1H, NH), 7.68 (dd, 2H, Ar–H, J = 4 Hz), 7.54 (d, 2H,Ar–H, J = 12 Hz), 7.19 (t, 2H, Ar–H, J = 8 Hz), 7.01 (d, 2H, Ar–H, J = 8 Hz), 6.91 (d, 1H, CH![[double bond, length as m-dash]](https://www.rsc.org/images/entities/char_e001.gif) CH, J = 16 Hz), 6.75 (d, 1H, CH
CH, J = 16 Hz), 6.75 (d, 1H, CH![[double bond, length as m-dash]](https://www.rsc.org/images/entities/char_e001.gif) CH, J = 16 Hz), 4.71 (s, 2H, –CH2), 1.97 (s, 2H, –CH2). 13CNMR (100 MHz, δ ppm, DMSO-d6): 9.90 (CH3), 68.70 (OCH2), 115.46 (2ArC), 115.66 (2ArC), 122.02 (2ArC), 124.93 (d, JC–F = 3.5 Hz, C-4), 125.36 (
CH, J = 16 Hz), 4.71 (s, 2H, –CH2), 1.97 (s, 2H, –CH2). 13CNMR (100 MHz, δ ppm, DMSO-d6): 9.90 (CH3), 68.70 (OCH2), 115.46 (2ArC), 115.66 (2ArC), 122.02 (2ArC), 124.93 (d, JC–F = 3.5 Hz, C-4), 125.36 (![[double bond, length as m-dash]](https://www.rsc.org/images/entities/char_e001.gif) CH), 128 (1ArC), 130.32 (1ArC), 131.237 (
CH), 128 (1ArC), 130.32 (1ArC), 131.237 (![[double bond, length as m-dash]](https://www.rsc.org/images/entities/char_e001.gif) CH) 135.18 (2ArC), 154.86 (C
CH) 135.18 (2ArC), 154.86 (C![[double bond, length as m-dash]](https://www.rsc.org/images/entities/char_e001.gif) N), 157.54 (1ArC–O), 159.93(C–F), 166.86 (C
N), 157.54 (1ArC–O), 159.93(C–F), 166.86 (C![[double bond, length as m-dash]](https://www.rsc.org/images/entities/char_e001.gif) O). HRMS calculated [M + H] for C18H17FN2O3, 329.1301; found [M + H] 329.1189. Anal. calc: C, 65.85; H, 5.22; N, 8.53; found: C, 65.71; H, 5.36; N, 8.79.
O). HRMS calculated [M + H] for C18H17FN2O3, 329.1301; found [M + H] 329.1189. Anal. calc: C, 65.85; H, 5.22; N, 8.53; found: C, 65.71; H, 5.36; N, 8.79.![[double bond, length as m-dash]](https://www.rsc.org/images/entities/char_e001.gif) O stretch), 1615 (N–H bending), 1556 (N–O stretch), 1248 (C–N stretch). 1HNMR (400 MHz, δ ppm, DMSO-d6): 10.14 (s, 1H, –OH), 9.37 (s, 1H, NH), 7.48 (m, 3H, Ar–H), 7.22 (d, 2H, Ar–H, J = 8 Hz), 7.03 (s, 1H, Ar–H), 6.94 (d, 1H, CH
O stretch), 1615 (N–H bending), 1556 (N–O stretch), 1248 (C–N stretch). 1HNMR (400 MHz, δ ppm, DMSO-d6): 10.14 (s, 1H, –OH), 9.37 (s, 1H, NH), 7.48 (m, 3H, Ar–H), 7.22 (d, 2H, Ar–H, J = 8 Hz), 7.03 (s, 1H, Ar–H), 6.94 (d, 1H, CH![[double bond, length as m-dash]](https://www.rsc.org/images/entities/char_e001.gif) CH, J = 16 Hz), 6.87 (d, 1H, CH
CH, J = 16 Hz), 6.87 (d, 1H, CH![[double bond, length as m-dash]](https://www.rsc.org/images/entities/char_e001.gif) CH, J = 16 Hz), 6.41 (s, 1H, Ar–H), 4.73 (s, 2H, –OCH2), 3.86 (s, 3H, –OCH3), 2.09 (s, 3H, –CH3), 2.01 (s, 3H, –CH3). 13CNMR (100 MHz, δ ppm, DMSO-d6): 9.90 (CH3), 21.63 (CH3), 56.12 (OCH3), 68.84 (OCH2), 110.47 (1ArC), 114.67 (1ArC), 117.08 (1ArC), 120.41 (2ArC), 124.82 (
CH, J = 16 Hz), 6.41 (s, 1H, Ar–H), 4.73 (s, 2H, –OCH2), 3.86 (s, 3H, –OCH3), 2.09 (s, 3H, –CH3), 2.01 (s, 3H, –CH3). 13CNMR (100 MHz, δ ppm, DMSO-d6): 9.90 (CH3), 21.63 (CH3), 56.12 (OCH3), 68.84 (OCH2), 110.47 (1ArC), 114.67 (1ArC), 117.08 (1ArC), 120.41 (2ArC), 124.82 (![[double bond, length as m-dash]](https://www.rsc.org/images/entities/char_e001.gif) CH), 125.70 (1ArC), 129.10 (1ArC), 131.15 (
CH), 125.70 (1ArC), 129.10 (1ArC), 131.15 (![[double bond, length as m-dash]](https://www.rsc.org/images/entities/char_e001.gif) CH), 131.74 (1ArC), 138.48 (1ArC), 138.76 (1ArC), 147.99 (1ArC), 149.76 (1ArC), 154.89 (C
CH), 131.74 (1ArC), 138.48 (1ArC), 138.76 (1ArC), 147.99 (1ArC), 149.76 (1ArC), 154.89 (C![[double bond, length as m-dash]](https://www.rsc.org/images/entities/char_e001.gif) N), 166.93 (C
N), 166.93 (C![[double bond, length as m-dash]](https://www.rsc.org/images/entities/char_e001.gif) O). HRMS calculated [M + H] for C20H22N2O4, 355.1658; found [M + H] 355.1596. Anal. calc. C, 67.78; H, 6.26; N, 7.90; found: C, 67.82; H, 6.17; N, 7.89.
O). HRMS calculated [M + H] for C20H22N2O4, 355.1658; found [M + H] 355.1596. Anal. calc. C, 67.78; H, 6.26; N, 7.90; found: C, 67.82; H, 6.17; N, 7.89.![[double bond, length as m-dash]](https://www.rsc.org/images/entities/char_e001.gif) O stretch), 1618 (N–H bending), 1538 (N–O stretch), 1247 (C–N stretch). 1HNMR (400 MHz, δ ppm, DMSO-d6): 10.15 (s, 1H, –OH), 9.31 (s, 1H, NH)), 7.68 (dd, 2H, Ar–H, J = 8 Hz), 7.50 (d, 2H, Ar–H, J = 8 Hz), 7.19 (t, 1H, Ar–H, J = 8 Hz), 7.02 (d, 2H, Ar–H, J = 8 Hz), 6.92 (d, 1H, CH
O stretch), 1618 (N–H bending), 1538 (N–O stretch), 1247 (C–N stretch). 1HNMR (400 MHz, δ ppm, DMSO-d6): 10.15 (s, 1H, –OH), 9.31 (s, 1H, NH)), 7.68 (dd, 2H, Ar–H, J = 8 Hz), 7.50 (d, 2H, Ar–H, J = 8 Hz), 7.19 (t, 1H, Ar–H, J = 8 Hz), 7.02 (d, 2H, Ar–H, J = 8 Hz), 6.92 (d, 1H, CH![[double bond, length as m-dash]](https://www.rsc.org/images/entities/char_e001.gif) CH, J = 16 Hz), 6.78 (d, 1H, CH
CH, J = 16 Hz), 6.78 (d, 1H, CH![[double bond, length as m-dash]](https://www.rsc.org/images/entities/char_e001.gif) CH, J = 16 Hz), 6.38 (s, 1H, ArH), 4.72 (s, 2H, –CH2), 2.00 (s, 2H, –CH2). 13CNMR (100 MHz, δ ppm, DMSO-d6): 11.98 (CH3), 67.61 (OCH2), 115.53 (2ArC), 122.01 (2ArC), 128.26 (2ArC), 130.39 (
CH, J = 16 Hz), 6.38 (s, 1H, ArH), 4.72 (s, 2H, –CH2), 2.00 (s, 2H, –CH2). 13CNMR (100 MHz, δ ppm, DMSO-d6): 11.98 (CH3), 67.61 (OCH2), 115.53 (2ArC), 122.01 (2ArC), 128.26 (2ArC), 130.39 (![[double bond, length as m-dash]](https://www.rsc.org/images/entities/char_e001.gif) CH), 131.12 (1ArC) 135.18 (
CH), 131.12 (1ArC) 135.18 (![[double bond, length as m-dash]](https://www.rsc.org/images/entities/char_e001.gif) CH), 146.12 (1C, ArC–N), 157.42 (C
CH), 146.12 (1C, ArC–N), 157.42 (C![[double bond, length as m-dash]](https://www.rsc.org/images/entities/char_e001.gif) N), 158.20 (1C, ArC–O), 166.86 (C
N), 158.20 (1C, ArC–O), 166.86 (C![[double bond, length as m-dash]](https://www.rsc.org/images/entities/char_e001.gif) O) 1.97 (s, 3H, –CH3). HRMS calculated [M + H] for C18H18N2O3, 311.1395; found [M + H] 311.1589. Anal. calc. C, 69.66; H, 5.85; N, 9.03; found: C, 69.71; H, 5.84; N, 9.11.
O) 1.97 (s, 3H, –CH3). HRMS calculated [M + H] for C18H18N2O3, 311.1395; found [M + H] 311.1589. Anal. calc. C, 69.66; H, 5.85; N, 9.03; found: C, 69.71; H, 5.84; N, 9.11.![[double bond, length as m-dash]](https://www.rsc.org/images/entities/char_e001.gif) O stretch), 1608 (N–H bending), 1556 (N–O stretch), 1247 (C–N stretch). 1HNMR (400 MHz, δ ppm, DMSO-d6): 11.04 (s, 1H, –OH), 9.90 (s, 1H, NH), 7.54 (d, 2H, Ar–H, J = 9.2 Hz), 7.23 (d, 1H, Ar–H, J = 1.6 Hz), 7.06 (d, 1H, CH
O stretch), 1608 (N–H bending), 1556 (N–O stretch), 1247 (C–N stretch). 1HNMR (400 MHz, δ ppm, DMSO-d6): 11.04 (s, 1H, –OH), 9.90 (s, 1H, NH), 7.54 (d, 2H, Ar–H, J = 9.2 Hz), 7.23 (d, 1H, Ar–H, J = 1.6 Hz), 7.06 (d, 1H, CH![[double bond, length as m-dash]](https://www.rsc.org/images/entities/char_e001.gif) CH, J = 2 Hz), 6.95 (m, 3H, Ar–H), 6.89 (d, 1H, CH
CH, J = 2 Hz), 6.95 (m, 3H, Ar–H), 6.89 (d, 1H, CH![[double bond, length as m-dash]](https://www.rsc.org/images/entities/char_e001.gif) CH, J = 16 Hz), 6.80 (d, 1H, CH
CH, J = 16 Hz), 6.80 (d, 1H, CH![[double bond, length as m-dash]](https://www.rsc.org/images/entities/char_e001.gif) CH, J = 16 Hz), 4.66 (s, 2H, –OCH2), 3.86 (s, 3H, –OCH3), 3.73 (s, 3H, –OCH3), 1.98 (s, 3H, –CH3). 13CNMR (100 MHz, δ ppm, DMSO-d6): 9.59 (CH3), 55.98 (OCH3), 56.12 (OCH3), 66.92 (OCH2), 111.52 (1ArC), 115.34 (2ArC), 122.56 (3ArC), 124.36 (
CH, J = 16 Hz), 4.66 (s, 2H, –OCH2), 3.86 (s, 3H, –OCH3), 3.73 (s, 3H, –OCH3), 1.98 (s, 3H, –CH3). 13CNMR (100 MHz, δ ppm, DMSO-d6): 9.59 (CH3), 55.98 (OCH3), 56.12 (OCH3), 66.92 (OCH2), 111.52 (1ArC), 115.34 (2ArC), 122.56 (3ArC), 124.36 (![[double bond, length as m-dash]](https://www.rsc.org/images/entities/char_e001.gif) CH), 127.26 (1ArC), 130.81 (1ArC), 137.32 (
CH), 127.26 (1ArC), 130.81 (1ArC), 137.32 (![[double bond, length as m-dash]](https://www.rsc.org/images/entities/char_e001.gif) CH), 147.35 (1ArC), 149.75 (1ArC), 156.24 (1ArC), 156.28 (C
CH), 147.35 (1ArC), 149.75 (1ArC), 156.24 (1ArC), 156.28 (C![[double bond, length as m-dash]](https://www.rsc.org/images/entities/char_e001.gif) N), 158.91 (1ArH), 167.91 (C
N), 158.91 (1ArH), 167.91 (C![[double bond, length as m-dash]](https://www.rsc.org/images/entities/char_e001.gif) O). HRMS calculated [M + H] for C20H22N2O5, 371.1607; found [M + H] 371.1495. Anal. calc: C, 64.85; H, 5.99; N, 7.56; found: C, 64.76; H, 5.95; N, 7.68.
O). HRMS calculated [M + H] for C20H22N2O5, 371.1607; found [M + H] 371.1495. Anal. calc: C, 64.85; H, 5.99; N, 7.56; found: C, 64.76; H, 5.95; N, 7.68.9.3. TR-FRET assay
The study investigated the ability of the synthesized compounds to interact with the PPAR-γ ligand binding domain (PPAR-γ-LBD) using the Lanthascreen TR-FRET PPARγ competitive binding assay kit from Invitrogen. Following the instructions provided with the kit, the procedure involved mixing 0.5 nM of GST-tagged human PPAR-γ-LBD, 5 nM of terbium-labeled anti-GST antibody, 5 nM of a fluorescent PPAR ligand (Fluormone Pan-PPAR Green), and varying concentrations of the new compounds along with pioglitazone. This mixture was then incubated in the dark for 2 to 3 h. The FRET signal was detected using a Varioskan LUX multimode microplate reader (Thermo Fischer) by exciting at 340 nm and recording emissions at 530 nm for Fluormone™ Pan-PPAR Green and 490 nm for terbium. The interaction with PPAR-γ-LBD was assessed based on the ratio of the emission at 530 nm and 490 nm.43 The principle behind this is that the test compounds, when binding to the PPAR-γ- LBD, will displace the fluorescently labeled ligand, leading to a reduced FRET signal. This decrease in the FRET signal, indicated by the 530 nm/490 nm ratio, can serve as an indicator of the compound's binding efficiency to the human PPARγ LBD.44 The results were processed using Prism software (GraphPad Software 08) and the sigmoidal curve equation with a variable slope was applied to determine the IC50 values of the compounds.9.4. Cytotoxicity/cell viability assay
For the MTT assay conducted on the neuroblastoma (SH-SY5Y) cell line, cells were cultured under standard conditions and seeded in a 96-well plate at a density optimized for growth, typically ranging from 5000–10![[thin space (1/6-em)]](https://www.rsc.org/images/entities/char_2009.gif) 000 cells per well. Following 24 h adherence, the cells were treated with various concentrations of the synthesized compounds and the controls comprising untreated cells. Post 24–72 h of incubation, the cell viability was assessed using the MTT assay.45,46 This involved replacing the treatment media with a fresh MTT solution (5 mg mL−1 in PBS), incubating for 2–4 hours to allow for formazan crystal formation, followed by solubilization using DMSO or isopropanol. The absorbance was measured at 570 nm using a microplate reader, correlating directly with living cell numbers. Data were analyzed by comparing treated and untreated cells' absorbance values to calculate the IC50 value. The IC50 value was determined by using a linear regression equation. The percentage cell viability was calculated using the below formula.
000 cells per well. Following 24 h adherence, the cells were treated with various concentrations of the synthesized compounds and the controls comprising untreated cells. Post 24–72 h of incubation, the cell viability was assessed using the MTT assay.45,46 This involved replacing the treatment media with a fresh MTT solution (5 mg mL−1 in PBS), incubating for 2–4 hours to allow for formazan crystal formation, followed by solubilization using DMSO or isopropanol. The absorbance was measured at 570 nm using a microplate reader, correlating directly with living cell numbers. Data were analyzed by comparing treated and untreated cells' absorbance values to calculate the IC50 value. The IC50 value was determined by using a linear regression equation. The percentage cell viability was calculated using the below formula.9.5. PPAR-gamma transactivation assay
The activity of PPAR-γ transcription factor was evaluated with SH-SY5Y cell line nuclear extract using a sensitive ELISA-based method.47 This assay could specifically measure the DNA-binding activity of ligand-activated PPAR-γ in nuclear extracts from these cells. Following the manufacturer's protocol for the Human PPAR-γ Transcription Factor Activity Assay Kit [TFEH-PPARg-1 (Ray Biotech, GA)], we determined the activity levels of these transcription factors by quantifying the absorbance at 450 nm. In the experimental setup, SH-SY5Y cells were first exposed to the compounds under investigation. Subsequently, nuclear proteins were isolated from the treated cells using Ray Biotech's Nuclear Extraction Kit (Cat No: NE50). The extraction process involved pelleting the nuclear contents through centrifugation at 15![[thin space (1/6-em)]](https://www.rsc.org/images/entities/char_2009.gif) 000 rpm for 10 min at a temperature of 4 °C. This methodology allowed for the precise assessment of PPAR-γ transcription factor activities in response to the test compounds.48
000 rpm for 10 min at a temperature of 4 °C. This methodology allowed for the precise assessment of PPAR-γ transcription factor activities in response to the test compounds.48
9.6. Pro-inflammatory and ROS profiling in Aβ-induced SH-SY5Y cells
9.7. Molecular docking
For the molecular docking, the structures of the drug target receptor (PDB ID:3CS8)49 and compounds were prepared to mimic the in vivo environment. Both receptor and ligands were prepared using the Prepare Protein and Prepare Ligands protocol in Discovery Studio 2020. Further, the receptor binding site was defined on the current selection of the bound ligand coordinates 25.025X 1.3175Y 27.177Z for a radius of 7.9 Å and equal grid spacing of 0.5 Å with 90-degree grid angles. Molecular dynamic grid-based docking CDOCKER was used for docking the multiple compounds at the defined site of binding.50 Before docking, validation of re-docking of the native bound compound was required for parameter optimization to obtain the docked poses within 2.5 Å. Finally, all the compounds were docked to the modified CDOCKER protocol. The best pose of ligands was taken for the molecular dynamics simulation and for the non-bonded interaction analysis.9.8. Dynamics and simulation
To assess the stability and real-time behavior of the PPAR-γ docked complex dynamics, a CHARMm simulation was conducted for 50![[thin space (1/6-em)]](https://www.rsc.org/images/entities/char_2009.gif) 000 ps. The BIOVIA Discovery Studio suite was utilized, implementing the CHARMm force field parameters for four complexes, namely 4a-3CS8, 4h-3CS8, 4j-3CS8, and Std-3CS8. The protein–ligand complex systems were solvated using the TIP3 water model in an orthorhombic box and neutralized with 0.145 M NaCl. Two stages of energy minimization were performed, consisting of 500 steps each using the steepest descent and conjugate gradient algorithms. Subsequently, the system was gradually heated, equilibrated, and subjected to production under the NPT isothermal–isobaric ensemble. Temperature control was achieved using the Nose–Hoover thermostat, maintaining a temperature of 300 K, while the pressure control was set at 1.0 bar using the Langevin piston method. The dynamics Integrator employed was the Leapfrog Verlet Integrator, enabling numerical integration of the equation of motion. To assess the stability of the complex, time-dependent parameters, such as RMSD (root-mean-square deviation), RMSF, and the radius of gyration, were calculated.51,52
000 ps. The BIOVIA Discovery Studio suite was utilized, implementing the CHARMm force field parameters for four complexes, namely 4a-3CS8, 4h-3CS8, 4j-3CS8, and Std-3CS8. The protein–ligand complex systems were solvated using the TIP3 water model in an orthorhombic box and neutralized with 0.145 M NaCl. Two stages of energy minimization were performed, consisting of 500 steps each using the steepest descent and conjugate gradient algorithms. Subsequently, the system was gradually heated, equilibrated, and subjected to production under the NPT isothermal–isobaric ensemble. Temperature control was achieved using the Nose–Hoover thermostat, maintaining a temperature of 300 K, while the pressure control was set at 1.0 bar using the Langevin piston method. The dynamics Integrator employed was the Leapfrog Verlet Integrator, enabling numerical integration of the equation of motion. To assess the stability of the complex, time-dependent parameters, such as RMSD (root-mean-square deviation), RMSF, and the radius of gyration, were calculated.51,52
Abbreviations
| TLC: | Thin-layer chromatography |
| IC50: | Inhibitory concentration 50 |
| BBB: | Blood–brain barrier |
| NI: | Non-inhibitor |
| NC: | Non-carcinogen |
| NM: | Non-mutagen |
| DMSO: | Dimethyl sulfoxide |
| RO5: | Lipinski's rule of 5 |
| HBD: | Hydrogen bond donor |
| HBA: | Hydrogen bond acceptor |
| HIA: | Human intestinal absorption |
| TR-FRET: | Time-resolved fluorescence energy transfer |
| ELISA: | Enzyme-linked immunosorbent assay |
| TNF-α: | Tumor necrosis factor-alpha |
| IL-6: | Interleukin 6 |
| IL-1β: | Interleukin 1 beta |
| ROS: | Reactive oxygen species |
| RXR: | Retinoid X receptors |
Data availability
The data supporting this article have been included as part of the ESI.†Author contributions
Conceptualization, B. R. P. K. and P. D.; methodology, P. D.; software, D. S and P. D.; analysis and validation, B. R. P. K. and P. P.; resources and data curation, P. D.; writing original manuscript, P. D.; writing – review and editing, P. D., A. P.; visualization and formal analysis, B. R. P. K., U. H., N. H., S. T.; guidance, B. R. P. K.; funding acquisition, U. H., N. H., S. T.; project administration, B. R. P. K.Conflicts of interest
The authors declare no financial conflicts of interest or personal affiliations that could have influenced the research conducted in this study or any kind of conflict of interest.Acknowledgements
We are grateful to the Department of Science and Technology, New Delhi, for providing DST Women Scientist A Fellowship. All authors are also highly grateful to the JSS College of Pharmacy, JSS Academy of Higher Education and Research, Mysuru, for providing infrastructural facilities and support for this work. The authors extend their appreciation to the Deanship of scientific Research at King Khalid University for funding this research work through a large group Research Project under grant number RGP 2/150/45. This research was funded by the Department of Science and Technology, New Delhi, by providing DST Women Scientist-A Fellowship to Ms. Priya Durai (DST/WOSA/CS70/2019).References
- National Institute on Aging (NIA): https://www.nia.nih.gov/health/what-alzheimers-diseases.
- T. Wyss-Coray, Inflammation in Alzheimer disease: driving force, bystander or beneficial response?, Nat. Med., 2006, 12(9), 1005–1015, DOI:10.1038/nm1484.
- R. Kapadia, J. H. Yi and R. Vemuganti, Mechanisms of anti-inflammatory and neuroprotective actions of PPAR-gamma agonists, Front. Biosci., 2008, 13, 1813–1826, DOI:10.2741/2802.
- M. T. Heneka, M. J. Carson, J. El Khoury, G. E. Landreth, F. Brosseron, D. L. Feinstein, A. H. Jacobs, T. Wyss-Coray, J. Vitorica, R. M. Ransohoff and K. Herrup, Neuroinflammation in Alzheimer's disease, Lancet Neurol., 2015, 14(4), 388–405, DOI:10.1016/S1474-4422(15)70016-5.
- I. Steinke, M. Govindarajulu, P. D. Pinky, J. Bloemer, S. Yoo, T. Ward, T. Schaedig, T. Young, F. S. Wibowo, V. Suppiramaniam and R. H. Amin, Selective PPAR-Delta/PPAR-Gamma Activation Improves Cognition in a Model of Alzheimer's Disease, Cells, 2023, 12(8), 1116, DOI:10.3390/cells12081116.
- A. Chawla, E. J. Schwarz, D. D. Dimaculangan and M. A. Lazar, Peroxisome proliferator-activated receptor (PPAR) gamma: adipose-predominant expression and induction early in adipocyte differentiation, Endocrinology, 1994, 135(2), 798–800, DOI:10.1210/endo.135.2.8033830.
- A. Prakash and A. Kumar, Role of nuclear receptor on regulation of BDNF and neuroinflammation in hippocampus of β-amyloid animal model of Alzheimer's disease, Neurotoxic. Res., 2014, 25(4), 335–347, DOI:10.1007/s12640-013-9437-9.
- S. Ji, G. Kronenberg, M. Balkaya, K. Färber, K. Gertz, H. Kettenmann and M. Endres, Acute neuroprotection by pioglitazone after mild brain ischemia without effect on long-term outcome, Exp. Neurol., 2009, 216(2), 321–328, DOI:10.1016/j.expneurol.2008.12.007.
- M. S. Uddin, M. T. Kabir, M. S. Rahman, T. Behl, P. Jeandet, G. M. Ashraf, A. Najda, M. N. Bin-Jumah, H. R. El-Seedi and M. M. Abdel-Daim, Revisiting the Amyloid Cascade Hypothesis: From Anti-Aβ Therapeutics to Auspicious New Ways for Alzheimer's Disease, Int. J. Mol. Sci., 2020, 21(16), 5858, DOI:10.3390/ijms21165858.
- C. I. Schnegg and M. E. Robbins, Neuroprotective Mechanisms of PPARδ: Modulation of Oxidative Stress and Inflammatory Processes, PPAR Res., 2011, 2011, 373560, DOI:10.1155/2011/373560.
- S. Agarwal, A. Yadav and R. K. Chaturvedi, Peroxisome proliferator-activated receptors (PPARs) as therapeutic target in neurodegenerative disorders, Biochem. Biophys. Res. Commun., 2017, 483(4), 1166–1177, DOI:10.1016/j.bbrc.2016.08.043.
- B. R. Prashantha Kumar, A. P. Kumar, J. A. Jose, P. Prabitha, S. Yuvaraj, S. Chipurupalli, V. Jeyarani, C. Manisha, S. Banerjee, J. B. Jeyabalan, S. K. Mohankumar, S. P. Dhanabal and A. Justin, Minutes of PPAR-γ agonism and neuroprotection, Neurochem. Int., 2020, 140, 104814, DOI:10.1016/j.neuint.2020.104814.
- R. Marion-Letellier, G. Savoye and S. Ghosh, Fatty acids, eicosanoids and PPAR gamma, Eur. J. Pharmacol., 2016, 785, 44–49, DOI:10.1016/j.ejphar.2015.11.004.
- P. Kumar AP, B. R. P. Kumar, V. Jeyarani, S. P. Dhanabal and A. Justin, Glitazones, PPAR-γ and Neuroprotection, Mini-Rev. Med. Chem., 2021, 21(12), 1457–1464, DOI:10.2174/1389557521666210304112403.
- M. A. Lee, L. Tan, H. Yang, Y. G. Im and Y. J. Im, Structures of PPARγ complexed with lobeglitazone and pioglitazone reveal key determinants for the recognition of antidiabetic drugs, Sci. Rep., 2017, 7(1), 16837, DOI:10.1038/s41598-017-17082-x.
- J. Lv, S. Jiang, Z. Yang, W. Hu, Z. Wang, T. Li and Y. Yang, PGC-1α sparks the fire of neuroprotection against neurodegenerative disorders, Ageing Res. Rev., 2018, 44, 8–21, DOI:10.1016/j.arr.2018.03.004.
- B. Grygiel-Górniak, Peroxisome proliferator-activated receptors and their ligands: nutritional and clinical implications-a review, Nutr. J., 2014, 13, 17, DOI:10.1186/1475-2891-13-17.
- P. Puigserver and B. M. Spiegelman, Peroxisome proliferator-activated receptor-gamma coactivator 1 alpha (PGC-1 alpha): transcriptional coactivator and metabolic regulator, Endocr. Rev., 2003, 24(1), 78–90, DOI:10.1210/er.2002-0012.
- J. St-Pierre, S. Drori, M. Uldry, J. M. Silvaggi, J. Rhee, S. Jäger, C. Handschin, K. Zheng, J. Lin, W. Yang, D. K. Simon, R. Bachoo and B. M. Spiegelman, Suppression of reactive oxygen species and neurodegeneration by the PGC-1 transcriptional coactivators, Cell, 2006, 127(2), 397–408, DOI:10.1016/j.cell.2006.09.024.
- S. Jamwal, J. K. Blackburn and J. D. Elsworth, PPARγ/PGC1α signaling as a potential therapeutic target for mitochondrial biogenesis in neurodegenerative disorders, Pharmacol. Ther., 2021, 219, 107705, DOI:10.1016/j.pharmthera.2020.107705.
- N. F. Anjum, D. Shanmugarajan, V. K. Shivaraju, S. Faizan, N. L. Naishima, B. P. Kumar, S. Javid and M. N. Purohit, Novel derivatives of eugenol as potent anti-inflammatory agents via PPARγ agonism: Rational design, synthesis, analysis, PPARγ protein binding assay and computational studies, RSC Adv., 2022, 12(26), 16966–16978, 10.1039/D2RA02116A.
- L. Meng, X. Y. Li, L. Shen and H. F. Ji, Type 2 Diabetes Mellitus Drugs for Alzheimer's Disease: Current Evidence and Therapeutic Opportunities, Trends Mol. Med., 2020, 26(6), 597–614, DOI:10.1016/j.molmed.2020.02.002.
- J. Berger, P. Bailey, C. Biswas, C. A. Cullinan, T. W. Doebber, N. S. Hayes, R. Saperstein, R. G. Smith and M. D. Leibowitz, Thiazolidinediones produce a conformational change in peroxisomal proliferator-activated receptor-gamma: binding and activation correlate with antidiabetic actions in db/db mice, Endocrinology, 1996, 137(10), 4189–4195, DOI:10.1210/endo.137.10.8828476.
- P. Durai, N. M. Beeraka, H. V. P. Ramachandrappa, P. Krishnan, P. Gudur, N. M. Raghavendra and P. K. B. Ravanappa, Advances in PPARs Molecular Dynamics and Glitazones as a Repurposing Therapeutic Strategy through Mitochondrial Redox Dynamics against Neurodegeneration, Curr. Neuropharmacol., 2022, 20(5), 893–915, DOI:10.2174/1570159X19666211109141330.
- S. Saha, D. S. Chan, C. Y. Lee, W. Wong, L. S. New, W. K. Chui, C. W. Yap, E. C. Chan and H. K. Ho, Pyrrolidinediones reduce the toxicity of thiazolidinediones and modify their anti-diabetic and anti-cancer properties, Eur. J. Pharmacol., 2012, 697(1–3), 13–23, DOI:10.1016/j.ejphar.2012.09.021.
- S. Faizan, S. Talath, A. F. Wali, U. Hani, N. Haider, S. P. Mandal and B. P. Kumar, Anticancer potential of novel symmetrical and asymmetrical dihydropyridines against breast cancer via EGFR inhibition: molecular design, synthesis, analysis and screening, RSC Adv., 2024, 14(16), 11368–11387, 10.1039/D4RA01424C.
- https://www.3ds.com/products/biovia/databases.
- W. J. Egan, K. M. Merz and J. J. Baldwin, Prediction of Drug Absorption Using Multivariate Statistics, J. Med. Chem., 2000, 43, 3867–3877 CrossRef CAS.
- A. Cheng and K. Merz Jr, Prediction of aqueous solubility of a diverse set of compounds using quantitative structure-property relationships, J. Med. Chem., 2003, 46, 3572–3580 CrossRef CAS.
- R. G. Susnow and S. L. Dixon, Use of robust classification techniques for the prediction of human cytochrome P450 2D6 inhibition, J. Chem. Inf. Comput. Sci., 2003, 43(4), 1308–1315 CrossRef CAS PubMed.
- W. J. Egan and G. Lauri, Adv. Drug Delivery Rev., 2002, 54, 273 CrossRef CAS PubMed.
- https://jeodpp.jrc.ec.europa.eu/ftp/jrc-opendata/EURL-ECVAM/datasets.
- N. A. Meanwell, Synopsis of Some Recent Tactical Application of Bioisosteres in Drug Design, J. Med. Chem., 2011, 54(8), 2529–2591, DOI:10.1021/jm1013693.
- J. Hill, R. M. Jones and D. Crich, Discovery of a Hydroxylamine-Based Brain-Penetrant EGFR Inhibitor for Metastatic Non-Small-Cell Lung Cancer, J. Med. Chem., 2023, 66(22), 15477–15492, DOI:10.1021/acs.jmedchem.3c01669.
- S. Faizan, M. M. Mohsen, C. Amarakanth, A. Justin, R. R. Rahangdale, H. R. Chandrashekar and B. P. Kumar, Quinone scaffolds as potential therapeutic anticancer agents: Chemistry, mechanism of Actions, Structure-Activity relationships and future perspectives, Results Chem., 2024, 13, 101432, DOI:10.1016/j.rechem.2024.101432.
- S. Dhivya and C. David, Estrogen receptor potentially stable conformations from molecular dynamics as a structure-based pharmacophore model for mapping, screening, and identifying ligands-a new paradigm shift in pharmacophore screening, J. Biomol. Struct. Dyn., 2023, 41(11), 4939–4948, DOI:10.1080/07391102.2022.2074543.
- R. Guha, On exploring structure-activity relationships, Methods Mol. Biol., 2013, 993, 81–94, DOI:10.1007/978-1-62703-342-8_6.
- R. S. Basutkar, P. Sudarsan, S. M. Robin, V. Bhaskar and B. Viswanathan, Sivasankaran, Ponnusankar1,. Drug Repositioning of Pioglitazone in Management and Improving the Cognitive Function among the Patients with Mild to Moderate Alzheimer's Disease: A Systematic Review and Meta-Analysis, Neurol. India, 2023, 71(6), 1132–1141, DOI:10.4103/0028-3886.391397.
- R. Sanchez-Valle, Pioglitazone for prevention of cognitive impairment: results and lessons, Lancet Neurol., 2021, 20(7), 500–502, DOI:10.1016/S1474-4422(21)00140-X.
- J. Tran, S. Parekh, J. Rockcole, D. Wilson and M. S. Parmar, Repurposing antidiabetic drugs for Alzheimer's disease: A review of preclinical and clinical evidence and overcoming challenges, Life Sci., 2024, 20, 123001, DOI:10.1016/j.lfs.2024.123001.
- C. A. Lipinski, F. Lombardo, B. W. Dominy and P. J. Feeney, Experimental and computational approaches to estimate solubility and permeability in drug discovery and development settings, Adv. Drug Delivery Rev., 2001, 46(1–3), 3–26, DOI:10.1016/s0169-409x(00)00129-0.
- A. Justin, S. Mandal, P. Prabitha, S. Dhivya, S. Yuvaraj, P. Kabadi, S. J. Sekhar, C. H. Sandhya, A. D. Wadhwani, S. Divakar, J. J. Bharathi, P. Durai and B. R. Prashantha Kumar, Rational Design, Synthesis, and In Vitro Neuroprotective Evaluation of Novel Glitazones for PGC-1α Activation via PPAR-γ: a New Therapeutic Strategy for Neurodegenerative Disorders, Neurotoxic. Res., 2020, 37(3), 508–524, DOI:10.1007/s12640-019-00132-9.
- J. F. Glickman, X. Wu, R. Mercuri, C. Illy, B. R. Bowen, Y. He and M. Sills, A comparison of ALPHAScreen, TR-FRET, and TRF as assay methods for FXR nuclear receptors, J. Biomol. Screening, 2002, 7(1), 3–10, DOI:10.1177/108705710200700102.
- Y. Sivamani, D. Shanmugarajan, A. K. T. Durai, S. Faizan, B. Channappa, N. L. Naishima and B. R. Prashantha Kumar, A promising in silico protocol to develop novel PPARγ antagonists as potential anticancer agents: Design, synthesis and experimental validation via PPARγ protein activity and competitive binding assay, Comput. Biol. Chem., 2021, 95, 107600, DOI:10.1016/j.compbiolchem.2021.107600.
- Y. T. Mak, W. P. Lam, L. Lü, Y. W. Wong and D. T. Yew, The toxic effect of ketamine on SH-SY5Y neuroblastoma cell line and human neuron, Microsc. Res. Tech., 2010, 73(3), 195–201, DOI:10.1002/jemt.20774.
- B. Meduri, S. R. Pavan, A. Prabhu, A. H. Shankaranarayana, A. K. Sethu, M. Singh, K. G. Pujar, R. S. BC, D. Bidye and G. V. Pujar, New LPA1 receptor modulators: Design, synthesis, in-silico, and anticancer studies of triazole and oxadiazole analogs, J. Mol. Struct., 2024, 1295, 136672, DOI:10.1016/j.molstruc.2023.136672.
- A. P. Kumar, P. Prabitha, S. Mandal, B. P. Kumar, R. M. Raju, S. P. Dhanabal, K. Rajagopal, G. Rathika and A. Justin, Computational studies, synthesis, in-vitro binding and transcription analysis of novel imidazolidine-2, 4-dione and 2-thioxo thiazolidine-4-one based glitazones for central PPAR-γ agonism, J. Mol. Struct., 2023, 5, 1285, DOI:10.1016/j.molstruc.2023.135503.
- A. P. Kumar, S. Mandal, P. Prabitha, S. Faizan, B. P. Kumar, S. P. Dhanabal and A. Justin, Rational design, molecular docking, dynamic simulation, synthesis, PPAR-γ competitive binding and transcription analysis of novel glitazones, J. Mol. Struct., 2022, 5, 1265, DOI:10.1016/j.molstruc.2022.133354.
- R. T. Nolte, G. B. Wisely, S. Westin, J. E. Cobb, M. H. Lambert, R. Kurokawa, M. G. Rosenfeld, T. M. Willson, C. K. Glass and M. V. Milburn, Ligand binding and co-activator assembly of the peroxisome proliferator-activated receptor-gamma, Nature, 1998, 395(6698), 137–143, DOI:10.1038/25931.
- G. Wu, D. H. Robertson, C. L. Brooks III and M. Vieth, Detailed analysis of grid-based molecular docking: A case study of CDOCKER-A CHARMm-based MD docking algorithm, J. Comput. Chem., 2003, 24(13), 1549–1562, DOI:10.1002/jcc.10306.
- D. Shanmugarajan and C. David, Estrogen receptor potentially stable conformations from molecular dynamics as a structure-based pharmacophore model for mapping, screening, and identifying ligands-a new paradigm shift in pharmacophore screening, J. Biomol. Struct. Dyn., 2023, 41(11), 4939–4948, DOI:10.1080/07391102.2022.2074543.
- J. Tirado-Rives and W. L. Jorgensen, Contribution of conformer focusing to the uncertainty in predicting free energies for protein-ligand binding, J. Med. Chem., 2006, 49(20), 5880–5884, DOI:10.1021/jm060763i.
Footnote |
| † Electronic supplementary information (ESI) available. See DOI: https://doi.org/10.1039/d4ra06330a |
| This journal is © The Royal Society of Chemistry 2024 |

