 Open Access Article
Creative Commons Attribution 3.0 Unported Licence
Synthesis and characterization of soluble pyridinium-containing copolyimides†
Anastasiia Hubina *a,
Alina Madalina Darabutb,
Yevheniia Lobkob,
Jaromir Hnat
 a,
Jan Mernaa and
Karel Bouzeka
aUniversity of Chemistry and Technology (UCT) Prague, Technicka, 5, Prague 166 28, Czech Republic. E-mail: hubina@vscht.cz
bCharles University, Prague 180 00, Czech Republic
First published on 21st November 2024
Abstract
Novel ionene-type cationic copolyimides based on 4,4′-oxydiphthalic anhydride (ODPA), 4,4′-(1,4-phenylenediisopropylidene)bisaniline (BIS P), and 2,6-diaminopyridine (DAP) were synthesized. The copolyimides were obtained in two stages: first, the copolyimides with the 0/1, 0.2/0.8, 0.3/0.7, 0.5/0.5, 0.6/0.4 and 1/0 DAP/Bis P ratios were obtained through thermal imidization, and then quaternization of soluble copolyimides with methyl iodide was conducted for 24 or 48 h. The samples were characterized via FTIR, NMR and EDX methods to confirm their structure and composition. The cationic copolyimides with a DAP content of less than 0.3 showed initial weight loss (onset) at about 250 °C, according to TGA results and demonstrated solubility in chloroform. The highest ionic conductivity value of 0.234 S cm−1 was showed by the sample with 0.3 DAP content and 0.15 degree of quaternization. The stability of the membranes in alkaline media was evaluated using FTIR and TGA. It was shown that samples with a DAP content of more than 0.3 lost their integrity probably owing to partial hydrolysis of imide rings, while copolyimides with a DAP content of 0.2 and 0.3 remained stable.
Introduction
Hydrogen (H2) is considered a promising energy storage carrier for industrial applications, transportation and household application. Electrochemical water splitting stands out as a well-established method for generating pure H2.1–4 Among various water electrolysis (WE) technologies, anion exchange membrane water electrolysis (AEM WE) holds particular significance, although it remains mainly a laboratory technology compared to alkaline water electrolysis (AWE) and proton exchange membrane water electrolysis (PEM WE). Over the past two decades, research interest in advancing AEM WE technology has significantly increased.5–7An anion exchange membrane (AEM) represents an important part of AEM WE. To be effective, an AEM must meet specific criteria: (i) it should facilitate the efficient separation of hydrogen and oxygen produced at the electrodes, (ii) possess high ion-exchange capacity, (iii) exhibit non-permeability to electrons, and (iv) demonstrate robust mechanical stability and (v) ionic conductivity greater than 0.1 S cm−1, along with (vi) resistance to degradation in alkaline media.8–10
Polymer AEMs typically consist of a polymer backbone, which are responsible for key properties such as mechanical strength, thermal resistance, swelling behaviour, and water absorption, along with cations attached as pendant groups to the main polymer chain, contributing to ion conductivity. Considering that degradation in alkaline environments can result from both polymer chain breakdown and cation destruction, selecting a polymer with an alkali-resistant backbone is crucial.11,12
Among the polymers commonly employed in AEMs, poly(arylene ether) and poly(phenylene) are frequently utilized, alongside poly(ethylene), while block or random copolymers such as polystyrene-b-poly(ethylene/butylene)-b-polystyrene also find application.13–15 Although methods for the copolymerization of styrene with vinyl benzyl chloride with subsequent functionalization using imidazole derivatives have been reported,16 the synthesis of such types of polymers often involves the chloromethylation step, followed by quaternization. However, chloromethylation encounters a significant obstacle due to the carcinogenic properties of conventional chloromethylating agents.17 In this regard, one of the more appealing alternatives involves post-polymerization quaternization of polymers containing either tertiary amines or nitrogen-containing heterocyclic fragments in the main chain.
Nevertheless, polymers for AEMs are not only those with cationic functional groups attached to the pendant chain but also those with charges embedded within the polymer backbone.18 Recent studies, such as19 those dealing with the influence of ion positioning on both ionic conductivity and stability, have unveiled that ionene-type polymers demonstrate higher conductivity and prolonged alkaline stability comparing to ionomers, which bear cation in pendants.20–22
Aromatic polyimides (PIs) are renowned for their exceptional thermal stability, resistance to solvents, and mechanical strength.23–26 Recently, polyimide-based ionenes gained considerable attention as promising polymers for use as AEMs in various processes, including electrodialysis, fuel cells, and electrolyzers. For instance, in a study,27 imidazolium-containing polyimide ionene has been reported, and pyridinium-containing polyimides were developed.28 It is well known that pyridinium exhibits lower stability in alkaline media than trimethyl ammonium or imidazolium29,30 due to the hydroxide attack on the ortho position and the resulting loss of positive charges, which are needed for the transport of hydroxide anions. However, pyridinium-containing polymer AEMs show rather high alkaline stability when the ortho position (2,6) of pyridine is occupied, thus preventing the OH− attack.31–33
To our knowledge, pyridinium-containing coPIs have been synthesized for electrodialysis application but have not been prepared for application in membrane alkaline water electrolysis. This work aims to synthesize soluble polyimide-based ionenes for AEM WE containing pyridinium in the main chain by the postpolymerization quaternization of pyridine-containing coPIs. To overcome in general the poor solubility of aromatic PIs in organic solvents, we choose the monomer with methyl substituents, which after introduction into the backbone can enhance the solubility of PI, as shown in a previous report.34 To synthesize soluble coPI, we initially selected a polyimide based on 4,4′-oxydiphthalic anhydride (ODPA) and 4,4′-(1,4-phenylenediisopropylidene)bisaniline (BIS P), which was reported to possess excellent thermal and mechanical properties and solubility in chloroform35 as well as outstanding film-forming ability. In this study, we synthesized a series of copolyimides with different contents of 2,6-diaminopyridine, which were then quaternized to obtain anion exchange membranes. The obtained polyimides were then quaternized and evaluated with respect to their thermal properties, alkaline stability, and ion conductivity.
Experimental
Materials
4,4′-Oxydiphthalic anhydride (ODPA) was purchased from Sigma Aldrich and dried in vacuum at 160 °C for 5 h before use. Bisaniline P (BIS P, 4,4′-(1,4-phenylenediisopropylidene)bisaniline) (Mitsui PI), 2,6-diaminopyridine (DAP), methyl iodide, and N-methyl-2-pyrrolidone (NMP) were purchased from Merck, while dimethylformamide (DMF) and diethyl ether were purchased from Lachner and used as received.Synthesis
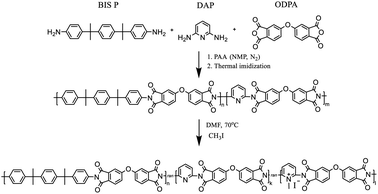
PIs and random coPIs were synthesized in two stages (Scheme 1).First, the dianhydride (ODPA) (2 g, 6.4 mmol) was reacted with either BIS P, DAP or their mixture in NMP under N2 atmosphere, which resulted in the formation of the corresponding polyamic acid (PAA) solution in NMP. Samples with the following molar ratio of components were prepared: ODPA![[thin space (1/6-em)]](https://www.rsc.org/images/entities/char_2009.gif) :
:![[thin space (1/6-em)]](https://www.rsc.org/images/entities/char_2009.gif) BIS P
BIS P![[thin space (1/6-em)]](https://www.rsc.org/images/entities/char_2009.gif) :
:![[thin space (1/6-em)]](https://www.rsc.org/images/entities/char_2009.gif) DAP as 1
DAP as 1![[thin space (1/6-em)]](https://www.rsc.org/images/entities/char_2009.gif) :
:![[thin space (1/6-em)]](https://www.rsc.org/images/entities/char_2009.gif) 1
1![[thin space (1/6-em)]](https://www.rsc.org/images/entities/char_2009.gif) :
:![[thin space (1/6-em)]](https://www.rsc.org/images/entities/char_2009.gif) 0; 1
0; 1![[thin space (1/6-em)]](https://www.rsc.org/images/entities/char_2009.gif) :
:![[thin space (1/6-em)]](https://www.rsc.org/images/entities/char_2009.gif) 0, 8
0, 8![[thin space (1/6-em)]](https://www.rsc.org/images/entities/char_2009.gif) :
:![[thin space (1/6-em)]](https://www.rsc.org/images/entities/char_2009.gif) 0, 2; 1
0, 2; 1![[thin space (1/6-em)]](https://www.rsc.org/images/entities/char_2009.gif) :
:![[thin space (1/6-em)]](https://www.rsc.org/images/entities/char_2009.gif) 0, 7
0, 7![[thin space (1/6-em)]](https://www.rsc.org/images/entities/char_2009.gif) :
:![[thin space (1/6-em)]](https://www.rsc.org/images/entities/char_2009.gif) 0, 3; 1
0, 3; 1![[thin space (1/6-em)]](https://www.rsc.org/images/entities/char_2009.gif) :
:![[thin space (1/6-em)]](https://www.rsc.org/images/entities/char_2009.gif) 0, 5
0, 5![[thin space (1/6-em)]](https://www.rsc.org/images/entities/char_2009.gif) :
:![[thin space (1/6-em)]](https://www.rsc.org/images/entities/char_2009.gif) 0, 5; 1
0, 5; 1![[thin space (1/6-em)]](https://www.rsc.org/images/entities/char_2009.gif) :
:![[thin space (1/6-em)]](https://www.rsc.org/images/entities/char_2009.gif) 0, 4
0, 4![[thin space (1/6-em)]](https://www.rsc.org/images/entities/char_2009.gif) :
:![[thin space (1/6-em)]](https://www.rsc.org/images/entities/char_2009.gif) 0, 6. The resulting 10 w/w% solution was stirred under an inert atmosphere (N2) for 12 h. After this period, the PAA was cast on the glass substrate, and during the second stage, thermal imidization was fulfilled according to the procedure: 60 °C – 24 h, 100 °C – 1 h, 150 °C – 1 h, 200 °C – 1 h, 250 °C – 0.5 h. The coPIs obtained were DAP-0, DAP-0.2, DAP-0.3, DAP-0.5, DAP-0.6, where 0, 0.2, 0.3, 0.5 and 0.6 correspond to the pyridine content. Soluble coPIs (0.5 g) were redissolved in DMF (20 mL) on heating, then excess of methyl iodide (20 eq.) was added. The reaction mixture was refluxed at 70 °C for 24 h or 48 h, then precipitated in diethyl ether, filtered off, washed with diethyl ether, and dried. Different reflux times were used in order to evaluate the influence of the reaction time on the degree of quaternization (DQ). The following samples of modified coPIs were synthesized: DAP-0.2Q, DAP-0.3Q, DAP-0.5Q (after 24 h) and DAP-0.2Q2, DAP-0.3Q2 (after 48 h). The membranes were cast on a glass substrate from the solution of the polymer in CHCl3.
0, 6. The resulting 10 w/w% solution was stirred under an inert atmosphere (N2) for 12 h. After this period, the PAA was cast on the glass substrate, and during the second stage, thermal imidization was fulfilled according to the procedure: 60 °C – 24 h, 100 °C – 1 h, 150 °C – 1 h, 200 °C – 1 h, 250 °C – 0.5 h. The coPIs obtained were DAP-0, DAP-0.2, DAP-0.3, DAP-0.5, DAP-0.6, where 0, 0.2, 0.3, 0.5 and 0.6 correspond to the pyridine content. Soluble coPIs (0.5 g) were redissolved in DMF (20 mL) on heating, then excess of methyl iodide (20 eq.) was added. The reaction mixture was refluxed at 70 °C for 24 h or 48 h, then precipitated in diethyl ether, filtered off, washed with diethyl ether, and dried. Different reflux times were used in order to evaluate the influence of the reaction time on the degree of quaternization (DQ). The following samples of modified coPIs were synthesized: DAP-0.2Q, DAP-0.3Q, DAP-0.5Q (after 24 h) and DAP-0.2Q2, DAP-0.3Q2 (after 48 h). The membranes were cast on a glass substrate from the solution of the polymer in CHCl3.
Characterization
The 1H NMR spectra of the polymers were measured on a 500 MHz Bruker Avance 500 spectrometer in CDCl3 at 25 °C. The FTIR spectra were recorded with the help of a Nicolet 6700 FTIR-spectrometer (Thermo-Nicolet) in the ATR mode (wavenumber range 4000–600 cm−1). DSC analyses were performed on a TA Instruments (Discovery DSC250 auto) calorimeter. The temperature range was from 20 °C to 400 °C, temperature rate was 10 °C min−1 and N2 flow rate was 50 mL min−1. The curves from the second heating run were analyzed. TGA measurements were performed on a TA Instruments TGA550 Auto Advanced with a heating rate of 10 °C min−1 in N2 atmosphere. Scanning electron microscopy (SEM) images were taken using a MIRA 3 (Tescan GmbH, Czech Republic) microscope operating at 10 keV. The SEM images of the surface and cross-section of the membrane were obtained. The cross-section was prepared by cutting the membrane perpendicularly to its edge with a blade to prevent mechanical deformation. To improve the image quality and reduce the charging effects, a 6 nm layer of platinum was sputtered onto the sample surface using a Kurt-Lesker magnetron sputtering system. Chemical composition mapping analysis was carried out using energy-dispersive X-ray spectroscopy (EDX) with a Bruker XFlash detector mounted directly into the SEM, with electron beam energy of 10 keV. The calculation of the elemental compositions was based on the measurements taken from five scans at five different places of the samples. The solubility of all PIs was tested qualitatively in various solvents (approximately 10 mg/5 mL).Ion conductivity was evaluated using the electrochemical impedance spectroscopy method. LCR bridge Hameg HM8118 was used to accomplish this task. The frequency of the perturbing signal was in the range of 200 kHz to 20 Hz. The maximal amplitude of the perturbing signal was 50 mV. The resistance of the membrane sample was determined in two-electrode arrangement in the through plane direction. Mercury was used for contacting the surface of the membrane and Pt wires immersed in mercury were used to deliver the perturbing signal. The resistance of the membrane was measured in the OH− form and at laboratory temperature (24 °C). The membrane was transferred to OH− form by storing the sample in 0.1 M NaOH at room temperature for 10 days. The resistance of the membrane was evaluated from the Nyquist diagram as the cross section of the measured points with x-axis. The ion conductivity σ (S m−1) was evaluated following the equation σ = l/(R × S), where l stands for the thickness of the membrane (m), R represent the membrane resistance (Ω) and S is the geometrical surface of the membrane (1.57 × 10⁻⁵ m).
Results and discussion
Synthesis and characterization of (co)polyimides
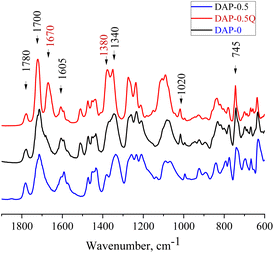
To prove the complete imidization of all the prepared coPIs, FTIR analysis was used (Fig. 1). The characteristic absorption bands of the imide group are observed at about 1700 and 1780 cm−1 (symmetric and asymmetric stretching of the ring carbonyl groups), the bands at 1020 and 745 cm−1 correspond to imide ring deformation, and 1340 cm−1 (stretching of the ring C–N bond), whereas the absorption band in the region of 1650 cm−1 corresponding to the amide bond of the corresponding PAAs is absent in the spectra of the PI and coPIs, which demonstrates the full imidization. With the growth of pyridine content in the coPI, an increase in the intensity of the bands at 1591 and 1450 cm−1 was observed (C![[double bond, length as m-dash]](https://www.rsc.org/images/entities/char_e001.gif) N and C–N pyridine ring stretching). In the spectra of the quaternized samples, a new peak was observed at 1670 cm−1, which corresponds to the C
N and C–N pyridine ring stretching). In the spectra of the quaternized samples, a new peak was observed at 1670 cm−1, which corresponds to the C![[double bond, length as m-dash]](https://www.rsc.org/images/entities/char_e001.gif) N+ stretching vibration.31,32,36
N+ stretching vibration.31,32,36
The experimental BIS P/DAP ratio in the synthesized coPIs was evaluated using 1H NMR spectra.
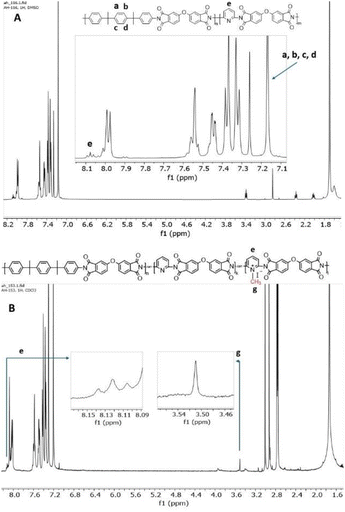
The content of BIS P and DAP was calculated from 1H NMR by integrating the signal of 4 protons of BIS P I(a,b,c,d) and the proton in the para position in the pyridine ring I(e) (Fig. 2A) as follows: DAP![[thin space (1/6-em)]](https://www.rsc.org/images/entities/char_2009.gif) :
:![[thin space (1/6-em)]](https://www.rsc.org/images/entities/char_2009.gif) BIS P = I(e)/1H
BIS P = I(e)/1H![[thin space (1/6-em)]](https://www.rsc.org/images/entities/char_2009.gif) :
:![[thin space (1/6-em)]](https://www.rsc.org/images/entities/char_2009.gif) I(a,b,c,d)/4H. The calculation confirmed the successful synthesis, providing products of the desired composition (Table S1†).
I(a,b,c,d)/4H. The calculation confirmed the successful synthesis, providing products of the desired composition (Table S1†).
One of the aims of this research was to develop charged coPIs that could form films (membranes) from the solution of volatile organic solvent. Thus, the solubility of the obtained quaternized copolyimides (coPI-Qs or DAP-Qs) was investigated (see Table 1). With the increase in the pyridine content, the solubility of the samples decreases.
| Sample | CHCl3 | CH2Cl2 | NMP | DMF | DMSO | CH3CN |
|---|---|---|---|---|---|---|
| a “+” – Soluble, “+/−” – partially soluble, “−” – insoluble, and “+*” – soluble after heating up to 40 °C. | ||||||
| DAP-0.6 | — | — | — | — | — | — |
| DAP-0.5 | + | — | + | +* | — | — |
| DAP-0.3 | + | + | + | +* | — | — |
| DAP-0.2 | + | + | + | +* | — | — |
| DAP-0 | + | + | — | — | — | — |
| DAP-0.2Q | + | +/− | + | +* | +/− | — |
| DAP-0.3Q | + | +/− | + | +* | +/− | +/− |
| DAP-0.5Q | +/− | +/− | + | +* | +/− | +/− |
The coPIs with DAP content >50% (DAP-0.6) are brittle insoluble films. Thus, for modification, the samples with lower content of pyridine were chosen, namely, DAP-0.2, DAP-0.3, and DAP-0.5.
After quaternization, all the synthesized DAP-Qs demonstrated solubility in NMP. However, the films cast from NMP were non-transparent and fragile, containing the residual solvent even after solvent removal treatment. The DAP-Qs were also tested for solubility in chloroform, and it was shown that only DAP-Qs with the content of DAP below 30% were soluble and could form the film. In case of DAP-0.5Q, the small fragments of coPI-Q remained insoluble; thus, for this sample, the solution was filtered prior to casting. For these reasons, chloroform was selected as the appropriate solvent. The membranes were cast from the chloroform solution on the glass substrate and kept overnight in a chamber with chloroform vapours in order to allow them to dry slowly, thus avoiding the formation of the pores.
Degree of quaternization and charge distribution
For samples soluble in chloroform, namely, DAP-0.2Q, DAP-0.3Q (reaction time 24 h), DAP-0.2Q2 and DAP-0.3Q2 (reaction time 48 h), the degree of quaternization (DQ) was calculated from the 1H NMR spectra as follows: DQ = (Ig/3)/(Ie + Ig/3), where e is the proton in the para position in the pyridine ring and g are three protons of the methyl group attached to pyridinium nitrogen, and Ig/3 is the proton in the para position of pyridinium; thus, (Ie + Ig/3) is the total amount of para protons both in pyridine and in pyridinium (Fig. 2B).33 The results are given in Table 2.| Sample | Iodine at% theoretical | Iodine at% EDX | DQ (EDX) | DQ (NMR) | Ionic conductivity, S m−1 |
|---|---|---|---|---|---|
| DAP-0.2Q | 3.8 | 0.44 | 0.11 | 0.10 | 1.2 × 10⁻³ |
| DAP-0.3Q | 5.9 | 0.75 | 0.12 | 0.12 | 1.7 × 10⁻³ |
| DAP-0.5Q | 10.0 | 2.26 | 0.22 | n/a | n/a |
| DAP-0.2Q2 | 3.8 | 0.59 | 0.15 | 0.15 | 1.8 × 10⁻³ |
| DAP-0.3Q2 | 5.9 | 0.96 | 0.16 | 0.15 | 23.4 × 10⁻³ |
DQ was also evaluated from the data obtained by means of energy-dispersive X-ray spectroscopy (EDX). As a reference element, iodine was taken, which is absent in the initial coPIs and present in the coPI-Qs in the form of iodide ion as the counter ion of pyridinium. The theoretically calculated atomic percentage of iodine in the samples in the case of 100% conversion of pyridine to pyridinium and the iodine amount experimentally obtained via EDX are presented in Table 2 as well as the calculated DQ of pyridine groups.
Both methods show almost the same results. It could be seen that the DQ slightly increases with the pyridine content in coPIs and the reaction time. However, the DQ for all the samples is rather moderate, which can be explained by the tangled access of the quaternizing agent to the reaction centres caused by the low flexibility of the rigid pyridine-containing fragments.
The distribution of the charge (cations) in the polymer was evaluated by the elemental mapping of iodine using energy-dispersive X-ray spectroscopy (EDX).
Fig. 3 demonstrates the homogeneous distribution of the iodine atoms in the bulk of modified coPIs, indicating uniform charge distribution throughout the polymer.
 | ||
| Fig. 3 Energy dispersive X-ray spectroscopy elemental maps of iodine in DAP-0.3 (A), DAP-0.2Q (B), DAP-0.3Q (C), and DAP-0.5Q (D). | ||
Both methods reveal that DQ grows both with the increase in the pyridine content and reaction time.
Thermal properties of coPIs and modified coPIs
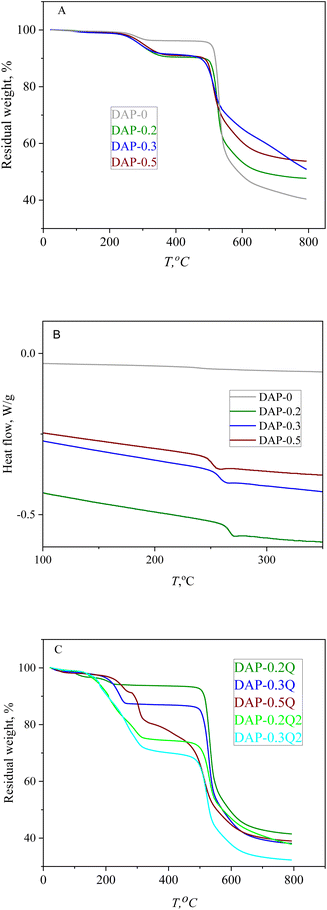
The thermal properties of coPIs and modified coPIs were explored by means of TGA and DSC. The graphs of the thermal degradation of the coPIs and modified coPIs are given in Fig. 4.10% loss of the weight (TD10 in Table 3) occurs at 480 °C for all the coPIs. The weight loss between 200 and 300 °C can be the result of the evaporation of the residual solvent (the residual NMP is present in the NMR of the coPIs) and/or eventually incomplete imidization.37
| Sample | TD10, °C | T1st, wt% | IEDX wt% | Tg, °C |
|---|---|---|---|---|
| DAP-0 | 518 | — | — | 242 |
| DAP-0.2 | 482 | — | — | 265 |
| DAP-0.3 | 492 | — | — | 257 |
| DAP-0.5 | 484 | — | — | 251 |
| DAP-0.2Q | 514 | 6 | 3, 9 | n/a |
| DAP-0.3Q | 245 | 12 | 7, 2 | n/a |
| DAP-0.5Q | 291 | 20 | 17, 3 | n/a |
| DAP-0.2Q2 | 208 | 24 | 5, 03 | n/a |
| DAP-0.3Q2 | 205 | 27 | 8, 47 | n/a |
Modified coPIs do not show noticeable weight loss up to 200 °C, then the first stage weight loss from 10 to 20% is observed in the temperature range of 200–300 °C, and the lower temperature of the weight loss can be explained by the weaker intermolecular interactions of the coPI-Q. The main weight loss stage for all the modified samples starts at about 500 °C and is similar to that of coPIs. The thermal stability of the pyridinium-containing polymers is highly dependent on the counter-ion nature, and often the earlier degradation is induced by the counter-ion at a much lower temperature than that required for backbone decomposition. For the modified coPIs, the first stage of weight loss at about 250 °C is similar for the DAP-0.2Q sample, but with the increase in the pyridinium content, the weight loss increases respectively due to the probable loss of iodide anions.38,39 The weight loss at the first stage of thermal degradation correlates with the iodine content according to the EDX data (T1st and IEDX columns in Table 3). The modified coPIs do not undergo thermal degradation at 100 °C, which is important for their performance in AEM WE with working temperature of about 80 °C.
All the coPIs demonstrate higher Tg then DAP-0. It can be the result of the incorporation of the “rigid” pyridine fragments into the backbone. At the same time, Tg decreases for the range of coPIs DAP-0.2 > DAP-0.3 > DAP-0.5 with the growth of pyridine content. Considering that the thermal degradation of the modified coPIs starts at about 200 °C, the Tg value for the modified coPIs was not obtained.
Morphology
The morphology of the coPI films and modified coPI membranes was investigated by SEM both on the surface and at the cross section.All samples are dense films. Both surface and cross section SEM images (Fig. 5) reveal the absence of pores and scratches caused by solvent evaporation. Some pore-like structures are visible for the DAP-0.5Q sample in Fig. 5C, but this is not confirmed by the cross-sectional image. This indicates that the pore-like structures are not connected and their occurrence is probably connected with solvent evaporation. From the cross-sectional images, it is also possible to see that the modified coPIs are structured into layers. Probably, this structure is achieved due to slow solvent removal.
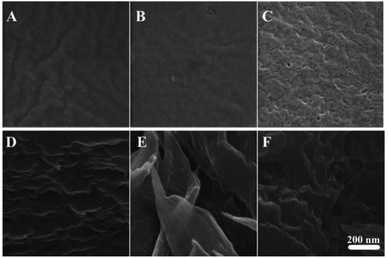 | ||
| Fig. 5 SEM images of the surface (A–C) and cross-section (D–F) of DAP-0.2Q (A and D), DAP-0.3Q (B and E), and DAP-0.5Q (C and F). | ||
Alkaline stability and ionic conductivity
Before measuring the conductivity of the DAP-Qs, the 1 × 1 cm2 membrane samples were immersed into 0.1 M NaOH solution for 10 days at 24 °C. Then, the conductivity of the samples was measured and afterwards the samples were characterized by FTIR and TGA. After exposure to 0.1 M NaOH, DAP-0.5Q lost its integrity while DAP-0.2Q, DAP-0.3Q, DAP-0.2Q2 and DAP-0.3Q2 retained their shape. The ionic conductivities of DAP-0.2Q, DAP-0.3Q, DAP-0.2Q2 and DAP-0.3Q2 were 1.2 × 10⁻³, 1.7 × 10⁻³, 1.8 × 10⁻³ and 23.4 × 10⁻³ S m−1, respectively (see Table 2). Generally, the values of ionic conductivity are relatively low, which is in agreement with the low content of the functional groups and DQ. On the other hand, despite the low DQ, the achieved values of ionic conductivity indicate the formation of the transport channels. It can thus be expected that DQ will increase the ionic conductivity significantly.DAP-0.3Q2 exhibits the highest ionic conductivity among the samples. This is likely due to its relatively high pyridine content and increased DQ, and as a result, the formation of more cationic centres, reaching the percolation level and thus interconnecting individual conductive domains. However, increasing the pyridine content also results in the insolubility of coPI, fragility of films formed from solvents like NMP, and alkaline instability, as demonstrated by DAP-0.5Q. Therefore, to further enhance the ionic conductivity, achieving higher DQs for the DAP-0.3 sample is essential. Regarding the postpolymerization modification approach used in this research to synthesize coPI-Q, the most straightforward method to increase DQ would be to extend the reaction time. As shown in Table 3, for DAP-0.2, extending the reaction time from 24 hours to 48 hours increases the DQ from 0.10 to 0.15. However, for DAP-0.3, the increase is less significant, rising from 0.12 to 0.15 over the same period. Thus, enhancing the DQ for DAP-0.3 requires a more complex approach and further research.
The chemical structure and thermal properties of coPI-Qs after alkaline treatment were investigated via FTIR and TGA. In the FTIR spectra (Fig. 6), changes are observed at 1700 and 1780 cm−1 (stretching of the ring carbonyl groups), as well as at 1020 and 745 cm−1, which are attributed to the imide ring. For the sample DAP-0.5Q, these bands are absent in the FTIR spectrum, which shows the degradation of the polymer backbone. DAP-0.2Q and DAP-0.3Q preserve all the bands attributed to PI. Similar behaviour is observed for DAP-0.2Q2 and DAP-0.3Q2 in Fig. 6B.
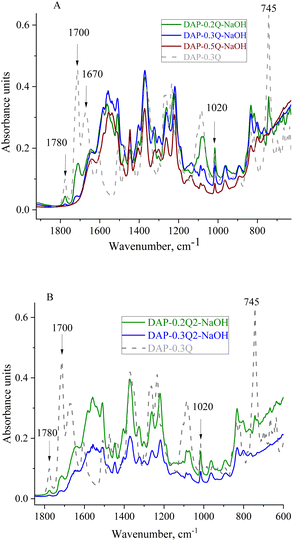 | ||
| Fig. 6 FTIR spectra of DAP-0.3Q against DAP-Qs after exposure to 0.1 M NAOH solution (A) and DAP-0.3Q against DAP-Q2s (B). | ||
For all the samples, the band at 1670 cm−1 disappeared but the band at 1640 cm−1 appeared. This band can be observed in the spectra of all the samples and can be attributed to pyridinium against OH− as the counter ion or carboxyl group formed as a result of PI backbone destruction.40 Regarding these possibilities, TGA of the membranes was performed.
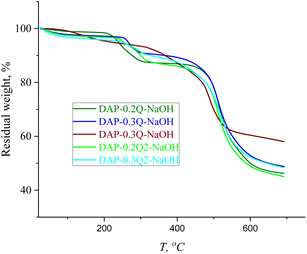
In the TGA curves in Fig. 7, there are two main stages of weight loss: the first stage can be caused by the loss of absorbed water (up to 150 °C), followed by the degradation of pyridinium hydroxide with the maximum weight loss at 250 °C,41 while the second stage at 460 °C is the common stage for all the PIs and coPI-Qs (Fig. 4C), which confirms that DAP-0.2Q, DAP-0.3Q, DAP-0.2Q2 and DAP-0.3Q2 probably did not undergo polyimide backbone degradation.
Conclusions
Cationic coPIs with 2,6-protected pyridinium fragments in the main chain were synthesized by two-stage thermal imidization, followed by postpolymerization modification. The obtained coPIs with the content of pyridinium up to 30% were able to form dense layered membranes from chloroform solution. The obtained coPI-Qs showed no significant weight loss up to 200 °C. The increase in the pyridine content over 30% leads to the disintegration of the polymer backbone in alkaline medium even at low NaOH concentration. Relatively low conductivity of DAP-0.2Q, DAP-0.3Q, DAP-0.2Q2 and DAP-0.3Q2 can be the result of the low degree of substitution and low content of cations. This statement is partially confirmed by the increase in the conductivity of the DAP-0.3Q2 of about 0.234 S cm−1, which has the highest pyridine content and the highest conductivity value among all the studied samples. The possible way to increase the degree of substitution is to facilitate the access to the pyridine in the backbone by increasing the flexibility of the chain. This can be achieved using a pyridine-containing monomer with flexible spacers in the 2,6 positions.Data availability
The data supporting this article have been included as part of the ESI.† Data for this article are available at Zenodo at https://zenodo.org/records/13384465.Author contributions
Anastasiia Hubina – visualization conceptualization, methodology, investigation, writing – original draft, Alina Madalina Darabut – investigation, Yevheniia Lobko – investigation, Jaromir Hnat – methodology, investigation, data curation, writing – review & editing, Jan Merna – investigation, writing – review & editing, Karel Bouzek – writing – review & editing.Conflicts of interest
There are no conflicts to declare.Acknowledgements
The authors thank prof. P. Sysel for the advice and discussion of the experimental part and results. This work was supported through the MSCA4Ukraine project, which is funded by the European Union (Grant number 1232813) and the project “The Energy Conversion and Storage” No. CZ.02.01.01/00/22_008/0004617 by Programme Johannes Amos Comenius, call Excellent Research.References
- J. R. Varcoe, P. Atanassov, D. R. Dekel, A. M. Herring, M. A. Hickner, P. A. Kohl, A. R. Kucernak, W. E. Mustain, K. Nijmeijer, K. Scott, T. Xu and L. Zhuang, Energy Environ. Sci., 2014, 7, 3135–3191 RSC.
- H. A. Miller, K. Bouzek, J. Hnat, S. Loos, C. I. Bernäcker, T. Weißgärber, L. Röntzsch and J. Meier-Haack, Sustainable Energy Fuels, 2020, 4, 2114–2133 RSC.
- P. E. Dodds, I. Staffell, A. D. Hawkes, F. Li, P. Grünewald, W. McDowall and P. Ekins, Int. J. Hydrogen Energy, 2015, 40, 2065–2083 CrossRef CAS.
- C. Li and J. B. Baek, Nano Energy, 2021, 87, 106162 CrossRef CAS.
- N. Du, C. Roy, R. Peach, M. Turnbull, S. Thiele and C. Bock, Chem. Rev., 2022, 122, 11830–11895 CrossRef CAS PubMed.
- P. Mardle, B. Chen and S. Holdcroft, ACS Energy Lett., 2023, 8, 3330–3342 CrossRef CAS.
- A. Y. Faid, L. Xie, A. O. Barnett, F. Seland, D. Kirk and S. Sunde, Int. J. Hydrogen Energy, 2020, 45, 28272–28284 CrossRef CAS.
- A. W. Tricker, J. K. Lee, J. R. Shin, N. Danilovic, A. Z. Weber and X. Peng, J. Power Sources, 2023, 567, 232967 CrossRef CAS.
- K. F. L. Hagesteijn, S. Jiang and B. P. Ladewig, J. Mater. Sci., 2018, 53, 11131–11150 CrossRef CAS.
- A. Vöge, V. Deimede and J. K. Kallitsis, RSC Adv., 2014, 4, 45040–45049 RSC.
- W. K. Ng, W. Y. Wong, N. A. H. Rosli and K. S. Loh, Separations, 2023, 10, 424 CrossRef CAS.
- L. Liu, H. Ma, M. Khan and B. S. Hsiao, Membranes., 2024, 14, 85 CrossRef CAS PubMed.
- W. H. Lee, E. J. Park, J. Han, D. W. Shin, Y. S. Kim and C. Bae, ACS Macro Lett., 2017, 6, 566–570 CrossRef CAS PubMed.
- M. I. Khan, X. Li, J. Fernandez-Garcia, M. H. Lashari, A. Ur Rehman, N. Elboughdiri, L. Kolsi and D. Ghernaout, ACS Omega, 2021, 6, 7994–8001 CrossRef CAS PubMed.
- H. S. Dang and P. Jannasch, J. Mater. Chem. A, 2017, 5, 21965–21978 RSC.
- J. J. Kaczur, H. Yang, Z. Liu, S. D. Sajjad and R. I. Masel, Front. Chem., 2018, 6, 263 CrossRef PubMed.
- G. Wang, Y. Weng, D. Chu, D. Xie and R. Chen, J. Membr. Sci., 2009, 326, 4–8 CrossRef CAS.
- W. You, K. J. T. Noonan and G. W. Coates, Prog. Polym. Sci., 2020, 100, 101177 CrossRef CAS.
- C. M. Evans, C. R. Bridges, G. E. Sanoja, J. Bartels and R. A. Segalman, ACS Macro Lett., 2016, 5, 925–930 CrossRef CAS PubMed.
- S. R. Williams and T. E. Long, Prog. Polym. Sci., 2009, 34, 762–782 CrossRef CAS.
- J. S. Lee, A. Hockena and M. D. Green, Mol. Syst. Des. Eng., 2021, 6, 334–354 RSC.
- A. G. Wright and S. Holdcroft, ACS Macro Lett., 2014, 3, 444–447 CrossRef CAS PubMed.
- R. Pariser, Polyimides: Versatile Specialty Polymers, 1987, vol. 19 Search PubMed.
- Z. Xu, Z. L. Croft, D. Guo, K. Cao and G. Liu, J. Polym. Sci., 2021, 59, 943–962 CrossRef CAS.
- Y. Zhuang, J. G. Seong and Y. M. Lee, Prog. Polym. Sci., 2019, 92, 35–88 CrossRef CAS.
- Z. Xu, Z. L. Croft, D. Guo, K. Cao and G. Liu, J. Polym. Sci., 2021, 59, 943–962 CrossRef CAS.
- I. Kammakakam, K. E. O'Harra, J. E. Bara and E. M. Jackson, Macromolecules, 2022, 55, 4790–4802 CrossRef CAS.
- X. Sun, Y.-K. Yang and F. Lu, Novel Polyimide Ionene: Synthesis and Characterization of Polyamidescontaining Aromatic Bipyridinium Salt, 1997, vol. 38 Search PubMed.
- Z. Zakaria and S. K. Kamarudin, Int. J. Energy Res., 2021, 45, 18337–18354 CrossRef CAS.
- K. F. L. Hagesteijn, S. Jiang and B. P. Ladewig, J. Mater. Sci., 2018, 53, 11131–11150 CrossRef CAS.
- S. Ayaz, Z. Y. Yao, Y. Yang and H. Y. Yu, J. Membr. Sci., 2023, 680, 121736 CrossRef CAS.
- A. Vöge, V. Deimede and J. K. Kallitsis, RSC Adv., 2014, 4, 45040–45049 RSC.
- A. Vöge, V. Deimede and J. K. Kallitsis, RSC Adv., 2014, 4, 45040–45049 RSC.
- W. Dong, Y. Guan and D. Shang, RSC Adv., 2016, 6, 21662–21671 RSC.
- E. Minko, P. Sysel, M. Hauf, J. Brus and L. Kobera, Macromol. Symp., 2010, 295, 88–93 CrossRef CAS.
- I. C. Kim and T. M. Tak, Macromolecules, 2000, 33, 2391–2396 CrossRef CAS.
- G. A. Koohmareh and N. Mohammadifard, J. Polym. Res., 2011, 18, 983–991 CrossRef CAS.
- A. Vollas, T. Chouliaras, V. Deimede, T. Ioannides and J. Kallitsis, Polymers, 2018, 10, 913 CrossRef PubMed.
- E. M. Maya, E. Verde-Sesto, D. Mantione, M. Iglesias and D. Mecerreyes, Eur. Polym. J., 2019, 110, 107–113 CrossRef CAS.
- T. Honma and T. Sato, J. Supercrit. Fluids, 2020, 166, 105037 CrossRef CAS.
- Y. Xu, C. Zhao, S. Huang, Y. Gan, L. Xiong, J. Zhou and H. Liang, Int. J. Hydrogen Energy, 2022, 47, 6097–6110 CrossRef CAS.
Footnote |
| † Electronic supplementary information (ESI) available. See DOI: https://doi.org/10.1039/d4ra06443g |
| This journal is © The Royal Society of Chemistry 2024 |

