 Open Access Article
Co-deposition of Ni–Mo alloy film catalysts for hydrogen evolution from an ethylene glycol system
Xinkuai He,
Yiren Li,
Jingjing Yang,
Genfa Zeng and
Luye Wu *
*
School of Packaging and Materials Engineering, Hunan University of Technology, Zhuzhou 412007, PR China. E-mail: lyxk999@163.com; Fax: +86 731 22182168; Tel: +86 731 22182088
First published on 28th October 2024
Abstract
Owing to the depletion of renewable energy sources, manufacturing stable, efficient and economical non-noble electrode materials for the hydrogen evolution reaction (HER) through electrochemical water splitting is a promising avenue. In this work, Ni–Mo alloy films containing different Mo concentrations were synthesized via potentiostatic technique, and the mechanism of Ni2+ and Mo6+ co-deposition in an ethylene glycol system (EG) was recorded. The co-deposition mechanism of Mo6+ and Ni2+ in the EG shows that the existence of Ni2+ can facilitate the reduction of Mo6+, while Mo6+ can impede the reduction of Ni2+. Furthermore, both functions could be reinforced owing to the improved content of Ni2+ and Mo6+ in the EG system. Ni–Mo alloy films containing different Mo concentrations could be obtained from the EG solution, and their microstructures could be changed by changing the Mo content. Scanning electron microscopy micrographs exhibit that Ni–Mo alloy films with 10.84 wt% Mo show a cauliflower-like pattern. Benefiting from the alloying technique to modify the Ni electronic structure with Mo, coupled with the concurrent presence of an appropriate cauliflower-like structure, Ni–Mo alloy films with 10.84 wt% Mo show remarkable catalytic activity and durability with an HER overpotential of 74 mV (η10, overpotential was recorded at j = 10 mA cm−2) in 1.0 M KOH solution.
1 Introduction
At present, economic development is still dependent on the massive application of fossil fuel, such as coal, petroleum, and natural gas. Nevertheless, potential crises, including the immense lack of fossil energy and environmental problems resulting from the huge consumption of carbon-based fossil fuel, are becoming increasingly serious.1 Owing to its high calorific value and environment friendliness, hydrogen has been considered a viable energy carrier that will supersede these fossil fuels in the future.2 Thus, the development of low-cost, efficient, and sustainable hydrogen production technology is important and urgent for realizing the hydrogen economy.3,4 In the past few decades, plentiful hydrogen production techniques such as hydrogen generation using fossil fuels (including partial oxidation, steam reforming, autothermal reforming and fossil hydrocarbon reforming technologies),5 bio-hydrogen production technology, and electrochemical water splitting have been developed.6,7 Hydrogen generation from fossil fuels is still the principal technique to obtain hydrogen owing to the fact that it can be maturely applied in industrial production and shows a relatively low cost.8 However, the main disadvantage is the unavoidable generation of vast quantities of the greenhouse gas CO2 and other noxious gases (including CO, NOx, and H2S), thus worsening environmental problems.8,9 Bio-hydrogen production technique exhibits a few advantages such as mild reaction conditions, low energy consumption, and a wide range of raw materials (including algae, anoxygenic photosynthetic bacteria, and agricultural waste).6,10 Nevertheless, it is difficult to commercialize bio-hydrogen production technology as the technique shows high production costs and low hydrogen yield.11,12 Compared with hydrogen production from fossil fuel-based hydrogen generation and bio-hydrogen production technology, electrochemical water splitting is supposed to be a clean, effective and sustainable technique to obtain hydrogen because of its advantages of high purity of hydrogen, high hydrogen production efficiency, and zero-emission of polluted gases.13 Electrochemical water splitting principally has a few technologies, including anion exchange membrane (AEM), proton exchange membrane (PEM), solid oxide electrolytic cell (SOEC), and alkaline water electrolysis (ALK).14 Among these technologies, ALK is a promising method because it has greater maturity, lower equipment cost, larger commercial outreach, longer lifetime, higher stability and more reliability.15,16Electrochemical water splitting generally includes two half-cell reactions, namely, oxygen evolution reaction (OER) occurring on the anode surface and hydrogen evolution reaction occurring on the cathode surface.17–19 In accordance with the Volmer–Heyrovsky model, HER is a representative heterogeneous catalytic multistep reaction. The HER principle originates from the adsorption of hydrogen atoms on the electrocatalyst surface, known as the Volmer reaction step. Based on the electrocatalysis nature, the following step can go on with the reaction of two adsorbed H, which is referred to as the Tafel reaction, or to a reaction of H with the H+ in the electrolyte, which is referred to as the Heyrovsky reaction, to generate the H2 molecule, respectively. Irrespective of the reaction mode, the reaction of H adsorption is vital. Thus, it is imperative to research an electrocatalyst to accelerate the adsorption reaction step.20,21 Therefore, it cannot be overlooked that there is an appropriate hydrogen adsorption energy for the Volmer step, signifying that the adsorption level should not be excessively high to impede hydrogen desorption, nor too low that the reactant hydrogen atoms on the catalyst surface are so insufficient.22,23 Generally, alloy electrocatalysts show a better HER activity due to the fact their d orbital electronic structure can be modified, which give rise to suitable binding energy, thus, the stability for the adsorbed hydrogen atom can be improved and the formation of H2 can be promoted.24–26 Therefore, alloying and doping techniques to modify their electronic structure using other nonmetallic atoms or metals have been considered to be one of the most feasible ways to enhance their intrinsic HER electrocatalytic activity. Furthermore, the electrodeposition technique is regarded as an effective approach to preparing functional membrane materials, including nanometer materials, metallic oxide, carbon nanotubes and transition metal-based catalysts.27,28
It is well-known that the electronic configuration of metal Ni belongs to the typical hypo-d-orbital configuration. Thus, it can show a definite HER catalytic activity.29,30 For instance, the nickel deposits prepared on a graphite electrode from a NiCl2·6H2O and acetate buffer mixture system show an electrocatalytic property with an HER over-potential of 164 mV (η10).31 Nevertheless, the electrocatalytic activity can be obviously enhanced when Ni metal is alloyed with other metals such as Fe, W, Ti, Zn and Mo or doping with suitable nonmetallic atoms such as S, P and B based on the fact that the doping or alloying methods could result in a notable synergistic enhancement effect.30,32
For example, Ni–Mo alloy films containing various Mo concentrations were obtained by Chao Xu et al.33 They found that the Ni80.14Mo19.59 deposited catalyst showed a HER overpotential of 152 mV (η100). Furthermore, Ni-based composite deposits were also synthesized and employed as electrocatalysts for HER (Table 1). It is worth mentioning that these Ni–Mo alloy films were normally synthesized in aqueous solutions. Recently, the Ni–Mo alloy electrocatalyst films with different morphologies could be prepared from ionic liquids (ILs). For example, the Ni–Mo alloy films with a spherical particle microstructure were synthesized from deep eutectic solvents, and these films showed a HER overpotential of 53 mV (η10).54 The organic solvent system possesses plenty of advantages over ILs, such as a lower cost, milder electrolytic deposition environment and more outstanding electrochemical stability.55–57 In our preceding research, a Ni–Co alloy deposit with a spherical structure/fibrous structure surface morphology was electrodeposited from a pure EG system, and it presented impressive catalytic performance and durability with a HER overpotential of 133 mV (η10) in 1 M KOH.58 Furthermore, there have been few reports on the successful deposition of Ni–Mo alloy films from organic solvents. Consequently, during the work, a pure EG organic solvent was employed as the electrolyte to synthesize Ni–Mo alloy film catalysts using a galvanostatic electrodeposition technique, anticipating that the obtained catalyst could exhibit better catalytic activity for HER.
| Alloy coating film | Employed electrolytes | η10 (mV) | b (mV dec−1) | Reference |
|---|---|---|---|---|
| Ni(OH)2@Ni | Water-based solution | 106 | 88 | 34 |
| Ni/MoC@NC | Water-based solution | 111 | 38 | 35 |
| Fe–B@Ni | Water-based solution | 379 | 29 | 36 |
| MoS2@Ni/RGO | Water-based solution | 92 | 31.97 | 37 |
| NixCo1−x@NixCo1−xO/NCNT | Water-based solution | 74 | — | 38 |
| NiFe/Ni–Mo–S@CC | Water-based solution | 72 | 123 | 39 |
| C@NiCoP | Water-based solution | −45 | 43 | 40 |
| Ru–Ni@Cu | Water-based solution | 246η100 | 87.08 | 41 |
| Co(OH)2@P–NiCo-LDH | Water-based solution | 226 | 134 | 42 |
| CuO/Cu2O@Ni–B | Water-based solution | 194.2 | — | 43 |
| Ni–Co–Fe–Se@NiCo-LDH | Water-based solution | 113 | 44.87 | 44 |
| Ni3+-rich Ni/NiOx@C | Water-based solution | 80 | 77 | 45 |
| C@NiO/Ni | Water-based solution | 407 | 152 | 46 |
| Ni@Ni3C nanochain-SWCNT | Water-based solution | −74 | 46.9 | 47 |
| Oxide@Ni–Cu@Ni | Water-based solution | 70 | 57 | 48 |
| Ni–Cu–P@Ni–Cu | Water-based solution | −70 | 76 | 49 |
| Ni@Pt/N-doped | Water-based solution | 76.32η20 | 46.73 | 50 |
| Ni/NiO@C | Water-based solution | 204 | 137 | 51 |
| Ni/NiO@MoO3−x | Water-based solution | 7 | 34 | 52 |
| Ni–Sn@C | Water-based solution | — | 35 | 53 |
| Ni–Mo | In EG | 74 | 80.6 | This work |
The electrochemical reduction of Ni2+ and/or Mo6+ on a GC electrode is recorded by cyclic voltammetry (CV). The surface morphology, crystal structure, and components of the obtained Ni–Mo films are characterized using scanning electron microscopy (SEM), X-ray diffraction (XRD) and energy dispersive spectrometer (EDS). Moreover, the catalytic performance of the Ni–Mo films for HER is assessed by electrochemical impedance spectra (EIS), CV, linear sweep voltammetry (LSV), and chronopotentiometry in the KOH electrolyte.
2 Experimental
2.1. Chemicals
Ammonium molybdate tetrahydrate ((NH4)6Mo7O24·4H2O, AR), nickel chloride hexahydrate (NiCl2·6H2O, 98%), potassium hydroxide (KOH, AR), ethylene glycol (EG, AR), and citric acid monohydrate (C6H8O7·H2O, AR) were purchased from Aladdin Bio-Chem Technology Co, Ltd (Shanghai, China). Copper sheets (99.9 wt%) used in this work were obtained from the relative commercial market and underwent pretreatment as described in the relevant literature.25,59,60 It should be noted that the above EG solvent and all chemical agents were dried at 353 K for 24 h to eliminate any remaining water before use.2.2. Processing of the alloy film
The Ni–Mo alloy films were prepared on a copper matrix (exposed area: 1 cm × 0.5 cm) by the potentiostatic technique at 333 K for 20 minutes at −1.40 V in an Ar atmosphere, with oxygen and moisture levels below 3 ppm within a glove box. Here, NiCl2·6H2O and (NH4)6Mo7O24·4H2O were used as the Ni2+ and Mo6+ sources, respectively; 0.15 M sodium citrate (H3Cit) was also used in each plating solution as a complexing agent. Five plating cells were used for obtaining Ni–Mo films by adding 0.03, 0.06, 0.09, 0.012 and 0.015 M of (NH4)6Mo7O24·4H2O into the EG solution containing 0.3 M NiCl2·6H2O, respectively. During plating, the distance between the anode and cathode was separated by 2 cm. After deposition, the obtained Ni–Mo alloy films underwent cleaning procedures as described in the referenced literature.612.3. Ni–Mo alloy characterization
The scanning electron microscope (TESCAN MIRA4) was utilized to examine the surface morphologies of the Ni–Mo alloy films containing varying Mo contents. The accelerating voltage for morphology analysis is 20 kV. The energy-dispersive X-ray spectrometer was utilized to characterize the elemental composition and elemental mapping of alloy films. The phase evolution of Ni–Mo alloy films was investigated by X-ray diffraction (Bruker D8) at a scan rate of 3° min−1 in the 2θ ranges from 30° to 100°, employing Cu Kα (λ = 0.1541 Å) radiation.2.4. Electrochemical tests
The electrochemical tests were performed using a CHI660B electrochemical workstation (Shanghai Chenhua Instrument, Inc.) with a three-electrode structure. In the cell, the reference electrode was a saturated calomel electrode, the working electrode was a glassy carbon electrode (0.07 cm2), and the counter electrode was a platinum sheet. It could be emphasized that the GC electrode was pretreated based on the published literature.59,62,63 For CV measurements, the scan rate was 50 mV s−1 and the potential range was from +2.00 to −3.00 V. The electrocatalytic performance of the Ni–Mo alloy films for HER in a 1 M KOH electrolyte was evaluated at 298 K by various techniques, including EIS, CV, LSV, and chronopotentiometry. These measurements were conducted using the aforementioned electrochemical workstation and a three-electrode structure. It should be noted that the detailed measuring parameters can be referenced to our previously published articles,59,63 and the potentials utilized in this work were transformed into a reversible hydrogen electrode (RHE) potential by the approach outlined in these published literature.3 Results and discussion
3.1. Electrochemical behavior investigation
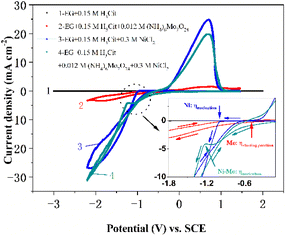
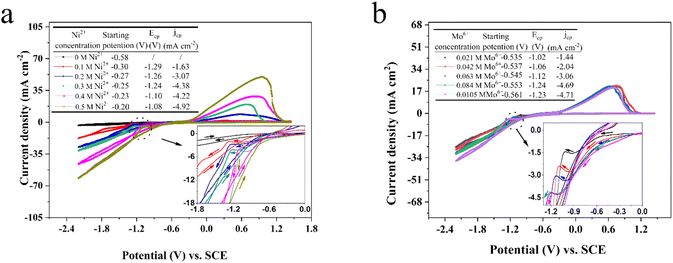
Fig. 1 exhibits the standard cyclic voltammograms of the EG system with 0.084 M Mo6+ or/and 0.30 M Ni2+ obtained with a scan rate of 50 mV s−1 at 323 K. For curve 1, there are no obvious reduction or oxidation peaks between +2.00 and −3.00 V, indicating that the EG electrolyte solution demonstrates significant electrochemical stability. However, the other CV curves (curves 2, 3 and 4 in Fig. 1) exhibit changes upon the introduction of 0.084 M Mo6+ or/and 0.30 M Ni2+ into the EG electrolyte solution. Compared with curve 1, it can be found that the cathodic current density increases from −0.58 (the so-called starting potential, ηstarting potential) to −1.73 V (displayed in the inset of Fig. 1) in curve 2, after which an obviously cathodic shoulder is observed from −1.73 to −2.20 V. It could be emphasized that the current density loop (crossover) is absent, suggesting that the Mo nucleation does not happen in the EG system, and the electrochemical behavior corresponds to the synthesis of oxides and hydroxides of Mo. To further confirm the electrochemical behavior of Mo6+ in the EG system, an electrodepositing test on a copper substrate at various potentials (−1.0, −1.2, −1.4, −1.6 V) using the potentiostatic technique was performed. However, the Mo deposits cannot be obtained. The consequence is consistent with the reported reduction behavior of Mo6+ in ionic liquid systems.64 However, it shows a completely different characteristic in the electrodeposition process of Mo6+ in the EG system containing trace water because of the presence of a current density loop (crossover), and the crossover of the anodic and cathodic branches can be attributed to the nucleation and growth process of the Mo layer on the cathode electrode surface.65 During the reverse potential, a weak anode shoulder can be observed between 0.17 and 1.31 V, confirming the desorption of the synthesis of oxides and hydroxides of Mo.During the cathodic scanning for curve 3, it is noted that the cathodic current density additional from −0.99 (Ni: ηnucleation) to −1.71 V, after which a distinct cathodic shoulder is detected in the range of −1.71 to −2.13 V. It is a consistent characteristic in the electrodeposition mechanism of Ni2+ in aqueous systems66 and ILs.67 For curve 4, a well-defined cathodic plateau from −0.07 to −1.32 V (Ni–Mo: ηnucleation) could be observed in the stage of cathodic scanning, which is caused by the formation of molybdenum hydroxides. The consequence shows that the Ni–Mo co-deposition behavior follows the synthesis of oxides and hydroxides of Mo.68 In the process of reverse scanning, a pair of typical current density loops (crossovers) are recorded at −1.13 (curve 3) and −1.53 V (curve 4), as well as a pair of homologous anodic current density peaks can be observed at 0.70 (curve 3) and 0.69 V (curve 4). The presence of two current density loops (crossovers) indicates the occurrence of nucleation and the subsequent crystallization process, whilst the two anodic density peaks are due to the associated desorption of Ni and Ni–Mo film, respectively. It should be noted that pure Ni (−0.99 V) has more positive nucleation overpotential than Ni–Mo alloy in the EG system, suggesting that Ni–Mo alloy co-deposition is more difficult compared to monometallic Ni and the existence of additional Mo6+ in the EG system can suppress the reduction of Ni2+.33 Furthermore, all these results also suggest that it is consistent with the standard-induced co-deposition phenomenon. Thus, the Mo6+ reduction can be promoted by introducing Ni2+ and its function can be reinforced by the improved content of Ni2+ in the EG system. To notarize the result, the next set of CV tests with a scan rate of 50 mV s−1 on a glassy carbon electrode was conducted in the EG-0.084 M Mo6+ system, varying the Ni2+ content from 0 to 0.5 M, as depicted in Fig. 2a. It can be observed that as the Ni2+ content varies from 0 to 0.30 M, the current density for the cathodic peak (jcp) also escalates and then fluctuates slightly with a further increase of the Ni2+ content, proving that increasing the Ni2+ content in the system can probably intensify the promotion effect for Mo6+ reduction. Interestingly, during the cathodic scanning, the starting potential corresponding to the current density, initially increasing from 0, shifts positively from −0.30 to −0.20 V (ηstarting potential). Importantly, these values of the starting potential for the EG system with 0.084 M Mo6+ and various Ni2+ concentrations are more positive than that of the system containing only 0.084 M Mo6+ (−0.58 V, ηstarting potential), suggesting that the co-deposition of Ni–Mo is more readily achieved than that of Mo alone, and that the additional Ni2+ in the EG system facilitates the Mo6+ reduction. The consequence also confirms the presence of a potential-induced deposition mechanism, which is a generally accepted process for the electrodeposition of Ni–Mo, consistent with the findings reported in previous studies.69–71 Moreover, the potential of the anode peak exhibits a direct correlation with the content of Ni2+ in the EG system, suggesting that the corrosion resistance and stability of Ni–Mo alloy films can be enhanced significantly by increasing the Ni2+ content in the EG system.
To research the effect of Mo6+ content, the next set of CV tests using a scan rate of 50 mV s−1 on a glassy carbon electrode was conducted in the EG-0.30 M Ni2+ system, varying the Mo6+ content from 0.021 to 0.105 M, as depicted in Fig. 2b. It can be found that the increase of Mo6+ content in EG system could restrain the electrodeposition process and the effect can be improved as a result of the starting potential shifting slightly negative. It should be noted that the potential for reduction peak shifts negatively, suggesting that increasing the Mo6+ content in the EG system could enhance the cathodic polarization.
3.2. Composition and crystal structure characterization
Fig. 3a exhibits the representative EDS spectrum of the Ni–Mo alloy film synthesized from the EG system for 20 min at 333 K, including 0.084 M Mo6+ and 0.30 M Ni2+ at −1.40 V. As depicted in Fig. 3a, the EDS spectrum exhibits that the alloy film contains Ni (about 78.80 wt%) and Mo (about 10.84 wt%) with a small residual amount of C (about 4.79 wt%) and O (about 5.57 wt%) species, suggesting the Ni–Mo alloy film is enriched in nickel. Significantly, the content of O species in this film is due to the oxidation of the alloy film in the air after being extracted from the cell59,63,72 and the C species are because of the role of EG molecule in the electrolyte during the electrodeposition process.58,65 Moreover, the coating thickness is estimated at 9.32 μm according to the reported method.63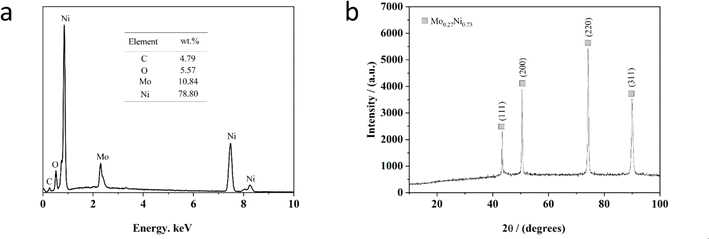 | ||
| Fig. 3 EDS (a) and XRD (b) pattern of Ni–Mo alloy films obtained from the EG system at 333 K for 20 min, including 0.30 M Ni2+ and 0.084 M Mo6+ at −1.40 V. | ||
Fig. 3b displays a standard XRD of the Ni–Mo alloy film prepared at 333 K with 0.30 M Ni2+ and 0.084 M Mo6+ from the EG system. As depicted in Fig. 3b, the structural phases and compositions correspond to the Mo0.27Ni0.73 alloy. The four diffraction peaks located at 43°, 50°, 74° and 90° can be ascribed to the (111), (200), (220) and (311) crystalline planes of the Mo0.27Ni0.73 phase according to PDF#04-004-4497. It can be found that the diffraction peak (220) is the most intense, suggesting that there is a preferred orientation direction. The average size of Ni–Mo crystalline grains is calculated at approximately 58.4 nm, determined from the full-width at half-maximum (FWHM) of the Ni–Mo peak (220). Generally, the films of crystalline nanoscale grains possess a greater specific surface area. Therefore, it can be inferred that there is a superior HER catalytic activity with the nanocrystalline Ni–Mo alloy film obtained from the pure EG system.
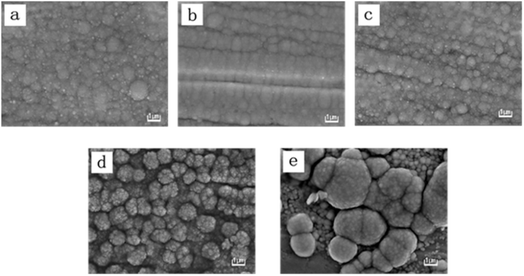
Fig. 4 depicts the surface morphology of these electrodeposited Ni–Mo alloy films with various Mo concentrations obtained at a temperature of 333 K. As exhibited in Fig. 4, these Ni–Mo alloy films consist of spherical particles, and the size of the spherical particles can be affected by Mo concentration. When the Mo concentration increases from 1.95 to 10.84 wt% (Fig. 4a–d), the average size of these tiny spherical particles can be decreased. However, it can be found that when the Mo concentration reaches 14.12 wt% (Fig. 4e), the average size of these tiny spherical particles can be increased. It should be noted that these spherical particles exhibit obvious agglomeration phenomena as the Mo concentration exceeds 6.32 wt% (Fig. 4d and e). In Fig. 4d, it is evident that the Ni–Mo alloy films possess a notably rough and homogenous surface due to the presence of a cauliflower-like pattern. In Fig. 4e, whereas the Ni–Mo alloy films also exhibit a cauliflower-like pattern, the morphologies of the cauliflower-like pattern exhibit irregularity and nonuniformity.33 It is attributed to the fact that the increase in the Mo6+ content in the cell leads to a small enhancement in the inhibition of Ni2+ reduction, resulting in better cathode polarization. Nevertheless, once the Mo6+ content surpasses 0.084 M, further enhancement of the Ni2+ reduction inhibition is not observed. Generally, the enhanced inhibition ability could improve cathodic polarization, leading to a reduction in crystal particle sizes. Therefore, the consequence also conforms to the above CV measurement results. Generally, the size of the spherical particles is smaller, and the film could exhibit a larger specific surface area, thereby offering an increased number of available active sites for electrocatalytic reactions, suggesting the Ni–Mo alloy films with 10.84 wt% Mo will show a more outstanding catalytic property.
3.3. Electrocatalytic HER activity of films
To investigate the electrocatalytic properties of these Ni–Mo alloy films with different Mo concentrations for HER, four electrochemical techniques (CV, EIS, LSV and chronopotentiometry measurements) are conducted on these Ni–Mo alloy film surfaces in an alkaline solution of 1 M KOH. The steady-state polarization curves acquired for the prepared Ni–Mo alloy films containing various Mo concentrations are exhibited in Fig. 5. It is evident from the figure that the Ni–Mo alloy films show evident HER electrocatalytic activity compared to metallic Ni (η10 = 183), and this activity is related to the Mo concentration. The overpotential values for the catalytic current density achieving 10 mA cm−2 (η10) decrease from 159 to 74 mV with the increase in Mo concentration from 1.95 to 10.84 wt%. Conversely, when the Mo concentration exceeds 10.84 wt%, the overpotential value is increased. The result is analogous to the previously documented Ni–Mo HER catalysts in alkaline environments.71,73 The superb alkaline HER activity stems from the synergistic function of the Ni–Mo dual sites.74,75 It is evident that the Ni–Mo alloy films containing 10.84 wt% Mo shows the most superior electrocatalyst activity for HER with an overpotential of 74 mV (η10), which is in line with the results acquired by SEM investigation that the Ni–Mo film with the Mo concentration of 10.84 wt% exhibits a greater electrochemical active surface area (ECSA) because of the rougher and regular cauliflower-like surface structure (Fig. 4d).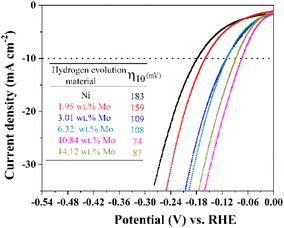 | ||
| Fig. 5 LSV curves of metallic Ni and Ni–Mo alloy films containing different Mo concentrations obtained at 298 K in 1 M KOH solution from the EG system. | ||
Fig. 6 exhibits the Tafel plots obtained from LSV plots (Fig. 5). It should be noted that these exchange current densities (j0) corresponding to the Tafel plots are calculated by j0 = 10−a/b (ref. 76 and 77) and exhibited in Table 2. As displayed in Fig. 6, all of the Tafel slopes of Ni–Mo films are between 80.6 to 159.6 mV dec−1, suggesting that the HER rate on Ni–Mo alloy film catalysts is governed by the Volmer–Heyrovsky mechanism, and the Volmer reaction is the rate-determining step.65,78–80 It can be found that the Tafel slope for the Ni–Mo alloy film with 10.84 wt% Mo is smaller than that of metallic Ni (179.5 mV dec−1) and other Ni–Mo alloy films with various Mo concentrations. Meanwhile, the exchange current density (j0 = 1.30 mA cm−2) for the Ni–Mo alloy film with 10.84 wt% Mo is also the largest among these Ni–Mo alloy film catalysts and metallic Ni. The above consequences also show that the Ni–Mo alloy film with 10.84 wt% Mo is more suitable for HER catalytic kinetics, which is consistent with the LSV techniques.
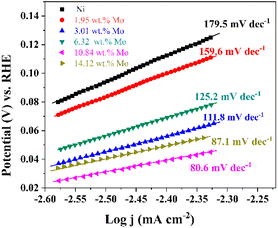 | ||
| Fig. 6 Tafel plots of metallic Ni and Ni–Mo alloy films with different Mo concentrations obtained at 298 K in 1 M KOH solution from the EG system. | ||
| Ni–Mo alloys with various Mo concentrations | a (V) | b (mV dec−1) | j0 (mA cm−2) |
|---|---|---|---|
| Ni | 0.5432 | 179.5 | 0.99 |
| Ni-1.95 wt% Mo | 0.4828 | 159.6 | 0.94 |
| Ni-3.01 wt% Mo | 0.3249 | 111.8 | 1.24 |
| Ni-6.32 wt% Mo | 0.3694 | 125.2 | 1.12 |
| Ni-10.84 wt% Mo | 0.2326 | 80.6 | 1.30 |
| Ni-14.12 wt% Mo | 0.2586 | 87.1 | 1.07 |
Generally, the relevant useful results on interface properties and HER kinetics related to the Ni–Mo alloy film electrocatalyst surface also can be acquired by EIS tests (0.01–100![[thin space (1/6-em)]](https://www.rsc.org/images/entities/char_2009.gif) 000 Hz). Fig. 7 exhibits the EIS test results of these Ni–Mo alloy films containing metallic Ni and various Mo concentrations employed as electrocatalysts for HER. Furthermore, the EIS information statistics are adjusted by Zsimpwin software according to the electrical equivalent circuit (EEC) (inset in Fig. 7), and the computed values are presented in Table 3. This circuit includes Rct, CPE (constant phase element) and Rs, representing the electrochemical charge transfer resistance, double-layer capacity of the electrodes and the internal resistance contained solution resistance and catalyst resistance, respectively.81 As displayed in Fig. 7, the HER electrocatalytic performance and conductivity for the Ni–Mo alloy films are related to Mo concentration. The semicircle diameter diminishes as Mo concentration changes from 0 wt% (only metallic Ni) to 10.84 wt%, suggesting that both the HER electrocatalyst activity and conductivity are enhanced. On the contrary, when the Mo concentration is over 10.84 wt%, the semicircle diameter increases inversely, suggesting that both the HER catalytic activity and conductivity are weakened. Furthermore, the Ni–Mo alloy film electrocatalyst with 10.84 wt% Mo also displays the highest double-layer capacitance, as well as the lowest charge transfer resistance and internal resistance for HER, indicating that the rate of electron transfer is the highest on the Ni–Mo alloy film electrocatalyst and the electrocatalyst exhibits the largest ECSA, thus presenting the best electrocatalyst activity for HER.
000 Hz). Fig. 7 exhibits the EIS test results of these Ni–Mo alloy films containing metallic Ni and various Mo concentrations employed as electrocatalysts for HER. Furthermore, the EIS information statistics are adjusted by Zsimpwin software according to the electrical equivalent circuit (EEC) (inset in Fig. 7), and the computed values are presented in Table 3. This circuit includes Rct, CPE (constant phase element) and Rs, representing the electrochemical charge transfer resistance, double-layer capacity of the electrodes and the internal resistance contained solution resistance and catalyst resistance, respectively.81 As displayed in Fig. 7, the HER electrocatalytic performance and conductivity for the Ni–Mo alloy films are related to Mo concentration. The semicircle diameter diminishes as Mo concentration changes from 0 wt% (only metallic Ni) to 10.84 wt%, suggesting that both the HER electrocatalyst activity and conductivity are enhanced. On the contrary, when the Mo concentration is over 10.84 wt%, the semicircle diameter increases inversely, suggesting that both the HER catalytic activity and conductivity are weakened. Furthermore, the Ni–Mo alloy film electrocatalyst with 10.84 wt% Mo also displays the highest double-layer capacitance, as well as the lowest charge transfer resistance and internal resistance for HER, indicating that the rate of electron transfer is the highest on the Ni–Mo alloy film electrocatalyst and the electrocatalyst exhibits the largest ECSA, thus presenting the best electrocatalyst activity for HER.
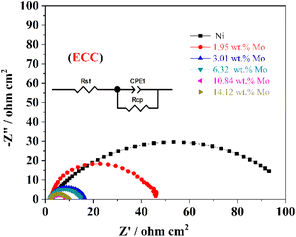 | ||
| Fig. 7 EIS curves of metallic Ni and Ni–Mo alloy films obtained in 1 M KOH solution at 298 K from the EG system. | ||
| Ni–Mo alloys with various Mo concentrations | Rs (Ω cm2) | Rct (Ω cm2) | Cdl (mF cm−2) | ECSA (cm2) |
|---|---|---|---|---|
| Ni | 2.06 | 93.1 | 4.6 | 230 |
| Ni-1.95 wt% Mo | 2.03 | 43.64 | 9.8 | 490 |
| Ni-3.01 wt% Mo | 2.00 | 14.32 | 17.1 | 855 |
| Ni-6.32 wt% Mo | 2.01 | 12.51 | 31.2 | 1560 |
| Ni-10.84 wt% Mo | 3.47 | 6.63 | 31.9 | 1595 |
| Ni-14.12 wt% Mo | 2.13 | 7.59 | 20.1 | 1005 |
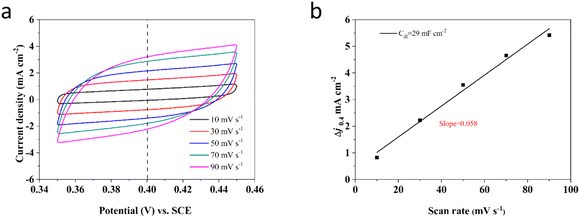
Commonly, the ECSA value can be determined by utilizing the specific capacitance (Cdl) obtained from a flat standard with 1 cm2 of actual surface area.82,83 Besides, the typical range for the Cdl value on a flat surface is generally supposed to be between 20 and 60 μF cm−2, with a common assumption often setting it at 20 μF cm−2.76 Thus, in this investigation, the ECSA values of these Ni–Mo alloy films are gained using 20 μF cm−2 according to the methodology outlined in the reported literature84–87 and displayed in Fig. 8. According to Fig. 8, the Ni–Mo alloy film electrocatalyst with 10.84 wt% Mo exhibits the largest ECSA value (1595.0 cm2) and indicates the most superior electrocatalytic activity for HER. Besides, the Cdl can be obtained through CV tests in a potential range where there are non-faradaic behaviors by varying scan rates.88 Therefore, the potentials are measured over a range of 0.35 to 0.45 V vs. RHE at various scan rates from 10 to 90 mV s−1 in 1 M KOH alkaline solution. The CV test results for the Ni–Mo alloy film with 10.84 wt% Mo, which displayed the superior HER electrocatalytic activity, are presented in Fig. 8a. The recorded capacitive current densities are fitted into a function of scan rates and displayed in Fig. 8b. The obtained Cdl value for the Ni–Mo alloy film containing 10.84 wt% Mo is approximately 29 mF cm−2, showing that the ECSA result of the Ni–Mo alloy film (10.84 wt% Mo) electrocatalytic electrode is 1450 cm2. It is near the recorded data of EIS tests (1595.0 cm2), signifying that the measurement results are reasonable and dependable.
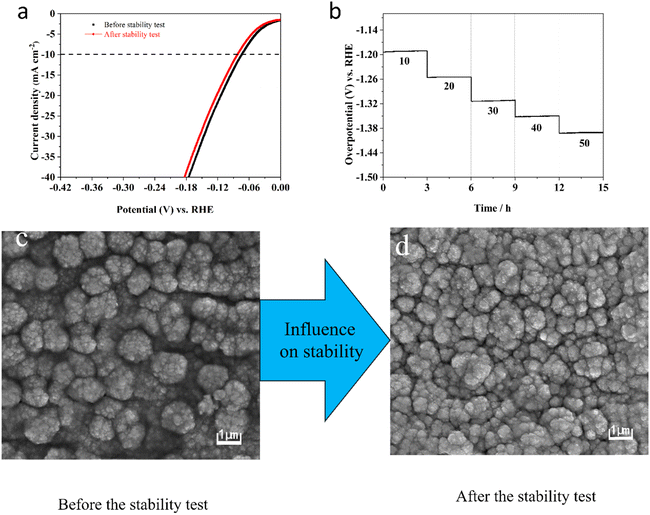
Moreover, the durability of the electrocatalyst electrode is also a vital factor in evaluating its properties for HER. Therefore, Fig. 9a shows the LSV curve after completing 1000 CV cycles and the original LSV curve, revealing only a slight variation of 11 mV in HER overpotential. This minimal change highlights the outstanding catalytic durability of the Ni–Mo alloy film electrode containing 10.84 wt% Mo. To confirm its durability, the chronopotentiometry experiments have been implemented by altering the current density range of 10 to 50 mA cm−2 and maintaining a residence time of 3 h at various current densities (Fig. 9b). As displayed in Fig. 9b, the potentials stay nearly consistent at each current density. Fig. 9c and d, respectively, show SEM images taken before and after the stability test. It can be found that the surface morphology did not change during the stability test due to the electrolysis of water, indicating that the Ni–Mo alloy film electrocatalysts containing 10.84 wt% Mo shows satisfactory HER durability in KOH electrolyte.
4 Conclusions
(1) It is difficult to obtain metal Mo films individually from the EG system and the Ni–Mo co-deposition mechanism presents a representative induced co-deposition in the EG system.(2) In the EG system, the Mo6+ reduction can be promoted by introducing Ni2+, whereas Ni2+ reduction can be suppressed by introducing Mo6+. Furthermore, both functions can be reinforced owing to the improved content of Ni2+ and Mo6+ in the EG system, respectively.
(3) Ni–Mo alloy films containing various Mo concentrations can be prepared from the EG system, and the Mo content in the film can influence the surface morphology of Ni–Mo alloy films. Cauliflower-like pattern Ni–Mo films with rough and homogenous surfaces can be obtained when the Mo concentration is 10.84 wt%.
(4) The electrocatalytic property of the Ni–Mo alloy films can be reinforced with the Mo concentration increasing from 1.95 to 10.84 wt% and the obtained Ni–Mo film containing 10.84 wt% Mo exhibits superior catalytic activity for HER with an overpotential of 74 mV (η10) in 1 M KOH electrolyte because of the high ECSA value (1450.0 cm2). Therefore, the EG system shows promise as a potential contender for commercial use in the plating of Ni–Mo alloys.
Data availability
The authors confirm that the data supporting the findings of this study are available within the article.Author contributions
Xinkuai He: conceptualization, methodology, writing – original draft, review & editing. Yiren Li: investigation, data curation, writing – original draft. Jingjing Yang: investigation, data curation, writing – original draft. Genfa Zeng: investigation, data curation, writing – original draft. Luye Wu: writing – original draft, funding acquisition, validation.Conflicts of interest
The authors declare that they have no known competing financial interests or personal relationships that could have appeared to influence the work reported in this paper.Acknowledgements
The authors acknowledge the financial support of the National Natural Science Foundation of China (No. 21476067) and the Project Sponsored by the Scientific Research Foundation for the Returned Overseas Chinese Scholars, State Education Ministry.References
- J. Hou, X. Zhu and P. Liu, Int. J. Energy Res., 2019, 43, 662–680 CrossRef.
- D. Zhang and M. A. Ashraf, Int. J. Hydrogen Energy, 2020, 45, 30533–30546 CrossRef CAS.
- M. He, F. Kong, G. Yin, Z. Lv, X. Sun, H. Shi and B. Gao, RSC Adv., 2018, 8, 14369–14376 RSC.
- R. Q. Li, S. Guo, X. Wang, X. Wan, S. Xie, Y. Liu, C. Wang, G. Zhang, J. Cao, J. Dai, M. Ge and W. Zhang, Chem. Sci., 2024, 15, 10084–10091 RSC.
- P. J. Megía, A. J. Vizcaíno, J. A. Calles and A. Carrero, Energy Fuels, 2021, 35, 16403–16415 CrossRef.
- H. Wang, J. Xu, L. Sheng, X. Liu, Y. Lu and W. Li, Int. J. Energy Res., 2018, 42, 3442–3453 CrossRef CAS.
- R.-Q. Li, S. Zeng, B. Sang, C. Xue, K. Qu, Y. Zhang, W. Zhang, G. Zhang, X. Liu, J. Deng, O. Fontaine and Y. Zhu, Nano Res., 2022, 16, 2543–2550 CrossRef.
- N. Sánchez-Bastardo, R. Schlögl and H. Ruland, Ind. Eng. Chem. Res., 2021, 60, 11855–11881 CrossRef.
- K. Peng, G. Morrow, Z. Xiaolei, W. Tipeng, T. Zhongfu and J. Agarwa, Int. J. Agric. Biol. Eng., 2017, 10, 192–200 Search PubMed.
- X. Xu, Q. Zhou and D. Yu, Int. J. Hydrogen Energy, 2022, 47, 33677–33698 CrossRef CAS.
- W. Chen, T. Li, Y. Ren, J. Wang, H. Chen and Q. Wang, J. Cleaner Prod., 2023, 387, 135777 CrossRef CAS.
- L. Singh and Z. A. Wahid, J. Ind. Eng. Chem., 2015, 21, 70–80 CrossRef CAS.
- L. Wang, H. Wu, S. Xi, S. T. Chua, F. Wang, S. J. Pennycook, Z. G. Yu, Y. Du and J. Xue, ACS Appl. Mater. Interfaces, 2019, 11, 17359–17367 CrossRef CAS.
- Y. Xu, X. Zhang, Y. Liu, R. Wang, Y. Yang and J. Chen, Environ. Sci. Pollut. Res., 2022, 30, 11302–11320 CrossRef PubMed.
- M. David, C. Ocampo-Martínez and R. Sánchez-Peña, J. Energy Storage, 2019, 23, 392–403 CrossRef.
- S. Sebbahi, N. Nabil, A. Alaoui-Belghiti, S. Laasri, S. Rachidi and A. Hajjaji, Mater. Today: Proc., 2022, 66, 140–145 CAS.
- W. Zhang, L. Cui and J. Liu, J. Alloys Compd., 2020, 821, 153542 CrossRef CAS.
- L. Li, Q. Xu, Y. Zhang, J. Li, J. Fang, Y. Dai, X. Cheng, Y. You and X. Li, J. Alloys Compd., 2020, 823, 153750 CrossRef CAS.
- B. Sang, Y. Liu, X. Wan, S. Xie, G. Zhang, M. Ge, J. Dai, W. Zhang and R. Q. Li, Chem. Commun., 2023, 59, 8743–8746 RSC.
- A. Eftekhari, Int. J. Hydrogen Energy, 2017, 42, 11053–11077 CrossRef CAS.
- B. He, Y. Kuang, Z. Hou, M. Zhou and X. Chen, J. Mater. Res., 2017, 33, 213–224 CrossRef.
- P. P. Patel, P. J. Hanumantha, M. K. Datta, O. I. Velikokhatnyi, D. Hong, J. A. Poston, A. Manivannan and P. N. Kumta, Int. J. Hydrogen Energy, 2017, 42, 17049–17062 CrossRef CAS.
- S. Wen, T. Yang, N. Zhao, L. Ma and E. Liu, Appl. Catal., B, 2019, 258, 117953 CrossRef CAS.
- J. Feng, R. Tang, G. Liu and T. Meng, Chem. Eng. J., 2023, 452, 139131 CrossRef CAS.
- P. N. S. Casciano, R. L. Benevides, R. A. C. Santana, A. N. Correia and P. de Lima-Neto, J. Alloys Compd., 2017, 723, 164–171 CrossRef CAS.
- F. Huang, M. Humayun, G. Li, T.-T. Fan, W.-L. Wang, Y.-L. Cao, A. Nikiforov, C.-D. Wang and J. Wang, Rare Met., 2024, 43, 3161–3172 CrossRef CAS.
- J. Lin, H. Wang, J. Cao, F. He, J. Feng and J. Qi, J. Colloid Interface Sci., 2020, 571, 260–266 CrossRef CAS.
- R. Li, Y. Li, P. Yang, D. Wang, H. Xu, B. Wang, F. Meng, J. Zhang and M. An, J. Energy Chem., 2021, 57, 547–566 CrossRef CAS.
- S. Ding, L. Wu and X. Yuan, Chem. Eng. J., 2023, 478, 147473 CrossRef CAS.
- J. Liu, C. Tang, Z. Ke, R. Chen, H. Wang, W. Li, C. Jiang, D. He, G. Wang and X. Xiao, Adv. Energy Mater., 2022, 12, 2103301 CrossRef CAS.
- I. El-Hallag, S. Elsharkawy and S. Hammad, J. Appl. Electrochem., 2022, 52, 907–918 CrossRef CAS.
- V. S. Protsenko, L. S. Bobrova, T. E. Butyrina, A. S. Baskevich, S. A. Korniy and F. I. Danilov, Heliyon, 2023, 9, e15230 CrossRef CAS.
- C. Xu, J.-b. Zhou, M. Zeng, X.-l. Fu, X.-j. Liu and J.-m. Li, Int. J. Hydrogen Energy, 2016, 41, 13341–13349 CrossRef CAS.
- S. Lu, B. Zhao, M. Chen, L. Wang, X.-Z. Fu and J.-L. Luo, Int. J. Hydrogen Energy, 2021, 46, 1540–1547 CrossRef CAS.
- Y. Zhang, X. Zhen, Z. Su, J. Guo, J. Li, L. shuai and X. Li, Int. J. Hydrogen Energy, 2024, 60, 46–54 CrossRef CAS.
- Y. Li, T. Yang, H. Li, R. Tong, S. Peng and X. Han, J. Colloid Interface Sci., 2020, 578, 273–280 CrossRef CAS PubMed.
- H. Xu, N. Liang, Z. Bai, B. Yang, D. Chen and H. Tang, Molecules, 2023, 28, 6658 CrossRef CAS PubMed.
- R. Jena, S. Bhattacharyya, N. Bothra, V. Kashyap, S. K. Pati and T. K. Maji, ACS Appl. Mater. Interfaces, 2023, 15, 27893–27904 CrossRef CAS.
- Z. Gong, W. Cheng, Z. Fang, N. Li, Y. Qin, X. Wang and H. Bao, Ionics, 2023, 29, 4787–4796 CrossRef CAS.
- Y. Bai, H. Zhang, L. Liu, H. Xu and Y. Wang, Chem.–Eur. J., 2015, 22, 1021–1029 CrossRef.
- B. H. Park, M. Cha, S. Kim, T. Kim, S. W. Joo, O.-S. Jung and M. Kang, J. Alloys Compd., 2022, 913, 165315 CrossRef CAS.
- N. Song, S. Hong, M. Xiao, Y. Zuo, E. Jiang, C. Li and H. Dong, J. Colloid Interface Sci., 2021, 582, 535–542 CrossRef CAS PubMed.
- T. Liu, M. Zuo, Y. Ju, W. Xia, Y. Li, D. Zhao and C. Xu, Mater. Lett., 2023, 344, 134422 CrossRef CAS.
- Z. Dai, X. Du and X. Zhang, J. Alloys Compd., 2023, 946, 169451 CrossRef CAS.
- J. Zhang, F. Cui, Q. Ma and T. Cui, Small, 2024, 20, 2311057 CrossRef CAS.
- A. Chinnappan, J. Dongxiao, W. A. D. M. Jayathilaka, C. Baskar, X. Qin and S. Ramakrishna, Int. J. Hydrogen Energy, 2018, 43, 15217–15224 CrossRef CAS.
- Y. Liu, S. He, F. Zhan, F. Gao, W. Sun and Q. Wang, J. Electrochem. Soc., 2020, 167, 146509 CrossRef CAS.
- N. Lotfi, T. Shahrabi, Y. Yaghoubinezhad and G. Barati Darband, Electrochim. Acta, 2019, 326, 134949 CrossRef CAS.
- G. Barati Darband, N. Lotfi, A. Aliabadi, S. Hyun and S. Shanmugam, Electrochim. Acta, 2021, 382, 138335 CrossRef CAS.
- M. M. Dehcheshmeh, R. Karimi Shervedani and M. Torabi, Electrochim. Acta, 2019, 327, 134895 CrossRef CAS.
- B. Su, Y. Wang, H. Luo, M. Zhong and Z. Lei, Part. Part. Syst. Charact., 2020, 38, 2000268 CrossRef.
- J. Y. Zhang, J. Liang, B. Mei, K. Lan, L. Zu, T. Zhao, Y. Ma, Y. Chen, Z. Lv, Y. Yang, C. Yu, Z. Xu, B. Y. Xia, W. Li, Q. Yuan and D. Zhao, Adv. Energy Mater., 2022, 12, 2200001 CrossRef CAS.
- J. Wang, D. T. Tran, K. Chang, S. Prabhakaran, J. Zhao, D. H. Kim, N. H. Kim and J. H. Lee, Nano Energy, 2023, 111, 108440 CrossRef CAS.
- P. Pan, Q. Zeng, X. Li, C. Liu, J. Zeng, T. Liang and X. Qi, Energy Technol., 2023, 11, 2300118 CrossRef CAS.
- M. Bechelany, J. Elias, P. Brodard, J. Michler and L. Philippe, Thin Solid Films, 2012, 520, 1895–1901 CrossRef CAS.
- G. Panzeri, A. Accogli, E. Gibertini, S. Varotto, C. Rinaldi, L. Nobili and L. Magagnin, Electrochem. Commun., 2019, 103, 31–36 CrossRef CAS.
- S. Vivegnis, L. C. Baudhuin, J. Delhalle, Z. Mekhalif and F. U. Renner, J. Appl. Electrochem., 2023, 54, 77–88 CrossRef.
- X. He, Z. Hu, Q. Zou, J. Yang, R. Guo and L. Wu, RSC Adv., 2023, 13, 8901–8914 RSC.
- X. He, Z. Sun, Q. Zou, L. Wu and J. Jiang, J. Electrochem. Soc., 2019, 166, D57–D64 CrossRef CAS.
- A. R. Shetty and A. C. Hegde, Mater. Sci. Energy Technol., 2018, 1, 97–105 Search PubMed.
- W. Dai, L. Lin, Y. Li, F. Li and L. Chen, Int. J. Hydrogen Energy, 2019, 44, 28746–28756 CrossRef CAS.
- X. He, C. Zhang, Q. Zhu, H. Lu, Y. Cai and L. Wu, J. Nanosci. Nanotechnol., 2017, 17, 1108–1115 CrossRef CAS.
- X. He, J. Yang, Q. Zou, Z. Hu and L. Wu, J. Electrochem. Soc., 2022, 169, 022502 CrossRef CAS.
- S. Costovici, A.-C. Manea, T. Visan and L. Anicai, Electrochim. Acta, 2016, 207, 97–111 CrossRef CAS.
- X. He, Z. Hu, J. Yang, R. Guo and L. Wu, Int. J. Hydrogen Energy, 2023, 48, 31506–31518 CrossRef CAS.
- Y. Wang, M. Kang, S. W. Jin, X. Q. Fu and X. S. Wang, Surf. Eng., 2014, 30, 557–561 CrossRef CAS.
- S. Wang, X. Guo, H. Yang, J. Dai, R. Zhu, J. Gong, L. Peng and W. Ding, Appl. Surf. Sci., 2014, 288, 530–536 CrossRef CAS.
- L. S. Sanches, S. H. Domingues, A. Carubelli and L. H. Mascaro, J. Braz. Chem. Soc., 2003, 14, 556–563 CrossRef CAS.
- L. Péter, É. Fekete, G. Kapoor and J. Gubicza, Electrochim. Acta, 2021, 382, 138352 CrossRef.
- N. P. Wasekar, S. Verulkar, M. V. N. Vamsi and G. Sundararajan, Surf. Coat. Technol., 2019, 370, 298–310 CrossRef CAS.
- Q. Han, S. Cui, N. Pu, J. Chen, K. Liu and X. Wei, Int. J. Hydrogen Energy, 2010, 35, 5194–5201 CrossRef CAS.
- X. He, Z. Sun, Q. Zou, J. Yang and L. Wu, J. Electrochem. Soc., 2019, 166, D908–D915 CrossRef CAS.
- G. Abuin, R. Coppola and L. Diaz, Electrocatalysis, 2018, 10, 17–28 CrossRef.
- I. A. Digdaya, P. P. Rodriguez, M. Ma, G. W. P. Adhyaksa, E. C. Garnett, A. H. M. Smets and W. A. Smith, J. Mater. Chem. A, 2016, 4, 6842–6852 RSC.
- K. Zhang, C. Liu, N. Graham, G. Zhang and W. Yu, Nano Energy, 2021, 87, 106217 CrossRef CAS.
- I. M. A. Omar, A. M. Al-Fakih, M. Aziz and K. M. Emran, Arabian J. Chem., 2021, 14, 102909 CrossRef CAS.
- Z. Zhang, Y. Wu and D. Zhang, Int. J. Hydrogen Energy, 2022, 47, 1425–1434 CrossRef CAS.
- L. Huang, F.-z. Yang, S.-k. Xu and S.-m. Zhou, Trans. IMF, 2017, 79, 136–139 CrossRef.
- J. G. Highfield, E. Claude and K. Oguro, Electrochim. Acta, 1999, 44, 2805–2814 CrossRef CAS.
- J. M. Jakšić, M. V. Vojnović and N. V. Krstajić, Electrochim. Acta, 2000, 45, 4151–4158 CrossRef.
- T. Wu, M. Ma, K. Ding, X. Nan, Z. Wang, X. Wei and X. Zhu, Int. J. Electrochem. Sci., 2023, 18, 100095 CrossRef CAS.
- Y. Wu, J. Lian, Y. Wang, J. Sun, Z. He and Z. Gu, Mater. Des., 2021, 198, 109316 CrossRef CAS.
- Y. Gao, Y. Wu, H. He and W. Tan, J. Colloid Interface Sci., 2020, 578, 555–564 CrossRef CAS PubMed.
- W. Liu, W. Tan, H. He and Y. Yang, Electrochim. Acta, 2022, 411, 140058 CrossRef CAS.
- J. Benson, M. Li, S. Wang, P. Wang and P. Papakonstantinou, ACS Appl. Mater. Interfaces, 2015, 7, 14113–14122 CrossRef CAS PubMed.
- Y. Xie, A. Miche, V. Vivier and M. Turmine, Appl. Surf. Sci., 2023, 635, 157693 CrossRef CAS.
- L. Li, S. Sheng, H. Wang, T. Qu, D. Hou, D. Wang and M. Sheng, Can. J. Chem. Eng., 2022, 100, 3381–3394 CrossRef CAS.
- G. Barati Darband, M. Aliofkhazraei and A. S. Rouhaghdam, J. Colloid Interface Sci., 2019, 547, 407–420 CrossRef CAS.
| This journal is © The Royal Society of Chemistry 2024 |

