 Open Access Article
Diffusion-driven growth of calcium carbonate polymorphs in microchannels†
Rebeka M. Ádám‡
a,
Paszkál Papp‡ a,
Dezső Horváth
 b and
Ágota Tóth
 *a
*a
aDepartment of Physical Chemistry and Materials Science, University of Szeged, Rerrich Béla tér 1., Szeged 6720, Hungary. E-mail: atoth@chem.u-szeged.hu
bDepartment of Applied and Environmental Chemistry, University of Szeged, Rerrich Béla tér 1., Szeged 6720, Hungary
First published on 17th December 2024
Abstract
We propose a novel approach to characterize the growth of individual crystals. Calcium chloride and sodium carbonate solutions have been injected into a Y-shaped microfluidic channel at various stoichiometric ratios, and the development of calcium carbonate has been monitored. The formation of calcite and vaterite depends not only on the stoichiometric ratio of the reactants but also on the region of the reactor where they form. From the crystal images, we have mapped the surface growth of the particles and have shown that closer to the confluence of the microchannel the crystal growth is significant. Both morphologies mainly form in the carbonate-rich zone, supported by numerical modeling. Moreover, the side growth of the calcite particles is diffusion-controlled and independent of the crystal orientation and the stoichiometric ratio of the reactants injected.
1 Introduction
Crystallization is an abundant phenomenon both in industrial processes and in nature. Precipitation reactions are used industrially to produce proteins,1 polymers,2 and paint pigments3 among other products, however, the formation of solid particles is not always beneficial, for example in the case of limescale4 or kidney stone5 accumulation. To improve the yield or the selectivity in industrial processes, or to decrease the growth of undesired crystals, a deeper understanding of crystallization is inevitable.6One way to comprehend the formation of the crystalline phase is to study its kinetics, which is typically divided into nucleation and growth processes. The birth of crystals can be quantitatively described by the nucleation time, which can be determined experimentally by monitoring the turbidity with a spectroscope,7–9 a fast camera,10 by focused beam reflectance count,11 or by conductivity measurements.12 There are various techniques, which provide more details on the growth of particles, such as the one developed by Mullin et al. by which the growth of crystal faces can be determined by a simple laboratory crystallization apparatus.13 More advanced methods use atomic force microscopy14 to capture the formation of single layers from solution.
Microfluidic devices can be advantageous when studying precipitation since they require small amounts of chemicals and offer well-defined fluid flow with an efficient heat and mass transfer compared to large-scale conventional techniques.15 Therefore, microchannels have been widely used in crystallization to synthesize active pharmaceutical ingredients,16 nanomaterials17 or to mimic and understand kidney stone formation.18
We have developed a strategy where it is possible to characterize the growth of individual crystals profoundly. Calcium carbonate has been selected as a model precipitate, since its flow-driven nucleation, growth,19 and polymorph selectivity20 in microchannels have already been studied. With our method, we aim to map the crystal surface growth profile in the entire channel. Moreover, we determine the growth of crystal faces separately and investigate the effect of flow direction and concentration on the development of particle sides. A numerical modeling study has also been carried out to corroborate the experimental findings.
2 Experimental
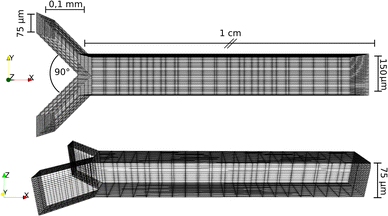
The growth of calcium carbonate particles was monitored using the experimental setup shown in Fig. 1. From the reactants, CaCl2·2H2O (VWR-Life Science, ACS) and Na2CO3 (Honeywell, ACS, ≥99.5%), 7.5 mM and 15 mM solutions were prepared. The pH of sodium carbonate solutions was set to 10 by the dropwise addition of 1 M HCl solution (VWR-Life Science, 37%) using a pH Meter (Thermo Orion). The reactant solutions were filtered with syringe filters (VWR) with a pore size of 0.22 μm. A commercially available microfluidic chip (microfluidic ChipShops, H-shaped Channel Chips) made out of poly(methyl methacrylate) served as the reactor. The cross-section of the reactor where the two reactants were pumped in was 75 μm × 75 μm, which at the confluence widened to 150 μm × 75 μm, and the channel length was 1 cm. The solutions were injected into the microchannel using a syringe pump (kdScientific Legato 180) with 0.5 μL min−1 flow rate per channel, naturally setting a time-independent concentration and pH gradient. To record the experiments, a camera (Nikon LV-TV) mounted on a microscope (Nikon Eclipse Ts2R) was utilized. From the recorded grayscale images various properties of the individual crystals on the bottom of the channel have been determined with an in-house program. The boundaries of particles have been localized from the grayscale minima and the cross section areas have been calculated using the Shoelace formula21 on the boundaries. In addition for calcite particles, a quadrilateral was fitted to the boundary points using Hough transformation,22 allowing the temporal monitoring of crystal edge/side evolution. The precise position of the crystals have been determined along the channel from the images using reference points.3 Modeling
Toward a deeper understanding of the experimental observations, numerical modeling of the spatiotemporal distribution before precipitation in a microchannel has been carried out mimicking the experiments where two miscible liquids (aqueous solutions of calcium chloride and sodium carbonate) are injected into the microreactor. In water carbonate ions can be protonated via the following reactions
 | (1) |
 | (2) |
 | (3) |
| H2O ⇌ H+ + OH−, | (4) |
| cC = [CO32−] + [HCO3−] + [H2CO3], | (5) |
| cCa = [Ca2+] + [CaOH+], | (6) |
 | (7) |
 | (8) |
Since the equilibrium reactions are much faster than the transport processes, the pre-equilibrium approximation can be applied to calculate the concentrations of the 7 species (CO32−, HCO3−, H2CO3, Ca2+, CaOH+, OH−, H+) from eqn (1)–(7) as cC, cCa, and [A−] are known.
The temporal change in the concentrations in the presence of transport processes is calculated by solving the differential mass balance equation for cC, cCa, and [A−]
 | (9) |
![[u with combining right harpoon above (vector)]](https://www.rsc.org/images/entities/i_char_0075_20d1.gif) = 0) has been used
= 0) has been used
 | (10) |
![[u with combining right harpoon above (vector)]](https://www.rsc.org/images/entities/i_char_0075_20d1.gif) is the velocity of the fluid flow, ν = 10−6 m2 s−1 is the kinematic viscosity of the liquid, and ρ is the solution density. Dilute solutions are used, therefore the densities are assumed to be equal.
is the velocity of the fluid flow, ν = 10−6 m2 s−1 is the kinematic viscosity of the liquid, and ρ is the solution density. Dilute solutions are used, therefore the densities are assumed to be equal.
The partial differential equations in eqn (9) and (10) are discretized and solved by OpenFoam software.23 An operator splitting technique is used where the convective and the diffusive terms are calculated separately, followed by an update of the concentration fields according to eqn (1)–(6) and (8) with the KINSOL module of the SUNDIALS software package.24,25 Finally, to obtain the spatiotemporal distribution of the supersaturation S at each time step, the concentrations of free calcium and carbonate ions in every cell were used to calculate the supersaturation S as
 | (11) |
The reactor was modeled with the same spatial dimensions as the one in the experiments (see Fig. 2). The inlet channels were discretized to (10, 20, 20), while the main one to (200, 40, 20) volume cells in (X, Y, Z) directions. At the walls, Zero Gradient boundary condition was used for the concentration fields and No Slip for the velocity. At the inlets and outlets, fixed values were set for the flow rate and the concentrations in accordance with the experiments. The densities of the species in these dilute solutions were set to ρ = 1000 kg m−3. As diffusion coefficients for cC, cCa and A−, 0.955 × 10⁻⁹, 0.793 × 10⁻⁹ and 2.03 × 10⁻⁹ m2 s−1 were used, respectively, the following equilibrium constants were set: pKH1 = 10.33, pKH2 = 6.35, log10(β) = 1.3, pKw = 14, pKsp = 8.35.26 For solving the differential equation (eqn (9) and (10)) Euler method was used with a step size of Δt = 1 × 10⁻⁴ s.
4 Results and discussion
4.1 Characterization of crystal formation
The crystal formation and its growth have been investigated in a microfluidic reactor at three different concentration ratios. The results are presented with microscopic images, where at the upper inlet of the Y-shaped channel CaCl2, while at the lower inlet, Na2CO3 solutions are injected. Fig. 3 shows the reactor at the confluence in the case of 2![[thin space (1/6-em)]](https://www.rsc.org/images/entities/char_2009.gif) :
:![[thin space (1/6-em)]](https://www.rsc.org/images/entities/char_2009.gif) 2 (a), 1
2 (a), 1![[thin space (1/6-em)]](https://www.rsc.org/images/entities/char_2009.gif) :
:![[thin space (1/6-em)]](https://www.rsc.org/images/entities/char_2009.gif) 2 (b), and 2
2 (b), and 2![[thin space (1/6-em)]](https://www.rsc.org/images/entities/char_2009.gif) :
:![[thin space (1/6-em)]](https://www.rsc.org/images/entities/char_2009.gif) 1 (c) stoichiometric ratios. At 2
1 (c) stoichiometric ratios. At 2![[thin space (1/6-em)]](https://www.rsc.org/images/entities/char_2009.gif) :
:![[thin space (1/6-em)]](https://www.rsc.org/images/entities/char_2009.gif) 2 composition, small particles form in the middle of the channel and a sharp line appears at the contact line due to the different refractive indexes of the solutions. In general, 10–20 larger and more isolated crystals nucleate in rhombohedral calcite morphology, except in the case of a 2
2 composition, small particles form in the middle of the channel and a sharp line appears at the contact line due to the different refractive indexes of the solutions. In general, 10–20 larger and more isolated crystals nucleate in rhombohedral calcite morphology, except in the case of a 2![[thin space (1/6-em)]](https://www.rsc.org/images/entities/char_2009.gif) :
:![[thin space (1/6-em)]](https://www.rsc.org/images/entities/char_2009.gif) 1 ratio, where 2–3 sphere-like vaterite particles also develop as confirmed by Raman microscopy (see Fig. S1 in ESI†). No amorphous calcium carbonate (ACC) or aragonite has been found throughout the experiments at the flow rate and solution composition used.
1 ratio, where 2–3 sphere-like vaterite particles also develop as confirmed by Raman microscopy (see Fig. S1 in ESI†). No amorphous calcium carbonate (ACC) or aragonite has been found throughout the experiments at the flow rate and solution composition used.
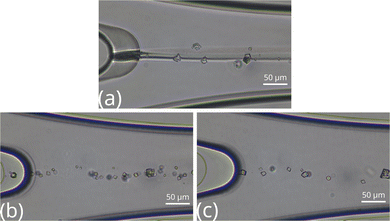 | ||
Fig. 3 Top view images of the microfluidic channel near the confluence at [Ca2+]![[thin space (1/6-em)]](https://www.rsc.org/images/entities/char_2009.gif) : :![[thin space (1/6-em)]](https://www.rsc.org/images/entities/char_2009.gif) [CO2−3] = 2 [CO2−3] = 2![[thin space (1/6-em)]](https://www.rsc.org/images/entities/char_2009.gif) : :![[thin space (1/6-em)]](https://www.rsc.org/images/entities/char_2009.gif) 2 (a), 1 2 (a), 1![[thin space (1/6-em)]](https://www.rsc.org/images/entities/char_2009.gif) : :![[thin space (1/6-em)]](https://www.rsc.org/images/entities/char_2009.gif) 2 (b), and 2 2 (b), and 2![[thin space (1/6-em)]](https://www.rsc.org/images/entities/char_2009.gif) : :![[thin space (1/6-em)]](https://www.rsc.org/images/entities/char_2009.gif) 1 (c) ratios. 1 (c) ratios. | ||
Fig. 4 depicts the top view of the reactor segment 5 mm far from the inlet with various chemical compositions. The contact line is invisible and only the larger crystals remain in the case of the 2![[thin space (1/6-em)]](https://www.rsc.org/images/entities/char_2009.gif) :
:![[thin space (1/6-em)]](https://www.rsc.org/images/entities/char_2009.gif) 2 stoichiometric ratio. Comparing the three images in Fig. 4, we find that, independently of the composition, particles tend to nucleate at the side where the Na2CO3 solution is injected into the reactor.
2 stoichiometric ratio. Comparing the three images in Fig. 4, we find that, independently of the composition, particles tend to nucleate at the side where the Na2CO3 solution is injected into the reactor.
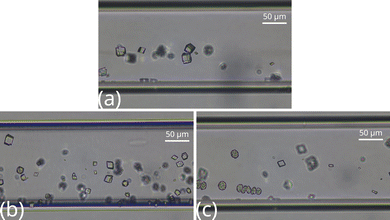 | ||
Fig. 4 Top view images of the middle part of the microfluidic channel at [Ca2+]![[thin space (1/6-em)]](https://www.rsc.org/images/entities/char_2009.gif) : :![[thin space (1/6-em)]](https://www.rsc.org/images/entities/char_2009.gif) [CO32−] = 2 [CO32−] = 2![[thin space (1/6-em)]](https://www.rsc.org/images/entities/char_2009.gif) : :![[thin space (1/6-em)]](https://www.rsc.org/images/entities/char_2009.gif) 2 (a), 1 2 (a), 1![[thin space (1/6-em)]](https://www.rsc.org/images/entities/char_2009.gif) : :![[thin space (1/6-em)]](https://www.rsc.org/images/entities/char_2009.gif) 2 (b), and 2 2 (b), and 2![[thin space (1/6-em)]](https://www.rsc.org/images/entities/char_2009.gif) : :![[thin space (1/6-em)]](https://www.rsc.org/images/entities/char_2009.gif) 1 (c) ratios. 1 (c) ratios. | ||
Most of the particles close to the outlet, presented in Fig. 5, also nucleate at the carbonate-rich zone but there are some particles in the more acidic, upper regions. The number of crystals is greater than in the other segments of the reactor. Moreover, vaterite crystals appear in the case of 2![[thin space (1/6-em)]](https://www.rsc.org/images/entities/char_2009.gif) :
:![[thin space (1/6-em)]](https://www.rsc.org/images/entities/char_2009.gif) 2 composition, suggesting spatial morphology control besides the stoichiometric composition-driven one.
2 composition, suggesting spatial morphology control besides the stoichiometric composition-driven one.
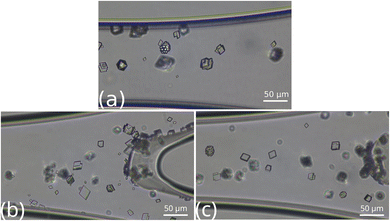 | ||
Fig. 5 Top view images of the microfluidic channel near the outlet at [Ca2+]![[thin space (1/6-em)]](https://www.rsc.org/images/entities/char_2009.gif) : :![[thin space (1/6-em)]](https://www.rsc.org/images/entities/char_2009.gif) [CO32−] = 2 [CO32−] = 2![[thin space (1/6-em)]](https://www.rsc.org/images/entities/char_2009.gif) : :![[thin space (1/6-em)]](https://www.rsc.org/images/entities/char_2009.gif) 2 (a), 1 2 (a), 1![[thin space (1/6-em)]](https://www.rsc.org/images/entities/char_2009.gif) : :![[thin space (1/6-em)]](https://www.rsc.org/images/entities/char_2009.gif) 2 (b), and 2 2 (b), and 2![[thin space (1/6-em)]](https://www.rsc.org/images/entities/char_2009.gif) : :![[thin space (1/6-em)]](https://www.rsc.org/images/entities/char_2009.gif) 1 (c) ratios. 1 (c) ratios. | ||
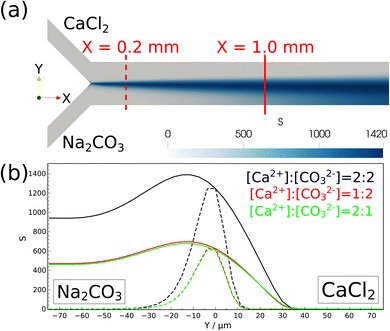
The experimental findings are corroborated with numerical modeling mimicking the experiments. The spatial distribution of the supersaturation S is calculated (see Fig. 6) since nucleation takes place where supersaturation is high. At a 2![[thin space (1/6-em)]](https://www.rsc.org/images/entities/char_2009.gif) :
:![[thin space (1/6-em)]](https://www.rsc.org/images/entities/char_2009.gif) 2 stoichiometric ratio, the highest supersaturation is at X = 0.2 mm from the confluence as shown by a dashed line in Fig. 6a, which explains the formation of small particles at the middle of the reactor close to the confluence in Fig. 3b.
2 stoichiometric ratio, the highest supersaturation is at X = 0.2 mm from the confluence as shown by a dashed line in Fig. 6a, which explains the formation of small particles at the middle of the reactor close to the confluence in Fig. 3b.
Farther from the inlet at X = 1.0 mm, supersaturation significantly increases in the region where sodium carbonate is injected, corroborating the experimental findings, where nucleation is found to be dominant at the carbonate-rich region (see Fig. 4). In this region the concentration of deprotonated carbonate ions is higher, hence supersaturation is reached sooner. Furthermore, supersaturation spreads out in the Y direction on moving away from the injection points (see Fig. 6a) due to the mixing effect of diffusion perpendicular to the flow. Therefore, close to the outlet particles can also nucleate at the calcium-rich zones as seen in the experiments in Fig. 5.
4.2 Characterization of crystal growth
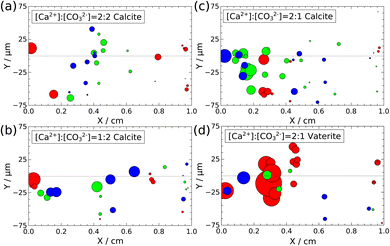
Three parallel experiments have been conducted for each stoichiometric ratio, and 4–22 crystals, which are at least 10 μm far from each other, so their growth is independent at the timescale of the experiments, have been selected for characterization. First, the temporal changes in the particle area in the XY-plane have been investigated. Since the cross section areas of calcites and the orthodrome area of vaterites change linearly with time, their growth rates are calculated from the slopes of their temporal evolution.Fig. 7 illustrates the location of the selected particles in the XY-plane with symbol sizes proportional to their growth rate. In all scenarios, the growth rate is the highest closer to the confluence and it is decreasing farther from it, dropping to only 1–2% at the outlet. This can be explained by the changes in the supersaturation, as S is the highest at the inlet of the channel and it gradually decreases towards the outlet. At high supersaturation areas not only nucleation but also growth are promoted. The surface growth rate of calcites varies on a large scale: the highest is in the range of 0.239 ± 0.002 μm2 s−1, while the smallest ones are in the range of 0.0071 ± 0.0001 μm2 s−1. In the case of vaterite, the growth rate of the orthodrome area is between 0.454 ± 0.002 μm2 s−1 and 0.023 ± 0.001 μm2 s−1. All the experimentally determined surface growth rates for both calcite and vaterite crystals are summarized in Tables S1–S4 of the ESI.†
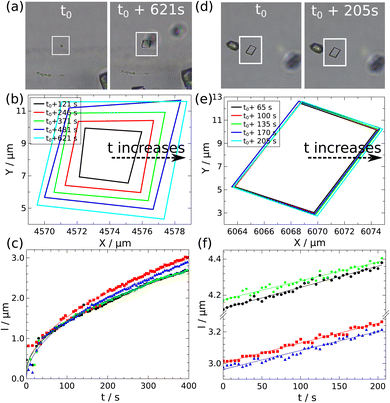
In the case of the calcite crystals, not only the surface growth rate but also the temporal change in each face size can be determined. The growth of the particle sides in the XZ- and YZ-planes can be substituted with the edge growth in the XY-plane. Two calcite crystals are presented in Fig. 8 as typical examples: in the left one (Fig. 8a) the edges grow significantly, while in the right one (Fig. 8d) barely. The former grows approximately 1.5 μm under 200 s, while the latter only 0.2 μm during the same time interval. Moreover, the growth profiles of their sides are distinctly different by comparing the two crystals. The sides grow together as shown in Fig. 8b which results in a regular rhomboidal shape, and the temporal change in the length of the edges of the crystal is proportional to the square root of time (Fig. 8c), which indicates diffusion control.27 In the case of the other particle (Fig. 8d) the faces grow linearly and in pairs as illustrated in Fig. 8f, therefore, the crystal shape is more elongated. The linear growth is only observed when particle growth is monitored from a larger initial size (l > 10 μm). However, the linearity may be apparent, since the final part of the square root growth seems linear on a short timescale.
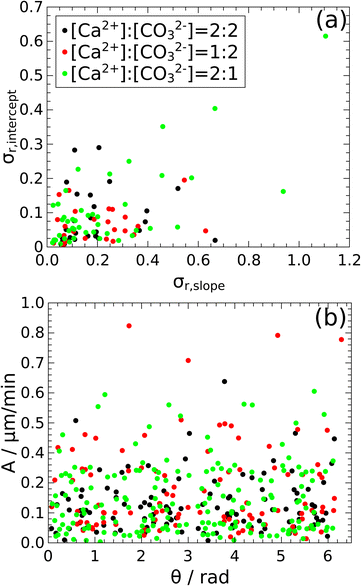
As seen from Fig. 8, the growth of the particle edges is not uniform (see the growth rates of all four different sides of the investigated particles summarized in Tables S5–S7 in the ESI†) as the faces can grow either together or in pairs resulting in rhomboid or less regular crystalline shapes, respectively. Therefore, we have also investigated what differentiates the growth of the edges and governs the final crystal shape. Since from previous studies,28 it had been shown for lithium phosphate precipitates grown at 2–4 μL min−1 flow rates, that in microfluidic channels the direction of the crystal growth is influenced by the flow of the solutions, we have created Fig. 9 to study this effect. The relative standard deviations of the intercept are plotted as a function of the relative standard deviations of the slope in Fig. 9a, which have been obtained from the fitting of the growth of the four sides of the particle. The slopes of the fittings have been used as ordinates in Fig. 9b, while on the abscissa the angle between the fluid flow direction and the crystal face is shown. The symbols corresponding to the three experimental compositions are scattered with no formation of any groups in either presentation suggesting that the growth of the crystal faces in the XY-plane is independent of their orientation compared to the flow direction and of the stoichiometric ratios at the flow condition applied. Moreover, most of the crystal edge growth is below 0.3 μm s−1.
5 Conclusion
We have studied the formation and have characterized the growth of individual calcium carbonate particles in a microfluidic reactor into which calcium chloride and sodium carbonate have been injected at [Ca2+]![[thin space (1/6-em)]](https://www.rsc.org/images/entities/char_2009.gif) :
:![[thin space (1/6-em)]](https://www.rsc.org/images/entities/char_2009.gif) [CO2−3] = 2
[CO2−3] = 2![[thin space (1/6-em)]](https://www.rsc.org/images/entities/char_2009.gif) :
:![[thin space (1/6-em)]](https://www.rsc.org/images/entities/char_2009.gif) 2, 1
2, 1![[thin space (1/6-em)]](https://www.rsc.org/images/entities/char_2009.gif) :
:![[thin space (1/6-em)]](https://www.rsc.org/images/entities/char_2009.gif) 2, and 2
2, and 2![[thin space (1/6-em)]](https://www.rsc.org/images/entities/char_2009.gif) :
:![[thin space (1/6-em)]](https://www.rsc.org/images/entities/char_2009.gif) 1 stoichiometric ratios. Mostly calcite crystals appear in the microchannel along the flow direction, except at a 2
1 stoichiometric ratios. Mostly calcite crystals appear in the microchannel along the flow direction, except at a 2![[thin space (1/6-em)]](https://www.rsc.org/images/entities/char_2009.gif) :
:![[thin space (1/6-em)]](https://www.rsc.org/images/entities/char_2009.gif) 1 stoichiometric ratio, where vaterite particles are also present as confirmed by Raman microscopy. The majority of the crystals form on the side of the carbonate-rich zone where supersaturation is at maximum and corroborated by numerical calculations.
1 stoichiometric ratio, where vaterite particles are also present as confirmed by Raman microscopy. The majority of the crystals form on the side of the carbonate-rich zone where supersaturation is at maximum and corroborated by numerical calculations.
With the use of our experimental setup and in-house evaluation software, we have quantified the surface growth of the particles. From the positions of the crystals in the reactor we have found that the growth is linear and it is dominant close to the confluence. The growth rates of each side of calcite particles scale with the square root of time, i.e., they are diffusion-driven. Furthermore, at the applied injection rates the growth is independent of both the crystal orientation and the solution composition. Further studies would be necessary to investigate the possible effect of shear on the crystal growth for individual particles.
We believe that the developed method is useful in other experimental setups to determine the surface growth of crystals or to obtain the growth rates of individual faces in the case of even irregularly shaped crystals. These data can be further implemented in theoretical dynamic studies as valuable constant parameters.
Data availability
The data supporting this article have been included in the main text and in the ESI.†Author contributions
R. M. Á.: investigation, formal analysis, visualization P. P.: investigation, software, formal analysis, writing – original draft D. H.: conceptualization, software, methodology, supervision Á. T.: conceptualization, methodology, supervision, funding acquisition. All authors edited and reviewed the text.Conflicts of interest
There are no conflicts to declare.Acknowledgements
The authors thank the financial support from the National Research, Development, and Innovation Office (K138844 and TKP2021-NVA-19). P. P. acknowledges the support from the New National Excellence Program of the Ministry for Culture and Innovation from the source of the National Research, Development, and Innovation Fund (ÚNKP-23-3-SZTE-492). The authors are also grateful to Ádám Balog for carrying out the Raman microscopy measurements. The authors thank the University of Szeged Open Access Fund (7391) for support. We acknowledge the KIFÜ's HPC supercomputing infrastructure.References
- H. Huettmann, S. Zich, M. Berkemeyer, W. Buchinger and A. Jungbauer, Design of industrial crystallization of interferon gamma: Phase diagrams and solubility curves, Chem. Eng. Sci., 2015, 126, 341–348 CrossRef.
- W. Zhang, H. Zhang, L. Yang, Y. Tang and P. Tang, Enhanced crystallization and properties of poly(ethylene terephthalate) nanocomposites with zeolites from 3D to 2D topologies, J. Ind. Eng. Chem., 2022, 109, 510–520 CrossRef.
- S. Švarcová, E. Kočí, P. Bezdička, S. Garrappa, L. Kobera, J. Plocek, J. Brus, M. Šťastný and D. Hradil, Uncovering lead formate crystallization in oil-based paintings, Dalton Trans., 2020, 49, 5044–5054 RSC.
- D. Georgiou, D. Bendos, M. Kalis and C. Koutis, Removal and/or prevention of limescale in plumbing tubes by a radio-frequency alternating electric field inductance device, J. Water Process Eng., 2018, 22, 34–40 CrossRef.
- F. L. Coe, A. Evan and E. Worcester, Kidney stone disease, J. Clin. Invest., 2005, 115, 2598–2608 CrossRef CAS PubMed.
- J. Ulrich and M. Jones, Industrial crystallization: Developments in research and technology, Chem. Eng. Res. Des., 2004, 82, 1567–1570 CrossRef CAS.
- M. Emmanuel, P. Papp, G. Schuszter, A. Deák, L. Janovák, A. Tóth and D. Horváth, Nucleation kinetics of lithium phosphate precipitation, CrystEngComm, 2022, 24, 4447–4453 RSC.
- N. P. Das, R. Zahorán, L. Janovák, A. Deák, A. Tóth, D. Horváth and G. Schuszter, Kinetic characterization of precipitation reactions: Possible link between a phenomenological equation and reaction pathway, Cryst. Growth Des., 2020, 20, 7392–7398 CrossRef.
- W. Guo, W. Xia, K. Cai, Y. Wu, B. Qiu, Z. Liang, C. Qu and R. Zou, Kinetic-controlled formation of bimetallic metal–organic framework hybrid structures, Small, 2017, 13, 1702049 CrossRef PubMed.
- R. Zahorán, A. Kukovecz, A. Tóth, D. Horváth and G. Schuszter, High-speed tracking of fast chemical precipitations, Phys. Chem. Chem. Phys., 2019, 21, 11345–11350 RSC.
- J. Schöll, L. Vicum, M. Müller and M. Mazzotti, Precipitation of L-glutamic acid: Determination of nucleation kinetics, Chem. Eng. Technol., 2006, 29, 257–264 CrossRef.
- T. Maqbool, P. Srikiratiwong and H. S. Fogler, Effect of temperature on the precipitation kinetics of asphaltenes, Energy Fuels, 2011, 25, 694–700 CrossRef.
- J. W. Mullin and A. Amatavivadhana, Growth kinetics of ammonium- and potassium-dihydrogen phosphate crystals, J. Appl. Chem., 1967, 17, 151–156 CrossRef.
- S. Verma and P. J. Shlichta, Imaging techniques for mapping solution parameters, growth rate, and surface features during the growth of crystals from solution, Prog. Cryst. Growth Charact. Mater., 2008, 54, 1–120 CrossRef.
- A. Saikia, R. Newar, S. Das, A. Singh, D. J. Deuri and A. Baruah, Scopes and challenges of microfluidic technology for nanoparticle synthesis, photocatalysis and sensor applications: A comprehensive review, Chem. Eng. Res. Des., 2023, 193, 516–539 CrossRef.
- R. Fortt, R. Tona, P. M. Martin-Soladana, G. Ward, D. Lai, J. Durrant and N. Douillet, Extractive crystallization of cabotegravir in droplet-based microfluidic devices, J. Cryst. Growth., 2020, 552, 125908 CrossRef.
- P. R. Makgwane and S. S. Ray, Synthesis of nanomaterials by continuous-flow microfluidics: a review, J. Nanosci. Nanotechnol., 2014, 14, 1338–1363 CrossRef PubMed.
- S. Bourg, K. Rakotozandriny, I. T. Lucas, E. Letavernier, C. Bonhomme, F. Babonneau and A. Abou-Hassan, Confining calcium oxalate crystal growth in a carbonated apatite-coated microfluidic channel to better understand the role of Randall's plaque in kidney stone formation, Lab Chip, 2024, 24, 2017–2024 RSC.
- L. Li, J. R. Sanchez, F. Kohler, A. Røyne and D. K. Dysthe, Microfluidic control of nucleation and growth of CaCO3, Cryst. Growth Des., 2018, 18, 4528–4535 CrossRef CAS.
- Y. Zeng, J. Cao, Z. Wang, J. Guo and J. Lu, Formation of amorphous calcium carbonate and its transformation mechanism to crystalline CaCO3 in laminar microfluidics, Cryst. Growth Des., 2018, 18, 1710–1721 CrossRef CAS.
- B. Braden, The surveyor's area formula, Coll. Math. J., 1986, 17, 326–337 CrossRef.
- R. O. Duda and P. E. Hart, Use of the Hough transformation to detect lines and curves in pictures, Commun. ACM, 1972, 15, 11–15 CrossRef.
- H. G. Weller, G. Tabor, H. Jasak and C. Fureby, A tensorial approach to computational continuum mechanics using object-oriented techniques, Comput. Phys., 1998, 12, 620–631 CrossRef.
- D. J. Gardner, D. R. Reynolds, C. S. Woodward and C. J. Balos, Enabling new flexibility in the SUNDIALS suite of nonlinear and differential/algebraic equation solvers, ACM Trans. Math. Softw., 2022, 48, 1–24 CrossRef.
- A. C. Hindmarsh, P. N. Brown, K. E. Grant, S. L. Lee, R. Serban, D. E. Shumaker and C. S. Woodward, SUNDIALS: Suite of nonlinear and differential/algebraic equation solvers, ACM Trans. Math. Softw., 2005, 31, 363–396 CrossRef.
- S. Kotrly and L. Šucha, Handbook of Chemical Equilibria in Analytical Chemistry, Ellis Horwood Ltd, 1985 Search PubMed.
- K. Ananth, J. P. Kavanagh, R. C. Walton and P. N. Rao, Enlargement of calcium oxalate stones to clinically significant size in an in-vitro stone generator, BJU Int., 2002, 90, 939–944 CrossRef.
- M. Emmanuel, D. Horváth and A. Tóth, Flow-driven crystal growth of lithium phosphate in microchannels, CrystEngComm, 2020, 22, 4887–4893 RSC.
Footnotes |
| † Electronic supplementary information (ESI) available. Raman spectra of the polymorphs, the surface and the side growth rates of the particles. See DOI: https://doi.org/10.1039/d4ra07137a |
| ‡ These authors contributed equally to this work. |
| This journal is © The Royal Society of Chemistry 2024 |


