 Open Access Article
Study on the mechanism of grain size and residual stress coupling distribution on the intergranular corrosion susceptibility of AZ31B magnesium alloy
Xiangyu Lia,
Baoji Ma *a,
Bin Liub,
Liangliang Lia,
Jinkui Caoa and
Chaopeng Xua
aSchool of Mechatronic Engineering, Xi'an Technological University, No.2 Xuefuzhonglu Road, Xi'an 710021, China. E-mail: mabaojee@163.com
bSchool of Mechanical and Electrical Engineering, Tongchuan Vocation and Technical College, No.8 Chaoyang Road, Tongchuan 727000, China
First published on 9th December 2024
Abstract
In this paper, homogenization heat treatment and laser shock peening (LSP) processes were successfully carried out regulate the microstructure (grain size, residual stress, and element distribution, etc.) of the AZ31B magnesium alloy substrate surface. Based on the regulated AZ31B magnesium alloy substrate surface, it further explored and analyzed the mechanism and influence pattern of the coupling distribution of grain size and residual stress on the intergranular corrosion susceptibility of the substrate surface. Scanning electron microscopy (SEM) was used to observe the surface morphology, scanning Kelvin probe force microscopy (SKPFM) to observe the surface potential, zero resistance ammeter (ZRA) and scanning vibrating electrode technique (SVET) to measure the galvanic current on the surface, and electrochemical tests were conducted to evaluate its surface corrosion behavior. The experimental results showed that in the residual tensile stress region (large grain region), tensile stress expanded the cracks on both sides of the grain boundaries, allowing corrosive media to penetrate deeper into the material. Under tensile stress, corrosion cavities expanded along grain boundaries and potentially connected to other areas via intragranular microcracks, highlighting the pronounced initiation of corrosion cavities. In areas with residual compressive stress (fine grain regions), the corrosion reaction rate at the grain boundaries decreased, and the initiation of corrosion cavities was delayed or slowed down, resulting in a more uniform corrosion surface. The coupling effect of grain size and residual stress exhibited an inhibitory effect on the initiation of corrosion cavities and corrosion susceptibility at the grain boundaries. Overall, this paper provides an important reference for further understanding and controlling the corrosion resistance of AZ31B magnesium alloy.
1. Introduction
Magnesium and its alloys have become promising orthopedic repair materials in the field of medical implants due to their appropriate mechanical strength, excellent biodegradable properties, and good biocompatibility.1–3 However, their excessively high corrosion rate prematurely destroys the integrity and mechanical properties of magnesium alloys, greatly limiting their wide application.4–6 AZ series magnesium alloys (such as AZ31 and AZ91) have been widely considered for biomedical applications. However, increased levels of Al3+ in the body may increase the risk of Alzheimer's disease. Compared with other AZ alloys, AZ31 alloy, which contains only 3% Al, is considered more suitable as a biodegradable material.7 In recent years, researchers have been committed to improving the corrosion resistance of magnesium alloys without changing their elemental composition. As stated in the Hall–Petch relationship,8 grain refinement leads to increased mechanical strength. This can be achieved through severe plastic deformation (SPD), which mainly reduces grain size and increases dislocation density without altering the chemical composition.9,10 Furthermore, plastic deformation of the material surface due to mechanical strength is accompanied by the generation of residual stress. Residual stress has characteristics such as inconspicuous morphological features and difficult measurement. Currently, there is no clear elaboration on the electrochemical corrosion behavior and corrosion mechanism of alloy materials under the effect of residual stress both domestically and internationally.Researchers are dedicated to establishing the relationship between material grain size and corresponding corrosion response. Different magnesium alloy systems may yield different conclusions. For example, Aung et al.11 studied the effects of grain size and twins on the corrosion behavior of AZ31B magnesium alloy. The results showed that the influence of grain size was more pronounced in the corrosion of non-twin structures. As the average grain size increased from 65 μm to 250 μm, the corrosion rate significantly increased by 30%. Kim et al.12 prepared ultrafine-grained (1.1–1.5 μm) AZ61 alloy containing nanoscale β-Mg17Al12 phase particles (70–140 nm) using high-ratio differential speed rolling (HRDSR) and studied their corrosion behavior in 0.1 M NaCl solution. The reduction in grain size by HRDSR improved corrosion resistance by enhancing the passivation of the surface film. After annealing, the corrosion resistance was further improved by reducing the dislocation density in the matrix. However, when significant grain growth occurred, the corrosion resistance decreased due to the obvious negative impact of increased grain size. Huai et al.13 obtained similar experimental results by adding different contents of Gd element to Mg–0.5Zr–1.8Zn alloy. When the Gd content was 0–1.5 wt%, the alloy grain size decreased with increasing Gd content. Experiments showed that in SBF solution, corrosion products accumulated on the alloy surface to form a relatively dense corrosion product film, which effectively retarded the corrosion process. When the Gd content exceeded 1.5 wt%, eutectic phases precipitated at the grain boundaries, forming micro-galvanic couples with the matrix, which accelerated the corrosion process. Bazhenov et al.14 showed that the grain size of extruded Mg–2Zn–0.7Ca alloy was smaller than that of Mg–4Zn–0.7Ca alloy, and the corrosion rate after soaking in Hank's solution for 192 h was about half of that of Mg–4Zn–0.7Ca alloy.
Although the aforementioned studies suggest that grain refinement may positively impact the corrosion resistance of magnesium alloys, some researchers hold differing views. These alternative viewpoints emphasize the diversity of corrosion behavior in grain-refined magnesium alloys, noting that grain refinement does not always enhance the corrosion resistance of magnesium. Ahmadkhaniha et al.15 effectively refined the grain size of cast pure magnesium to a few micrometers using High-Pressure Torsion (HPT) processing and created a foundational texture on the surface. However, the results showed no improvement in the corrosion resistance of pure magnesium in a 3.5 wt% NaCl solution. The presence of residual stresses or the introduction of high dislocation densities were deemed to have a greater influence on corrosion behavior than grain size or texture. Therefore, further experiments are recommended to more fully characterize the corrosion resistance of pure magnesium after HPT treatment. Kwang Seon Shin et al.16 studied the effect of grain size on the corrosion rate of magnesium alloys and established a model to predict corrosion rates based on microstructural parameters. The study revealed that in single-crystal or bicrystal scenarios, the corrosion rate increases with grain size. For very fine grains (less than 50 μm), the corrosion rate increases as grain size decreases. Luo et al.17 investigated the corrosion behavior of extruded Mg–6Gd–2Y–0.2Zr alloy in a 5% NaCl solution with saturated Mg(OH)2 at room temperature over different durations. The study found that initial corrosion areas were concentrated mainly at sites with non-basal small particles. A relationship similar to the Hall–Petch formula was proposed for the corrosion rate and average grain size: Ecorr = A + Bd−0.5, where A and B are constants. When passivation occurs, smaller grains exhibit better corrosion resistance, resulting in a negative B value; otherwise, B is positive. The influence of grain size on the corrosion behavior of magnesium alloys depends on whether passivation occurs. This relationship can be used to compare the corrosion rates of alloys with different average grain sizes and to reveal the corrosion behavior of grains with different sizes on a single corroded surface.
There are relatively few reports on the study of residual stress effects on alloy corrosion behavior and mechanisms. Xu J.18 reported on the initial corrosion behavior of Ti35 alloy with different micro-residual stresses in a 6 mol L−1 boiling nitric acid solution. Electrochemical Impedance Spectroscopy measurements and quantitative X-ray Photoelectron Spectroscopy analysis indicated that micro-scale residual stress concentrations accelerated the dissolution of Ti2+, Ti3+, and Ta5+ ions within the first 48 hours. After 48 hours, the formed oxide film (TiO2-51%, Ti2O3-47%, Ta2O3-1.9%) had consistent composition and content, preventing the corrosion medium from reaching the outer surface of the metal substrate and reducing the impact of residual stress on corrosion behavior. Kumar et al.19 studied the corrosion behavior of Ti6Al4V alloy after laser peening in a HCl environment using potentiodynamic polarization. The study showed that laser shocking (wavelength: 532 nm) enhanced the corrosion resistance of Ti6Al4V samples. Key features included surface oxide layers, residual stresses, and partial grain refinement. Residual compressive stress was identified as the reason for inhibiting the transfer of metal ions in the alloy matrix. Overall, the influence of grain size on alloy corrosion is primarily reflected in the intergranular corrosion process. However, researchers have differing opinions on the effect of the coupling of grain size and residual stress on the intergranular corrosion of magnesium alloys. Although these phenomena have been observed, the exact causes remain unclear.
Drawing from the current research, three key questions arise: (i) how does the coupling effect of grain size and residual stress affect the element distribution in the AZ31B magnesium alloy matrix? (ii) How does the coupling effect of grain size and residual stress influence the intergranular corrosion behavior of AZ31B magnesium alloy? (iii) How can the intergranular corrosion model of AZ31B magnesium alloy under the coupling effect of grain size and residual stress be formulated? Addressing these questions to reveal the behavior and mechanism of AZ31B magnesium alloy during intergranular corrosion under the coupling effect of grain size and residual stress holds considerable significance for improving the corrosion performance of magnesium alloys. In this study, cast AZ31B alloy sheets were initially subjected to homogenization heat treatment, and the grain size and residual stress distribution in the AZ31B magnesium alloy matrix were adjusted through laser peening. Furthermore, in order to explore the influence of coupled grain size and residual stress distributions on corrosion behavior in the AZ31B magnesium alloy matrix, microstructural characterization and corrosion resistance tests were conducted on AZ31B magnesium alloy samples upon immersion in SBF solution (37 ± 0.1 °C).
2. Materials and methods
2.1 Preparation and treatment of materials
This paper uses cast AZ31B magnesium alloy to avoid the influence of the original sample microstructure (such as grain size, grain boundary density, residual stress distribution, etc.) on corrosion. The specific chemical composition content (by weight) meets national standards (GBT5153-2003). The composition ratio of the cast AZ31B alloy is shown in Table 1, with sample dimensions of 10 × 10 × 5 mm3. The samples after uniform heat treatment by laser shock (YS1505-R200EA, China, Tyrida) are denoted as T-2 and T-3. For T-1 samples, the treatment temperature was 520 °C for 4 hours, followed by cooling to room temperature in the furnace. Treatment parameters for T-2 samples: laser power of 2.83 GW cm−2, 1 impact, 50% spot overlap, and homogenization heat treatment at 520 °C for 4 hours. Treatment parameters for T-3 samples: laser power of 4.95 GW cm−2, 1 impact, 50% spot overlap, and homogenization heat treatment at 520 °C for 4 hours. The purpose of sample preparation was to adjust the grain size morphology and residual stress distribution in the matrix. After preparation, no significant differences were detected in the second-phase content of the AZ31B samples, so this is not discussed in detail in this paper.| Element | Al | Zn | Mn | Si | Ca | Cu | Ni | Fe | Mg |
|---|---|---|---|---|---|---|---|---|---|
| Percent (wt%) | 3.2 | 1.4 | 0.7 | 0.07 | 0.04 | 0.01 | 0.001 | 0.003 | Bal |
2.2 Microstructure analysis
The sample surfaces were polished progressively using #1000 to #5000 metallographic sandpapers, followed by mirror polishing with W1.0 diamond polishing paste. The polished samples were then ultrasonically cleaned in a CH3CH2OH solution. They were etched using a metallographic etching solution (10 mL nitric acid + 70 mL acetic acid + 10 mL distilled water + 4.2 g picric acid) for 5–15 seconds. The samples were immersed in SBF solution at 37 ± 0.1 °C without aeration. The composition of the SBF solution is shown in Table 2, with a pH value of 7.4, a dissolved oxygen content of 6–8 mg L−1, and a conductivity of 12–15 mS cm−1, ensuring appropriate ionic conductivity. To observe the corrosion morphology, the corrosion products on the sample surfaces were removed by immersing them in a chromic acid solution (200 g L−1 CrO3 + 10 g L−1 AgNO3) for 5 minutes. The microstructure before and after LSP treatment was characterized using a Nikon optical microscope (LV100ND, Japan, Nikon) and a Zeiss electron backscatter diffraction (EBSD) system (SIGMA 300S, Germany, Zeiss). Preparation of Samples for EBSD Observation: The surface of the AZ31B magnesium alloy was polished and prepared using argon ion polishing to obtain samples suitable for EBSD analysis. During EBSD testing, a working voltage of 20 kV was used, and the scanning step size was set to 0.4 μm. The obtained data were processed using software such as HKL-CHANNEL5. Microstructure observation and composition analysis were performed using an environmental scanning electron microscope (XL30 FEG ESEM, America, FEI) equipped with an energy dispersive spectroscopy (EDS) system. The acceleration voltage was set to 20 kV, and the beam spot diameter was 4 μm. X-ray diffraction (XRD) analysis of the strengthened surface of the samples was performed at room temperature using an X-ray diffractometer (D8 ADVANCE, Germany, Bruker Nano Inc.). The target material was Cu-Kα, with a testing angle range (2θ) of 20–80° and a scanning rate of 1° min−1. Phase analysis was conducted using MDI JADE software. The chemical composition of corrosion products on magnesium alloy surface was characterized by X-ray photoelectron spectroscopy (XPS) (K-Alpha, America, Scientific). The position of each characteristic peak in the XPS data was corrected with the standard C 1s peak (284.8 eV).| Component | Na+ | K+ | Mg2+ | Ca2+ | Cl− | HCO3− | HPO42− | SO42− |
|---|---|---|---|---|---|---|---|---|
| Percent (%) | 142.0 | 5.0 | 1.5 | 2.5 | 103.0 | 10.0 | 1.0 | 0.5 |
2.3 SKPFM
The Volta potential difference between the matrix and the second phase of the sample was measured in work function mode using a scanning Kelvin probe force microscope (SKPFM) (Multimode 8, Germany, Bruker Nano Inc.). SKPFM testing is a technique for measuring surface potential at the nanoscale. When the probe AFM contacts the sample surface, charge transfer will cause a potential to form on the surface. By measuring the potential difference between the probe and the sample, the local potential distribution of the sample surface can be determined.2.4 Electrochemical tests
To compare the corrosion behavior of AZ31B magnesium alloy samples, two different techniques were used to detect the differences in the corrosion process of the coupled T-1, T-2, and T-3 samples: zero-resistance ammeter (ZRA) (CHI600E, China, Chen Hua) and scanning vibrating electrode technique (SVET) (VersaScan, America, PAR). The corrosion medium was a simulated body fluid solution at 37 ± 0.1 °C. ZRA measurements were conducted using the CHI600E electrochemical testing system. T-1, T-2, and T-3 samples were respectively connected to wires, encapsulated with epoxy resin, and polished to expose a detection area of 100 mm2. In the first set of experiments, the T-1 sample was connected to the ground wire of the electrochemical workstation, and the T-2 sample was connected to the electrode end of the electrochemical workstation. In the second set of experiments, the T-2 sample was connected to the ground wire of the electrochemical workstation, and the T-3 sample was connected to the electrode end of the electrochemical workstation. The electrochemical workstation measured the current every 5 seconds, with a total measurement time of 2 hours.SVET tests were conducted using the VersaScan micro-area scanning electrochemical workstation. The samples were coupled using conductive silver paste, connected with wires, encapsulated with epoxy resin, and polished to expose a detection area of 200 mm2 (mirror effect). The SVET test area was 200 mm2, and the test duration was 1 hour and 2 hours. The SVET test was performed in SBF solution (37 ± 0.1 °C) with the probe tip at a distance of 50 μm from the sample. The scanning vibrating electrode probe used a Pt–Ir microelectrode with a tip diameter of 16 μm and an amplitude of 20 μm.
Electrochemical measurements were conducted in SBF solution (37 ± 0.1 °C) using a PARSTAT electrochemical workstation (VersaScan, America, PAR). A three-electrode sealed electrochemical cell was used, with a saturated calomel electrode (SCE) as the reference electrode and a platinum electrode as the auxiliary electrode. The electrochemical corrosion sample was connected to a copper wire, encapsulated with epoxy resin, and polished to expose a detection area of 100 mm2. The scanning speed of the potentiodynamic polarization curve test was 1.0 mV S−1, using separate scanning for anodic and cathodic polarizations to reduce the impact of hydrogen evolution during corrosion. The electrochemical impedance spectroscopy curve test was conducted in the frequency range of 0.1 Hz to 100 kHz, with a sinusoidal wave of 5 mV amplitude as the excitation signal. The data was fitted using ZsimpWin software. Considering stable electrolytes and eliminating initial interference, the electrochemical tests were delayed by 10 minutes during testing. All electrochemical tests were repeated 2–3 times following the same procedure to ensure the accuracy of the results.
3. Results
3.1 Microstructure characterization
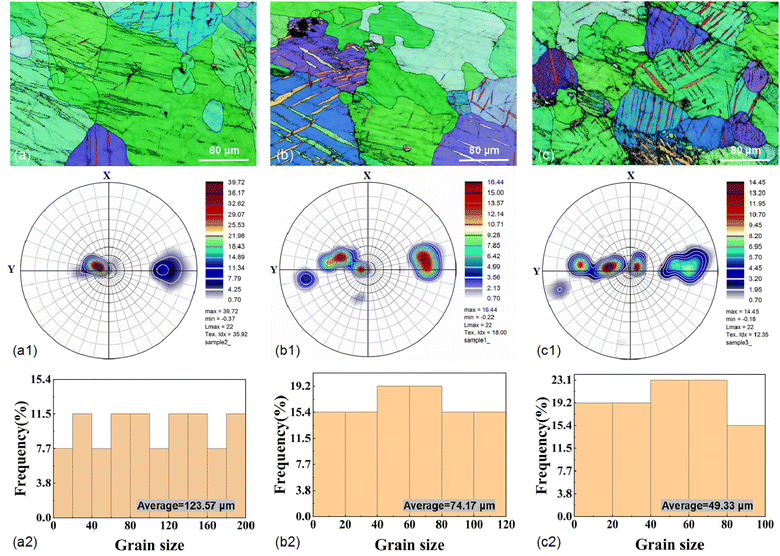
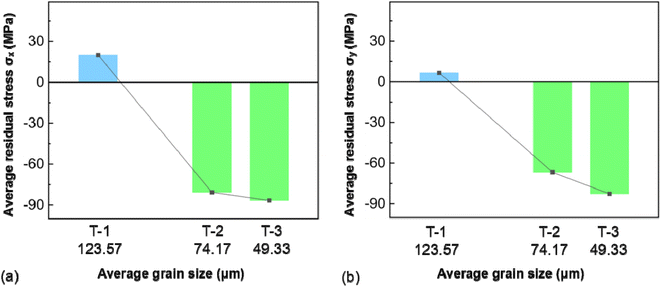
EBSD tests were conducted on the AZ31B magnesium alloy samples before corrosion immersion, as shown in Fig. 1. As clearly shown in Fig. 1(b) and (c), a small amount of twins were successfully induced on the pre-corrosion surfaces of T-2 and T-3 samples after laser shocking (the influence of twins on the corrosion process is negligible and thus excluded from this analysis. The recent publications by the present research group detail the mechanisms of twin effects in corrosion processes). Strong base textures were observed in the samples from the IPFs and PFs. According to Fig. 1(a2), (b2), and (c2), grain size distributions were as follows: 0–60 μm range had T-1 at 26.88%, T-2 at 49.99%, T-3 at 61.53%; 60–100 μm range had T-1 at 23.06%, T-2 at 34.58%, T-3 at 38.45%; 100–120 μm range had T-1 at 7.69%, T-2 at 15.38%; and the 120–200 μm range had T-1 at 42.28%. The average grain sizes of AZ31B magnesium alloy T-1, T-2, and T-3 samples were 123.57 μm, 74.17 μm, and 49.33 μm, respectively. This indicated the highest grain refinement effect of the T-3 sample with a laser power of 4.95 GW cm−2.Based on the surface residual stress test results of the samples, as shown in Fig. 2, the maximum residual compressive stress deviation values on the x-direction surface of the specimen were: 3.46 MPa (T-1), 5.19 MPa (T-2), and 5.19 MPa (T-3), while on the y-direction surface they were: 3.46 MPa (T-1), 5.19 MPa (T-2), and 3.46 MPa (T-3), with a smaller standard deviation indicating higher consistency in the measurements. The maximum residual compressive stress error bar values on the x-direction surface of the specimen were: −16 ± 2 MPa (T-1), −90 ± 3 MPa (T-2), and −103 ± 3 MPa (T-3), which were: −6 ± 2 MPa (T-1), −88 ± 3 MPa (T-2), and −93 ± 2 MPa (T-3) on the y-direction surface. The test results indicated that LSP treatment could effectively alter the surface stress distribution in the material, with residual stress transitioning from tensile to compressive on the sample surface due to shock wave impacts. At the same time, a coupling effect was also observed between grain size and residual stress distribution. As shown in Fig. 3, as the grain size decreased, the residual stress decreased gradually, and grain refinement also induced the redistribution of residual stress. Grain boundaries acted as obstacles to dislocations. Reducing grain size in AZ31B magnesium alloy caused dislocations to be “blocked” at grain boundaries, impeding their movement across these boundaries and thus influencing the localized residual stress concentration. As the grains were refined and the number of grain boundaries increased, the propagation and movement of dislocations within the material matrix became more restricted. The stress interactions between grain boundaries allowed the stress to redistribute over a broader area, further reducing the local stress concentration on the surface of the AZ31B magnesium alloy matrix.
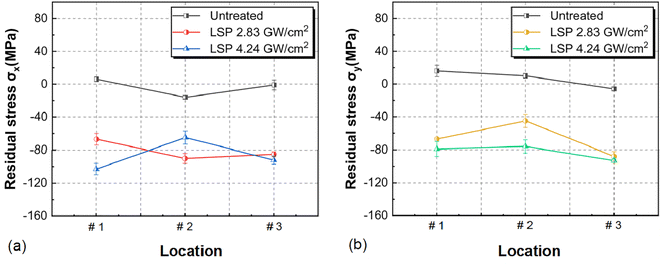 | ||
| Fig. 2 Residual stress on the surface of AZ31B magnesium alloy sample: (a) residual stress distribution in the σx direction; (b) residual stress distribution in the σy direction. | ||
The SEM-EDS micrographs of the AZ31B magnesium alloy sample surface are shown in Fig. 4. Fig. 4(a)–(c) correspond to AZ31B magnesium alloy T-1, T-2, and T-3 samples, respectively. As depicted in Fig. 4(a)–(a2), the Mn, Zn, C, and O elements were relatively lower inside the grains (#1 and #2 positions) of the T-1 sample compared to the grain boundaries (#3 and #4 positions), with Mg showing an opposite distribution. This was due to the low solid solubility of Mn in magnesium alloys, leading to its segregation to grain boundaries as Mn-rich phases during solidification. However, Mn had a strong tendency to precipitate, forming secondary phases near grain boundaries, which might affect the local electrochemical properties of the grain boundaries. Zn could increase the strength of the alloy and also tended to segregate to grain boundaries, forming Zn-rich regions or alloy phases (such as MgZn2) with other elements. Due to the higher energy at grain boundaries, Zn often segregated to grain boundaries, resulting in a higher Zn content at grain boundaries compared to inside the grains. C and O elements, typically present as impurities, tended to segregate at grain boundaries, potentially forming small compounds or oxide inclusions due to adsorption and binding at these high-energy sites, which could alter the electrochemical behavior of the grain boundaries. Mg, being the matrix element, was generally uniformly distributed within the grains, and its relative content at grain boundaries was usually lower due to the segregation of other elements, making the relative Mg content inside the grains higher. The T-2 and T-3 samples in Fig. 4(b)–(b2) and (c)–(c2) revealed that despite being a cold working process, laser shock peening's local high-speed deformation could induce thermal effects. The thermal effects in the surface layer of the material promoted element diffusion and redistribution, also inducing structural reorganization of the surface material. Following the shock peening of T-2 and T-3 samples, due to the increase in grain boundary density and the formation of stress concentration zones, Mn and Zn elements were more likely to segregate at surface grain boundaries or stress concentration zones. Zn, in particular, could segregate at grain boundaries and form Zn-rich phases, which could either enhance or degrade the material's corrosion resistance, contingent on their morphology and distribution. C and O elements might form small-sized carbide or oxide inclusions on the surface. These inclusion areas could initiate corrosion by disrupting the surface's electrochemical uniformity and intensifying local electrochemical reactions. Grain refinement and increased dislocations led to a more uniform distribution of Mg in the surface layer, as they promoted the diffusion of Mg atoms and minimized local concentration fluctuations on the surface.
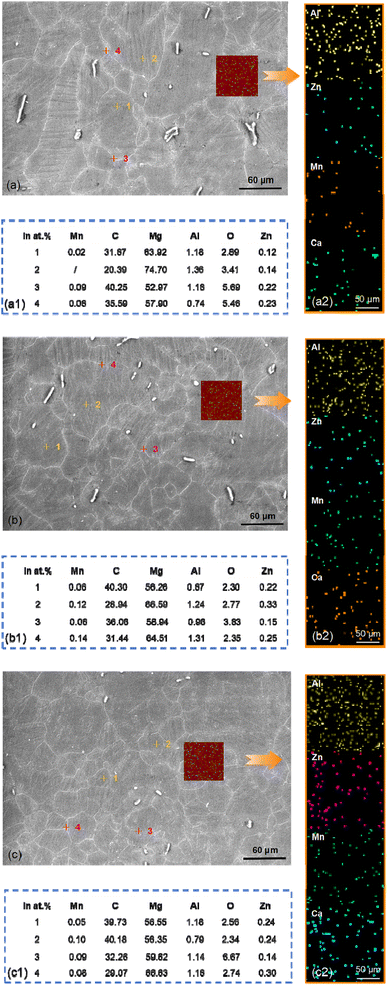 | ||
| Fig. 4 SEM-EDS micrographs of the AZ31B magnesium alloy sample surface: (a–a2) T-1 sample; (b–b2) T-2 sample; (c–c2) T-3 sample. | ||
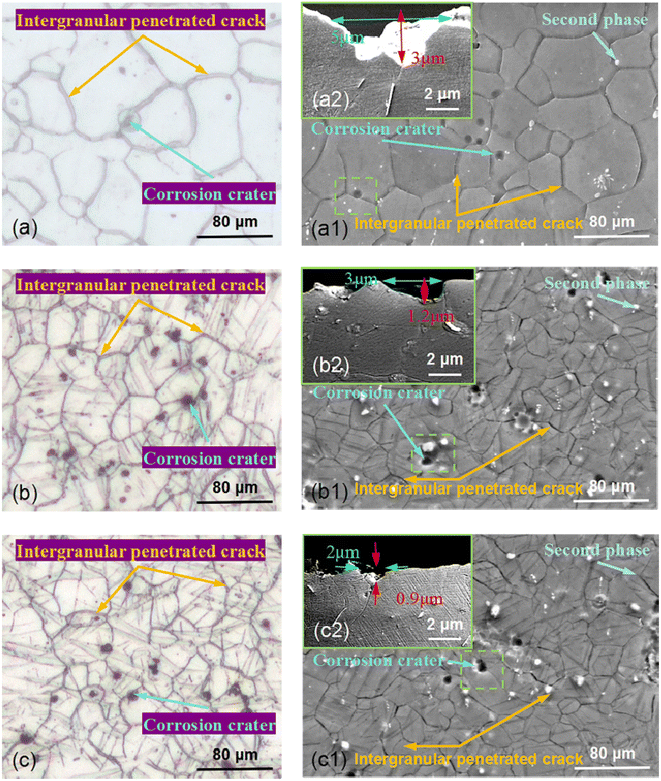
To further analyze the intergranular corrosion characteristics of AZ31B magnesium alloy, Fig. 5 presents OM and SEM micrographs of AZ31B magnesium alloy samples upon immersion in SBF solution (37 ± 0.1 °C) for 10 hours, polishing, and removal of corrosion products. A 10 hour corrosion test validated the experimental approach, ensuring the corrosion setup's rationality and the adequacy of data collection and analysis methods for extended future tests. Fig. 5(a)–(c) are OM images corresponding to the surfaces of T-1, T-2, and T-3 samples after corrosion, and Fig. 5(a1)–(c1) are SEM micrographs corresponding to the surface morphologies of T-1, T-2, and T-3 samples upon corrosion. Obviously, the smaller the grain size, the fewer the number of corrosion pits. Moreover, the corrosion pits were observed at or near the grain boundaries. Beyond pitting corrosion, it was also found that corrosion spread along grain boundaries, demonstrating intergranular corrosion as the primary local corrosion mode for AZ31B magnesium alloy samples. From the partial cross-sectional views in Fig. 5(a2)–(c2), the widths of the corrosion pits were 5 μm (T-1), 3 μm (T-2), and 2 μm (T-3), and the depths were 3 μm (T-1), 1.2 μm (T-2), and 0.9 μm (T-3), respectively. This indicated that the smaller the grain size, the smaller the size of the corrosion pits. The high-energy state and element segregation at grain boundaries predisposed these areas to corrosion, leading to the initial formation of pits. Over time, these corrosion pits might further expand, leading to intensified intergranular corrosion. Meanwhile, the presence of fine grains complicated and dispersed the corrosion propagation path, hindering continuous spread along a single grain boundary. This phenomenon effectively prevented the development of intergranular corrosion.
3.2 SKPFM analysis
To investigate the influence of the coupling effect of grain size and residual stress on the chemical reactivity of the Mg matrix in AZ31B magnesium alloy, the AZ31B magnesium alloy samples were etched metallographically and scanned using SKPFM under air conditions. Fig. 6 shows the SKPM detection and analysis results of the metallographically etched surface of AZ31B magnesium alloy samples. Fig. 6(a, b), (c, d) and (e, f) correspond to AZ31B magnesium alloy T-1, T-2, and T-3 samples, respectively. The green and yellow arrows in Fig. 6 indicate the SKPFM scanning paths, corresponding to the right-side Volta potential line scan analysis charts. Fig. 6 revealed that the T-1, T-2, and T-3 samples exhibited maximum Volta potentials of 33.8 mV, 17.8 mV, and 22 mV, and minimum potentials of −37.2 mV, −22.2 mV, and −16.2 mV, respectively. This indicated that the changes in grain size and residual stress within AZ31B magnesium alloy had a certain impact on the surface Volta potential. The reasons were as follows: firstly, regions with smaller grain sizes, which were more abundant, had more disordered atomic arrangements at grain boundaries, resulting in higher surface energy. These high-energy areas were thermodynamically unstable, promoting atomic migration or rearrangement, which affected the local surface potential distribution and increased potential fluctuations. Grain boundaries, with their higher electrochemical activity, tended to be preferential sites for corrosion or other reactions. Secondly, different grain orientations led to differences in surface atomic arrangement and electronic structure, thereby directly affecting the surface potential distribution. In regions with smaller grain sizes, the increased number of grains and complex orientation distributions led to varying surface potentials detected by the SKPFM probe during scanning. This inconsistency resulted in a larger range of potential fluctuations compared to regions with fewer, larger grains. Thirdly, in regions with larger grain sizes, alloy elements (such as Zn and Al) might segregate during solidification, leading to microscopic inhomogeneities in chemical composition. This local variation in chemical composition could cause differences in electrochemical potential between different regions, further exacerbating potential fluctuations. At the same time, there might be a higher density of second-phase particles or precipitated phases, and the presence of these phases could also lead to significant changes in surface potential. Immersion tests were performed to study the impact of grain size and residual stress coupling on the degradation rate of the Mg matrix in AZ31B magnesium alloy in SBF solution.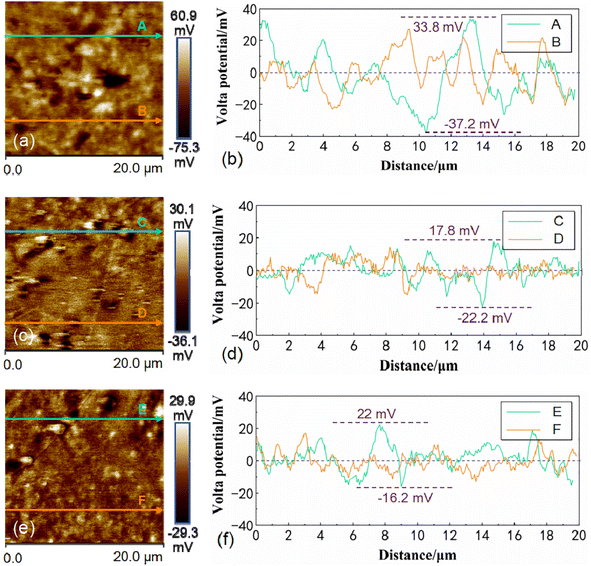 | ||
| Fig. 6 SKPM analysis images of samples with different grain sizes: (a and b) T-1 sample; (c and d) T-2 sample; (e and f) T-3 sample. | ||
3.3 Sensitivity to intergranular corrosion
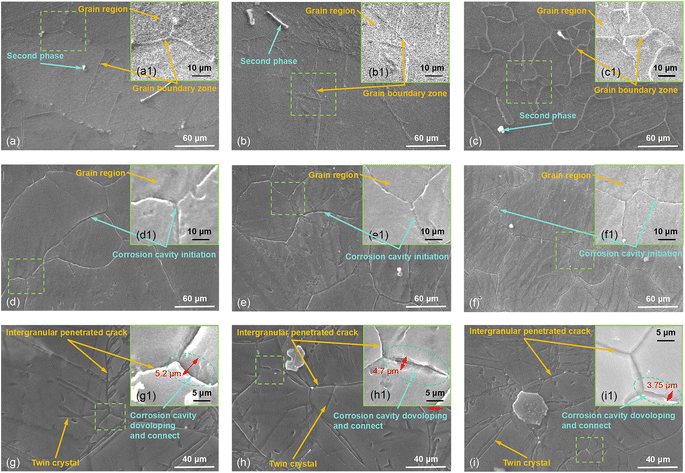
Fig. 7(d)–(f) correspond to the surface corrosion morphologies of samples T-1, T-2, and T-3 upon an immersion time of 2 h (without corrosion products). A 2 hour immersion test further analyzed the early formation of corrosion products. These short-term tests were considered crucial for understanding the initial kinetics and reaction rates of the corrosion process, aiding in capturing the distribution and structural changes of early corrosion products. Taking the surface corrosion of the T-1 sample as an example, in Fig. 7(d), it could be seen that after removing the white flocculent corrosion products, corrosion cavities had already formed at the original grain boundaries, while the inside of the grains appeared unaffected by corrosion. Comparing the T-2 and T-3 samples, it was found that the intergranular corrosion was most severe in the original T-1 sample, followed by mild intergranular corrosion in the T-2 and T-3 samples. Fig. 7(g)–(i) correspond to samples T-1, T-2, and T-3, respectively, with the immersion time extended to 4 h (without corrosion products). Due to the prolonged time, Cl− further eroded the “weakest” parts (grain boundaries and twins) of the Mg matrix. The corrosion cavities that had already formed at the grain boundaries further developed into larger corrosion cavities. The intragranular deformation twins exhibited deeper and narrower corrosion cavities, and severe intergranular corrosion was evident from corrosion pits at the triple junctions. It was observed that the maximum intergranular corrosion widths for samples T-1, T-2, and T-3 were 5.2 μm, 4.7 μm, and 3.7 μm, respectively. This suggested that during the corrosion process, the anodic reaction typically occurred in the grain boundary regions. In small-grained areas with higher grain boundary density, initial anodic dissolution was more uniform and rapid, potentially leading to swift coverage of grain boundaries by corrosion products due to uniform corrosion. Meanwhile, in AZ31B magnesium alloy, alloying elements such as Al and Zn might segregate at the grain boundaries. At the grain boundaries of smaller grains, rapid cooling promoted more uniform elemental distribution, resulting in a denser and more uniform corrosion product layer that inhibited further corrosion. In contrast, larger grain regions exhibited more pronounced elemental segregation, leading to localized deep corrosion at specific grain boundaries. This observation further validated the hypothesis previously proposed by the present research group, which would be detailed later.
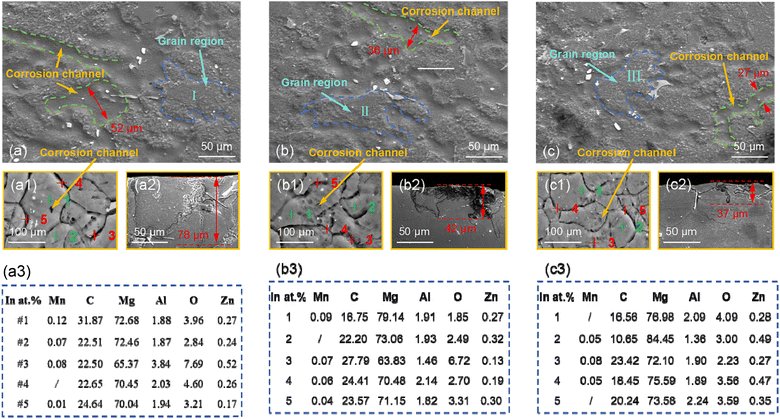
Fig. 8(a)–(c) show the surface morphologies of AZ31B magnesium alloy samples T-1, T-2, and T-3 after immersion for 36 h and removal of corrosion products, respectively. A 36 hour immersion test further demonstrated the evolution of the substrate surface under continuous exposure. By comparing the results of long-term tests, it assessed and analyzed the transitional characteristics of the substrate surface during the corrosion process. As shown in Fig. 8(a)–(c), with the further increase in immersion time, wide intergranular corrosion channels were observed on the corroded surface of the T-1 sample, and the widths of the intergranular corrosion channels for samples T-1, T-2, and T-3 were 52 μm, 36 μm, and 27 μm, respectively. This initially confirmed that grain boundary density had a certain influence on intergranular corrosion. Fig. 8(a1)–(c1) show the surface morphologies of samples T-1, T-2, and T-3 after immersion for 24 h and polishing (purpose of polishing: metallographic etching to reveal grain boundaries), respectively. Analysis of element point diagrams (Fig. 8(a3)–(c3) for samples T-1, T-2, and T-3) revealed higher Mg content in matrix areas (I, II, III) compared to intergranular corrosion zones, where the Mg content was markedly lower. The Mg content at the grain boundaries was significantly lower than that inside the grains, and the more severe the corrosion, the lower the Mg content. Since the SBF solution contained ions such as Cl− and CO32−, these ions could accelerate the corrosion of Mg. This phenomenon was especially noticeable at grain boundaries, where interactions between ions and Mg facilitate the swift dissolution of Mg2+ into the solution. Upon removal of the corrosion products, the actual consumption of Mg at the grain boundaries was more pronounced, especially in the fine-grained (T-3) structure. The high grain boundary density led to a broader area covered by corrosion products, significantly reducing the elemental content in these regions compared to the uncorroded grain interiors. The enrichment of C elements could serve as an indicator of the severity of corrosion. For example, in sample T-3, elevated carbon content suggested either enhanced corrosion activity or a higher propensity for corrosion product deposition in that area. From the cross-sectional views of intergranular corrosion in AZ31B magnesium alloy samples T-1, T-2, and T-3 (Fig. 8(a2)–(c2)), the maximum corrosion depths of intergranular corrosion for samples T-1, T-2, and T-3 were 78 μm, 42 μm, and 37 μm, respectively. By analyzing the corrosion depth in the cross-sectional views, the initial point of corrosion and its propagation path in the material could be determined (validating the previous belief that the corrosion path followed the grain boundaries). This facilitated to understand how corrosion initiated at the grain boundaries and gradually extended into the grain interiors in AZ31B magnesium alloy.
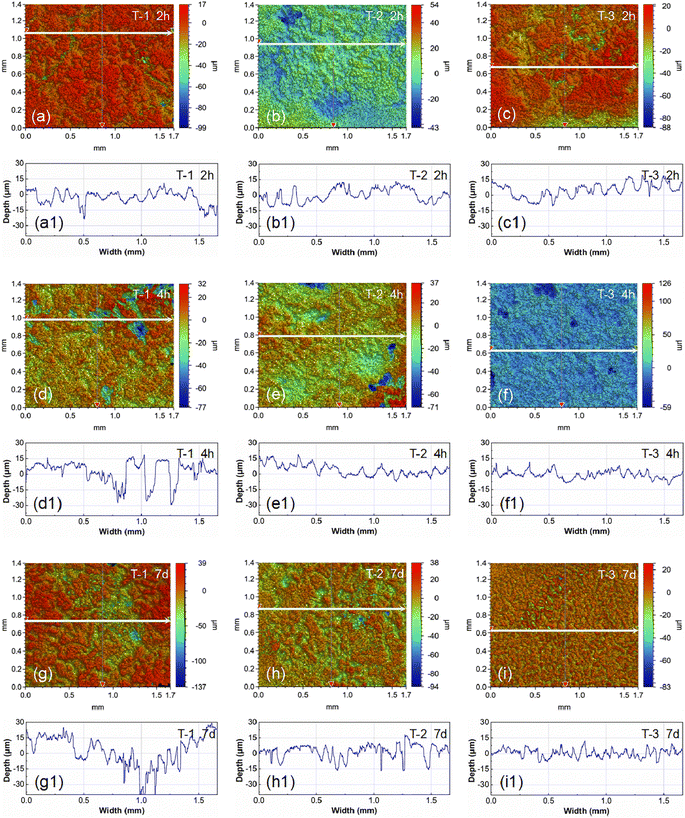
Utilizing a 3D optical microscope, observations and depth measurements of corrosion pits on the sample surfaces were conducted upon the removal of the corrosion products, as shown in Fig. 9. By observing the corrosion morphology at different time points (2 hours, 4 hours, and 7 days), a dynamic trend of the corrosion product layer changing over time was established. Fig. 9(a)–(c) display the surface corrosion morphologies of samples T-1, T-2, and T-3 after 2 hours of immersion, respectively. Fig. 9(d)–(f) show the surface corrosion morphologies of samples T-1, T-2, and T-3 after 4 hours of immersion, respectively. Fig. 9(g)–(i) exhibit the surface corrosion morphologies of samples T-1, T-2, and T-3 after 7 days of immersion, respectively. The white arrows in the corrosion morphology images indicate the scanning paths for measuring corrosion pit depths, corresponding to the corrosion pit depth curves below. It can be observed that the corrosion pit depths at immersion times of 2 hours, 24 hours, and 7 days all follow the order: T-1 > T-2 > T-3. The corrosion pit depth of the T-1 sample continuously increases with immersion time, while the changes in corrosion pit depth for the T-2 and T-3 samples are not significant with increasing immersion time. Notably, after 7 days of immersion, the T-3 sample exhibits better surface flatness compared to the T-1 and T-2 samples. This indicates that the AZ31B magnesium alloy substrate (with a high grain boundary density) after impact peening treatment has better uniform corrosion resistance than the initial AZ31B magnesium alloy substrate (with a low grain boundary density). Impact peening induces grain refinement in the AZ31B magnesium alloy substrate, distributing the corrosion reaction more uniformly within smaller regions and avoiding concentration of corrosion in a single grain or grain boundary area. This uniform effect is key to the improved uniform corrosion resistance of the AZ31B magnesium alloy material after impact peening treatment.
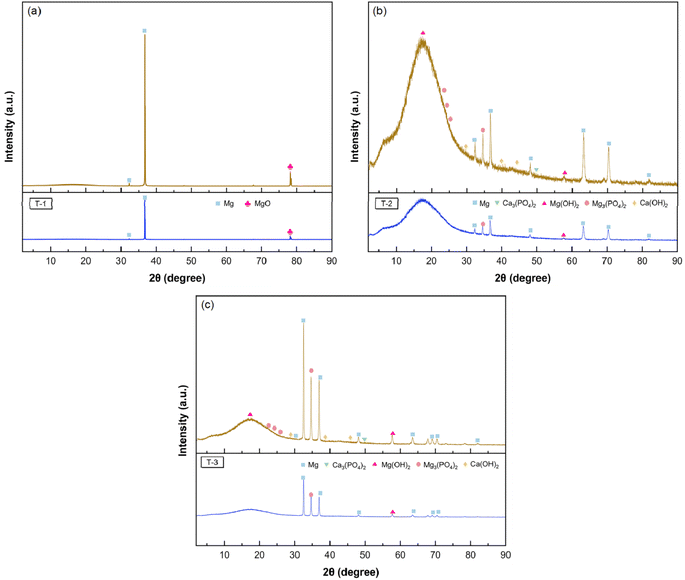 | ||
| Fig. 11 Surface XRD analysis of AZ31B magnesium alloy after 48 hours of immersion in SBF solution (37 ± 1 °C) (with corrosion products): (a) T-1 sample; (b) T-2 sample; (c) T-3 sample. | ||
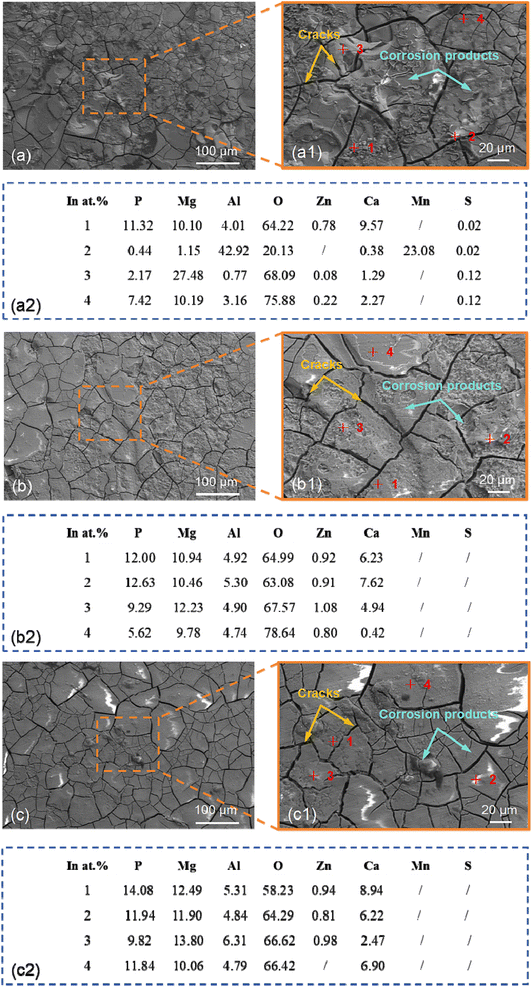
Following laser peening (2.83 GW cm−2), the surface roughness of the corrosion product layer of the T-2 sample was significantly improved. However, as indicated by Fig. 10(b2), the surface of the corrosion product layer of the T-2 sample still presented a high O element content. Referring to the XRD pattern of the T-2 sample, the main corrosion products on its surface were MgO, Mg(OH)2, Mg3(PO4)2, and Ca3(PO4)2. The formation of phosphate corrosion products helps to form a stable corrosion layer on the material surface, inhibiting the propagation of corrosion. The presence of these products indicated that laser peening promoted the generation of more complex corrosion products, and a passivation layer gradually formed on the surface, slowing down the corrosion rate. Following laser peening (4.95 GW cm−2), the surface of the corrosion product layer of the T-3 sample had a relatively complete flatness, yet as shown in Fig. 10(c2), the O element content on the surface of the corrosion product layer of the T-3 sample was significantly reduced. The T-3 sample exhibited a more uniform distribution of corrosion products, with no severe localized corrosion. The XRD pattern indicated that the surface corrosion products on T-3 were more diverse. The increased generation of Mg(OH)2, Mg3(PO4)2, and Ca3(PO4)2 revealed that high-energy laser peening, in conjunction with high grain boundary density and residual compressive stress, resulted in a more stable and dense corrosion product layer on the T-3 sample's surface, thereby significantly improving its corrosion resistance.
Fig. 12 shows the corrosion cross-sectional morphology of AZ31B magnesium alloy sample T-1 after 48 hours of immersion in SBF solution (37 ± 0.1 °C). Fig. 12(a) reveals that the corrosion product layer on the corrosion surface of the T-1 sample reaches a maximum depth of approximately 160 μm, indicating severe corrosion behavior. The corrosion product layer of the untreated T-1 sample appears loose, making it difficult to prevent further corrosion, and the corrosion extends deeply into the substrate surface. Corrosion spreads along the grain boundaries, with deeper corrosion grooves between grains. Combined with the EDS element distribution, the high O element content (approximately 43%) in the corrosion product layer indicates the formation of a large amount of these oxide products during corrosion. The P element content (5–7%) suggests that the magnesium alloy reacts with phosphate ions in the SBF solution, generating a small amount of magnesium phosphate corrosion products. The untreated T-1 sample, due to its larger grains and lack of residual compressive stress, exhibits significant intergranular corrosion in the SBF solution. Although oxide and phosphate corrosion products are present, they do not form a dense protective layer, allowing corrosion to continue.
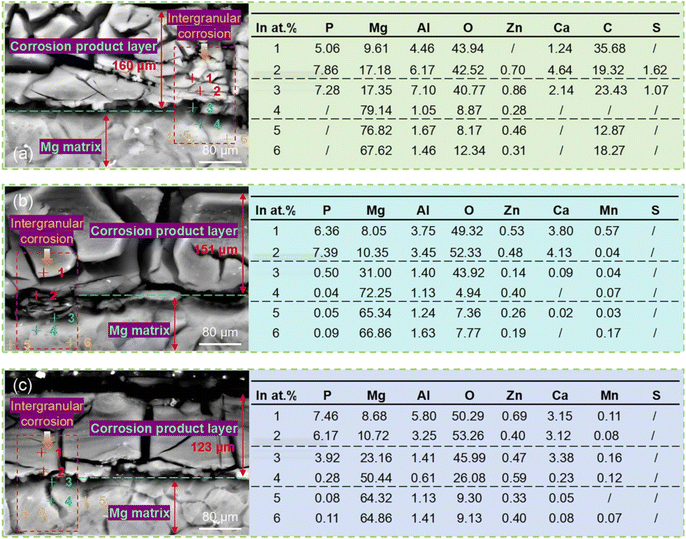 | ||
| Fig. 12 SEM morphology and EDS analysis of the corrosion cross-section of AZ31B alloy samples after immersion for 48 hours (with corrosion products): (a) T-1 sample; (b) T-2 sample; (c) T-3 sample. | ||
Fig. 12(b) shows that the thickness of the corrosion product layer of the T-2 sample is 151 μm, which is reduced compared to that of the T-1 sample, and the corrosion product layer is more uniform with a denser surface. This indicates that laser peening treatment slows down the corrosion rate to some extent. However, intergranular corrosion still exists, although it is significantly reduced compared to the T-1 sample. Combined with the EDS element distribution, the increased O element content (49–52%) suggests that the formed MgO and Mg(OH)2 are relatively stable. The P element content (6–7%) also increases, indicating the gradual formation of magnesium phosphate and calcium phosphate corrosion products. The Al and Mg element contents in the corrosion product layer remain low, but due to the denser corrosion product layer, Mg consumption is relatively reduced. EDS analysis shows that the Al and Mg element contents in the substrate remain stable, indicating the formation of a relatively dense corrosion layer on the substrate surface, which helps prevent further corrosion. We also note that the increase in Ca element content indicates that in the SBF solution, calcium ions react with the magnesium alloy surface, generating calcium phosphate compounds. These calcium phosphate products further enhance the stability of the surface passivation layer, contributing to improving the corrosion resistance of the magnesium alloy. Fig. 12(c) shows that the corrosion product layer of the T-3 sample has the smallest thickness of only 123 μm, and intergranular corrosion is almost completely inhibited. Combined with the EDS element distribution, the P element content in the intergranular corrosion area is 3.92%, indicating a significant increase in phosphate corrosion products, particularly the formation of calcium phosphate and magnesium phosphate compounds. These products form a stable passivation layer on the surface, greatly enhancing the corrosion resistance of the magnesium alloy. Laser peening treatment refines the grains and introduces residual compressive stress, inhibiting intergranular corrosion, and significantly improves the corrosion resistance of AZ31B magnesium alloy by promoting the formation of denser oxide and phosphate products. The oxide and phosphate corrosion product layers formed on the substrate surface were more compact. A dense corrosion layer formed a “barrier” on the material surface, preventing ions from the corrosive environment (such as chloride and phosphate ions in SBF solution) from penetrating into the interior of the substrate. Concurrently, it curbed the formation of cracks and voids in the corrosion process, concentrating corrosion on the surface and thinning the corrosion product layer. The dense layer not only decreased the corrosion rate but also confined it to the material surface, halting further substrate penetration.
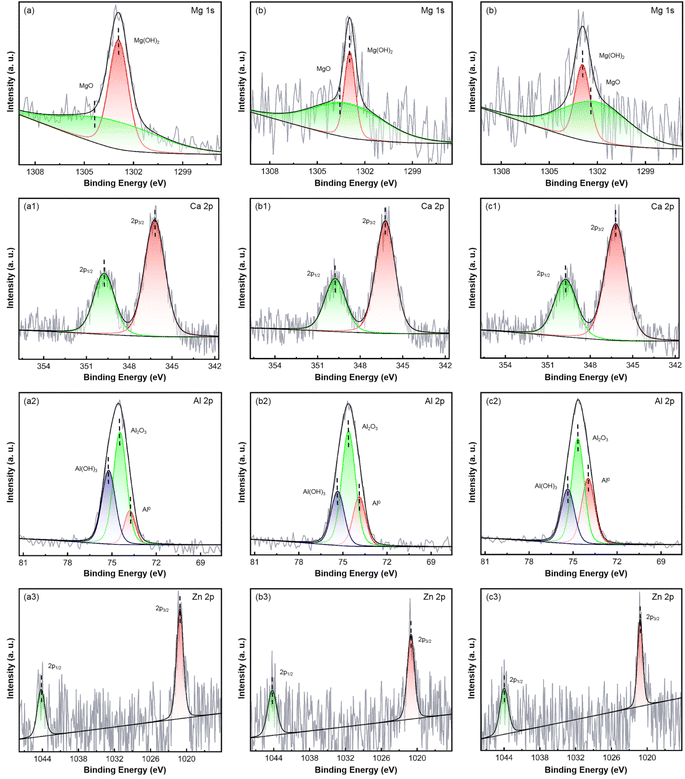
To further investigate the chemical composition of the corrosion products, XPS was employed to characterize the surface corrosion products of AZ31B magnesium alloy samples immersed in SBF solution (37 ± 0.1 °C) for 48 hours. Table 3 shows the surface chemical composition after soaking for 48 h. T-1 sample (Fig. 13(a)–(a3)): the XPS spectrum of Mg 1s showed the presence of MgO and Mg(OH)2. MgO was a relatively weak oxide layer with a loose structure that could not provide good protection for the magnesium matrix. This indicated that magnesium formed more magnesium oxide than magnesium hydroxide in the early corrosion stages. The brittle magnesium oxide (MgO) layer allowed corrosive media to quickly infiltrate along grain boundaries, resulting in swift intergranular corrosion and expansion. The MgO layer failed to form a dense protective barrier. Moreover, calcium phosphate compounds formed as a result of magnesium reacting with phosphate and calcium ions in the SBF solution, contributing to the corrosion products. However, the layer of calcium phosphate products was relatively sparse and could not form a dense protective layer, resulting in a faster corrosion rate and significant intergranular corrosion expansion for the T-1 sample. T-2 sample (Fig. 13(b)–(b3)): Compared to the T-1 sample, the peak intensity of Mg(OH)2 in the T-2 sample increased significantly, indicating that upon grain refinement and the introduction of residual compressive stress, a more stable layer of magnesium hydroxide was formed on the surface. The Zn 2p spectrum showed an increase in the formation of ZnO, yet its structure remained relatively loose, and the ZnO layer did not significantly hinder the expansion of corrosive media. Intergranular corrosion still existed. The corrosion rate decreased slightly compared to T-1, but the protective effect was not significant. T-3 sample (Fig. 13(c)–(c3)): compared to the T-1 and T-2 samples, the peak intensity of Mg(OH)2 in the T-3 sample increased significantly, indicating the formation of a more stable layer of magnesium hydroxide on the surface following grain refinement and the introduction of residual compressive stress. Overall, laser shock processing, through the introduction of residual compressive stress and grain refinement, promoted the formation of a denser layer of Mg(OH)2, calcium phosphate, and aluminum oxide, effectively improving the corrosion resistance of AZ31B magnesium alloy and significantly reducing the occurrence of intergranular corrosion.
| Samples (atomic%) | Mg 1s | Al 2p | Ca 2p | Mn 2p | C 1s | O 1s | Zn 2p |
|---|---|---|---|---|---|---|---|
| T-1 | 1.55 | 8.20 | 2.89 | 3.71 | 20.61 | 61.86 | 1.18 |
| T-2 | 1.67 | 7.25 | 2.87 | 3.56 | 20.64 | 62.74 | 1.26 |
| T-3 | 1.62 | 8.75 | 2.65 | 4.14 | 20.68 | 61.06 | 1.11 |
3.4 Coupled immersion test
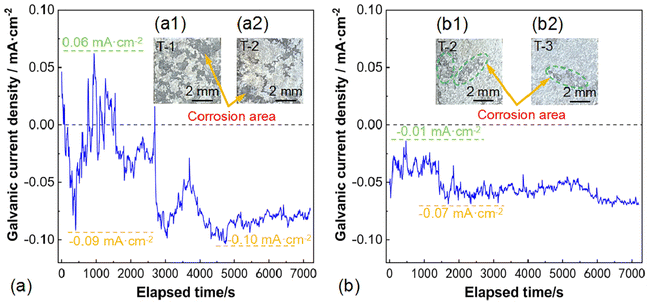
To explore the differences in corrosion behavior of AZ31B magnesium alloy under the coupled effects of grain size and residual stress, a zero-resistance ammeter test was conducted to observe and analyze the corrosion behavior of T-1, T-2, and T-3 samples. The coupled immersion test results for T-1 and T-2 samples are shown in Fig. 14(a). In Fig. 14(a), we observed that the galvanic current density was initially positive, indicating that electrons flowed from sample T-2 to the working electrode terminal, and sample T-2 was dissolving. At 402 s, the galvanic current density became negative (−0.09 mA cm−2), indicating that sample T-1 was dissolving when the galvanic current density was negative. Then, at 937 s, the galvanic current density reached a maximum value of 0.06 mA cm−2, subsequently gradually decreased, and reached an inflection point at 1556 s (before 1556 s, the current density was positive, and after 1556 s, it became negative). At 4740 s, the galvanic current density reached a minimum value of −0.10 mA cm−2. After 1556 s, sample T-1 became the one undergoing dissolution. In the initial stage, sample T-2 was more active and corroded as the anode, followed by sample T-1 becoming the more active one and starting to degrade. This transition should be attributed to the surface film formed on the corroded surface during sample immersion in the solution. Furthermore, near 7000 s, the galvanic current density tended towards a “zero” value, indicating that the galvanic corrosion between T-1 and T-2 samples weakened at this time. Combined with Fig. 14(a1) and (a2), it can be seen that large areas of corrosion appeared on the surface of the T-1 sample, while the corrosion spot area on the surface of the T-2 sample was relatively smaller. This is consistent with the results of the galvanic current density curve test.The coupled immersion test results for T-2 and T-3 samples are shown in Fig. 14(b). In Fig. 14(b), we observed that the galvanic current density was always negative, indicating that sample T-2 always acted as the anode and was dissolving. At 471 s, the galvanic current density reached a maximum value of −0.01 mA cm−2, and then reached a minimum value of −0.07 mA cm−2 at 1697 s and 2340 s. After two hours of coupled immersion testing of T-2 and T-3 samples, the surface macroscopic morphologies are shown in Fig. 14(b1) and (b2). It was found that large areas of corrosion appeared on the surface of the T-2 sample (see the area within the green ellipse in the figure), while the surface of the T-3 sample exhibited slight and uniform corrosion spots. Combined with the observation of corrosion morphology, we found that the results were consistent with the current density curves of the T-2 and T-3 samples, indicating that when the T-2 and T-3 samples were coupled and tested, sample T-2 corroded and dissolved as the anode, while sample T-3 was protected as the cathode.
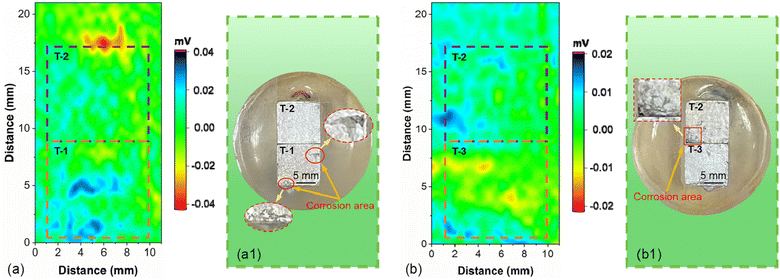
The coupling relationship positions of the AZ31B magnesium alloy samples are shown in Fig. 15. The SVET monitoring results of AZ31B magnesium alloy samples immersed in SBF solution (37 ± 0.1 °C) for 1 h and 2 h are shown in Fig. 16(a) and (b). Fig. 16(a) shows the SVET test results of T-1 and T-2 coupled samples immersed in SBF solution (37 ± 0.1 °C) for 1 h, and Fig. 16(a1) shows the surface morphology after testing the coupled samples. It can be observed that the blue area represents the distribution of positive voltage, and the red area represents the distribution of negative voltage. Clearly, in the T-1 and T-2 coupled samples, the surface of the T-1 sample was distributed with a large amount of positive voltage, and the surface of the T-2 sample was distributed with a large amount of negative voltage. This indicates that the surface of the T-1 sample was distributed with anodic current, and the surface of the T-2 sample was distributed with cathodic current. This is consistent with the previous ZRA test results, where after 1556 s, sample T-1 became the one undergoing dissolution, and sample T-1 became the more active one and started to degrade. Meanwhile, observing the macroscopic morphology of the samples after immersion, as shown in Fig. 16(a1), it can be seen that the corrosion degree on the surface of the T-2 sample was milder, while the T-1 sample with larger grain size had more severe corrosion on its surface.
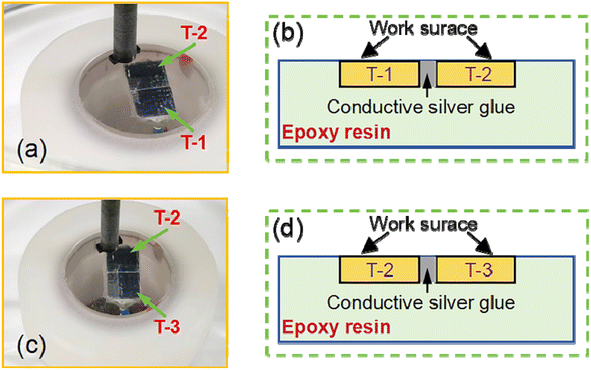 | ||
| Fig. 15 Position diagram of SVET test coupling relationships for AZ31B magnesium alloy samples: (a and b) T-1 and T-2 coupled samples; (c and d) T-2 and T-3 coupled samples. | ||
Fig. 16(b) shows the SVET test results of the T-2 and T-3 coupled samples after immersion in SBF solution (37 ± 0.1 °C) for 2 hours, and Fig. 16(b1) displays the surface morphology of the T-2 and T-3 coupled samples after testing. Clearly, in the T-2 and T-3 coupled samples, the surface of the T-2 sample is distributed with a large number of positive voltages, while the surface of the T-3 sample is distributed with a large number of negative voltages. This indicates that the surface of the T-2 sample is distributed with anodic current, and the surface of the T-3 sample is distributed with cathodic current, which is consistent with the ZRA test results where the T-2 sample consistently acts as the anode for degradation. As seen in Fig. 16(b), after a test time of 2 hours, the red and blue colors on the surfaces of the T-2 and T-3 coupled samples weaken, indicating that the galvanic current intensity between the T-2 and T-3 coupled samples weakens at this time. The reason may be that after immersion for 2 hours, a large amount of corrosion product layer forms on the surfaces of the T-2 and T-3 coupled samples, inhibiting the galvanic corrosion process. This is consistent with the observed macroscopic morphology results of the samples after immersion, as shown in Fig. 16(b1), which will not be further elaborated here.
3.5 Electrochemical testing
AZ31B magnesium alloy samples T-1, T-2, and T-3 were subjected to potentiodynamic testing in SBF solution at 37 ± 0.1 °C, at 0 and 24 hours. The potentiodynamic polarization curves are shown in Fig. 17(a) and (b), and the fitting results of the Tafel curves are presented in Table 4. Initial potentiodynamic tests revealed that increasing grain boundary density and residual compressive stress in the AZ31B samples led to a gradual decrease in corrosion current density (Icorr) and a convergence of corrosion potentials. At 0 hours, the corrosion potentials (Ecorr) of samples T-1, T-2, and T-3 were −1.64 V, −1.58 V, and −1.47 V, respectively; and the corrosion current (Icorr) densities were 1.21 × 10⁻³ A cm−2, 1.59 × 10⁻³ A cm−2, and 4.49 × 10⁻⁵ A cm−2, respectively. At 24 hours, the corrosion potentials (Ecorr) of samples T-1, T-2, and T-3 were −1.48 V, −1.45 V, and −1.44 V, respectively; the corrosion current (Icorr) densities were 7.57 × 10⁻⁴ A cm−2, 8.14 × 10⁻⁴ A cm−2, and 1.04 × 10⁻⁴ A cm−2, respectively. Based on the corrosion current density, the corrosion rate (Pi) could be calculated using eqn (1):20–22| Pi = 22.85Icorr | (1) |
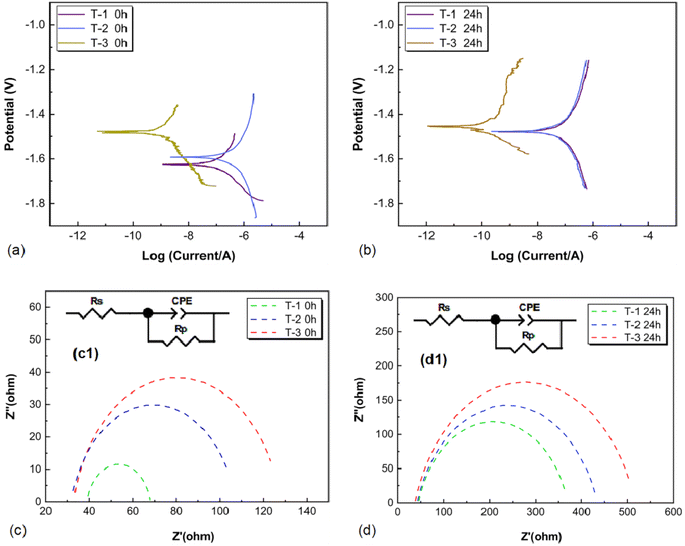 | ||
| Fig. 17 Electrochemical test results of AZ31B magnesium alloy: (a and b) Tafel curves at 0 h and 24 h; (c and d) Nyquist plots for 0 h and 24 h; (c1) and (d1) were equivalent circuit diagrams. | ||
| Samples | Icorr (A cm−2) | Ecorr (V) | P (mm per year) |
|---|---|---|---|
| T-1 0 h | 1.21 × 10⁻³ | −1.64 | — |
| T-2 0 h | 1.59 × 10⁻³ | −1.58 | — |
| T-3 0 h | 4.49 × 10⁻⁵ | −1.47 | — |
| T-1 24 h | 7.57 × 10⁻⁴ | −1.48 | 17.29 |
| T-2 24 h | 8.14 × 10⁻⁴ | −1.45 | 18.59 |
| T-3 24 h | 1.04 × 10⁻⁴ | −1.44 | 2.37 |
Eqn (1) was used to calculate the corrosion rates of AZ31B magnesium alloy samples T-1, T-2, and T-3 after 24 hours, yielding values of 17.29, 18.59, and 2.37 mm per year, respectively. These results suggested that the corrosion resistance of AZ31B magnesium alloy correlated with the induced residual compressive stress and grain refinement. Higher grain boundary density and greater residual compressive stress enhanced the alloy's resistance to corrosion.
To further analyze the impact of increased grain boundary density and introduced residual compressive stress on the electrochemical corrosion behavior of the samples in SBF solution (37 ± 0.1 °C), electrochemical impedance spectroscopy tests were hereby conducted on the samples after immersion for 0 hours and 24 hours. Fig. 17(c) and (d) show the electrochemical impedance spectroscopy curves of AZ31B magnesium alloy samples T-1, T-2, and T-3 after immersion in SBF solution for 0 hours and 24 hours. Fig. 17(c1) and (d1) present the fitting circuits. The fitting results are presented in Table 5, with Rs representing the solution resistance, Rp representing the charge transfer resistance, and CPE1 representing the constant phase element of the double-layer capacitance at the electrode surface in contact with the solution. As seen in Fig. 17(c) and (d), in the Nyquist plots at 0 hours, the charge transfer resistance of the T-2 sample was relatively close to that of the T-3 sample and significantly higher than that of the T-1 sample. Upon immersion for 24 hours, the order of charge transfer resistance in the Nyquist plots was: T-3 sample > T-2 sample > T-1 sample, with the charge transfer resistances of the T-1 and T-2 samples being close. The higher grain boundary density and increased residual compressive stress in the T-3 sample matrix accounted for this difference. The elevated charge transfer resistance in T-3 suggested greater impedance to charge transfer at the electrode surface during electrochemical reactions, whereas the lower resistances in T-1 and T-2 indicated higher corrosion rates. With increasing immersion time, the impedance arc radius also increased, resulting in the impedance arc radius after immersion for 24 hours being: T-3 sample > T-2 sample > T-1 sample, indicating the stronger corrosion resistance of sample T-3.
| Samples | Rs (Ω cm2) | Rp (Ω cm2) | CPE1-T (Ω−1 cm−2 s−n) | CPE1-P |
|---|---|---|---|---|
| T-1 0 h | 38.85 | 29.33 | 4.05 × 10⁻⁵ | 0.8526 |
| T-2 0 h | 31.75 | 75.45 | 2.24 × 10⁻⁵ | 0.8534 |
| T-3 0 h | 35.93 | 96.65 | 1.99 × 10⁻⁵ | 0.8487 |
| T-1 24 h | 44.57 | 326.1 | 3.91 × 10⁻⁵ | 0.8037 |
| T-2 24 h | 42.20 | 391.7 | 3.93 × 10⁻⁵ | 0.8010 |
| T-3 24 h | 37.28 | 479.5 | 4.11 × 10⁻⁵ | 0.8083 |
4. Discussion
4.1 Dynamic evolution model of intergranular corrosion in AZ31B magnesium alloy
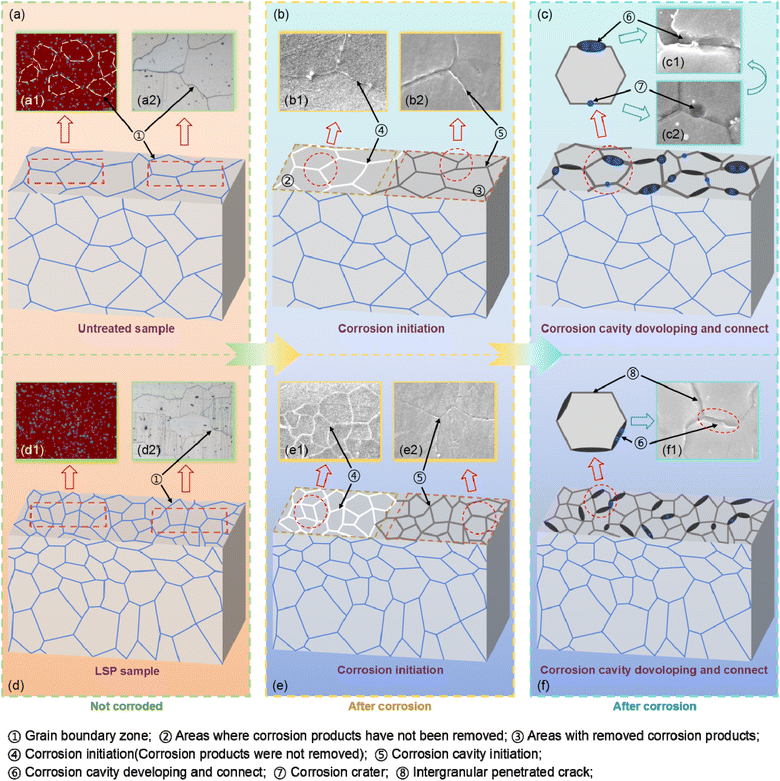
As shown in Fig. 18(a) and (d), the surface of the AZ31B magnesium alloy was strengthened through laser shock processing, where the laser shock wave induced intense plastic deformation on the material surface and generated high-amplitude compressive stress. The shock strengthening process induced dynamic recrystallization of the grain structure, leading to grain refinement in the surface layer and forming a significant grain size gradient, with grains gradually increasing from the surface toward the interior. Residual stress exhibited a gradient distribution across the matrix thickness, with the surface layer featuring finer grains and higher compressive stress, while internal regions showed larger grains and increasing tensile stress. This gradient effectively controlled the interdependent distribution of grain size and residual stress in the AZ31B magnesium alloy matrix. The diffusion and distribution of elements on the matrix surface were affected by the dynamic recrystallization and the introduction of compressive stress (Fig. 17(a1) and (d1)). This exerted an important impact on the corrosion resistance of the material, particularly intergranular corrosion behavior. Under the coupled distribution of grain size and residual stress, the intergranular corrosion mechanism of AZ31B magnesium alloy exhibited a complex evolution process, which could be divided into the following stages:4.2 Influence of coupled distribution of grain size and residual stress on the corrosion resistance of AZ31B magnesium alloy
According to the SKPFM analysis in Fig. 6, the highest Volta potentials of T-1, T-2, and T-3 samples were 33.8 mV, 17.8 mV, and 22 mV, respectively, and the lowest Volta potentials were −37.2 mV, −22.2 mV, and −16.2 mV, respectively. This indicated that variations in grain size and residual stress within the AZ31B magnesium alloy had a certain impact on the surface Volta potential. In the immersion tests shown in Fig. 7(a)–(c), it was observed that in the early stages of corrosion (0.1 h), the smaller the grain size of the AZ31B magnesium alloy matrix, the more severe the corrosion (with relatively more corrosion products). This was attributed to grain boundaries being high-energy regions with weaker atomic bonds, making them more prone to chemical reactions and ionic erosion from corrosive media like SBF solution compared to the grain interiors. In the matrix with smaller grains (T-3), the grain boundaries provided more pathways for the corrosive medium to spread, allowing corrosion to rapidly extend into the interior of the material along these paths. Therefore, in the early stages of corrosion, the corrosive medium could more quickly penetrate more grain boundary areas, leading to rapid expansion of the corrosion reaction. Corrosion products were then generated in more grain boundaries and twin areas, accumulating on the material surface and resulting in the appearance of more corrosion products. In the immersion test shown in Fig. 7(g)–(i), the maximum intergranular corrosion widths observed for T-1, T-2, and T-3 samples were 5.2 μm, 4.7 μm, and 3.7 μm, respectively, suggesting the typical occurrence of anodic reactions in the grain boundary regions during the corrosion process. Residual compressive stress inhibited the expansion of corrosion cavities, slowing the initiation and propagation of corrosion. Upon 7 days of immersion, the T-3 sample showed superior surface flatness over T-1 and T-2. This suggested that the AZ31B magnesium alloy matrix post-laser shock peening, with its high grain boundary density, offered enhanced uniform corrosion resistance compared to the initial matrix with low grain boundary density. Laser shock peening-induced grain refinement in the AZ31B magnesium alloy matrix resulted in a more uniform distribution of corrosion reactions within smaller regions, preventing corrosion from concentrating in a single grain or grain boundary region. The coupling of compressive stress and fine grains not only slowed down the corrosion reaction but also prevented the rapid propagation of intergranular corrosion cracks, thereby improving the material's corrosion resistance. ZRA and SVET tests consistently showed that large grain regions with residual tensile stress acted as anodes, while fine grain regions with residual compressive stress served as cathodes, aligning with the macroscopic sample morphology post-immersion. The electrochemical test results showed that the corrosion rates of AZ31B magnesium alloy samples T-1, T-2, and T-3 at 24 hours were 17.29, 18.59, and 2.37 mm per year, respectively. With increasing immersion time, the impedance arc radius increased correspondingly. Following 24 hours of immersion, the impedance arc radius ranked as: T-3 sample > T-2 sample > T-1 sample. This implied that the corrosion resistance of AZ31B magnesium alloy correlated with the introduction of residual compressive stress and grain refinement. Increased grain boundary density and higher levels of induced residual compressive stress resulted in enhanced corrosion resistance of the AZ31B magnesium alloy matrix.5. Conclusion
In this study, homogenization heat treatment and laser shock peening processes were successfully employed to regulate the microstructure (grain size, residual stress, and element distribution, etc.) in the AZ31B magnesium alloy matrix. By comparing the test results of AZ31B alloy samples T-1, T-2, and T-3, the mechanism of the coupled distribution of grain size and residual stress in the AZ31B magnesium alloy matrix on intergranular corrosion in SBF solution (37 ± 0.1 °C) was analyzed, and the influence of the coupled distribution of grain size and residual stress on the corrosion resistance of AZ31B magnesium alloy was discussed. The following conclusions were drawn:(1) The residual tensile stress region (large grain region) exhibited pronounced electrochemical activity disparities on the sample surface, predisposing it to localized corrosion. This potential difference led to an increase in current density between the anode and cathode regions, thereby accelerating the occurrence of localized corrosion, notably pitting corrosion and intergranular corrosion.
(2) Intergranular corrosion occurred along grain boundaries without disrupting the internal grain structure, indicating that the grain's potential was higher than that of the boundaries. This suggested that the grain interior acted as a cathode while the grain boundaries were preferentially dissolved as anodes. Among them, the simplification of the corrosion products of the T-1 sample reflected the insufficient protection ability of the sample in the corrosion environment, and the structure of the product layer was relatively loose, failing to effectively seal the channel of the corrosive medium and resulting in rapid corrosion expansion.
(3) The coupling results of the T-2 and T-3 samples were the same. This was consistent with the observed macroscopic morphology of the samples upon immersion. In the ZRA tests, the galvanic currents of the T-1 and T-2 samples gradually decreased post-inflection and were negative, suggesting the corrosion product film lacked protective properties.
(4) According to the corrosion resistance test, the corrosion rates of T-1, T-2 and T-3 of AZ31B magnesium alloy samples were 17.29 mm per year, 18.59 mm per year, and 2.37 mm per year, respectively. The charge transfer resistance followed the order: T-3 sample > T-2 sample > T-1 sample. After 24 hours of immersion, the impedance arc radius also ranked as: T-3 sample > T-2 sample > T-1 sample, indicating that the T-3 sample exhibited stronger corrosion resistance.
Data availability
Data supporting the findings of this study may be obtained from the corresponding author upon reasonable request.Conflicts of interest
The authors declare that they have no known competing financial interests or personal relationships that could have appeared to influence the work reported in this paper.References
- L. Chen, C. Blawert, J. Yang, R. Hou, X. Wang, M. L. Zheludkevich and W. Li, The stress corrosion cracking behaviour of biomedical Mg-1Zn alloy in synthetic or natural biological media, Corros. Sci., 2019, 175, 108876 CrossRef.
- M. A. F. Romzi, J. Alias and M. I. M. Ramli, Effect of zinc (Zn) on the microstructure and corrosion behavior of magnesium (Mg), Mater. Today, 2022, 48, 1873–1879 CAS.
- M. Liang, C. Wu, Y. Ma, J. Wang, M. Dong, B. Dong, H. Liao, J. Fan and Z. Guo, Influences of aggressive ions in human plasma on the corrosion behavior of AZ80 magnesium alloy, Mater. Sci. Eng., C, 2021, 119, 111521 CrossRef CAS.
- Y. Duan, J. Zhu and J. Wu, In-situ hydrothermal Mg(OH)2-SiO2-Al(OH)3 composite coatings on AZ91D magnesium alloy with enhanced corrosion properties, Vacuum, 2023, 217, 112515 CrossRef CAS.
- Z. Z. Jin, M. Zha, S. Q. Wang, S. C. Wang, C. Wang, H. L. Jia and H. Y. Wang, Alloying design and microstructural control strategies towards developing Mg alloys with enhanced ductility, J. Magnesium Alloys, 2022, 10(5), 1191–1206 CrossRef CAS.
- T. O. Olugbade, B. O. Omiyale and O. T. Ojo, Corrosion, corrosion fatigue, and protection of magnesium alloys: mechanisms, measurements, and mitigation, J. Mater. Eng. Perform., 2022, 1–21 Search PubMed.
- D. Zhao, A. Brown, T. Wang, S. Yoshizawa, C. Sfeir and W. R. Heineman, In vivo quantification of hydrogen gas concentration in bone marrow surrounding magnesium fracture fixation hardware using an electrochemical hydrogen gas sensor, Acta Biomater., 2018, 73, 559–566, DOI:10.1016/j.corsci.2020.108876.
- N. Hansen, Hall-Petch relation and boundary strengthening, Scr. Mater., 2004, 51(8), 801–806 CrossRef CAS.
- R. Z. Valiev, T. C. Lowe and A. K. Mukherjee, Understanding the unique properties of SPD-induced microstructures, JOM, 2000, 52, 37–40 CrossRef CAS.
- R. Z. Valiev and T. G. Langdon, The art and science of tailoring materials by nanostructuring for advanced properties using SPD techniques, Adv. Eng. Mater., 2010, 12(8), 677–691 CrossRef CAS.
- N. N. Aung and W. Zhou, Effect of grain size and twins on corrosion behavior of AZ31B magnesium alloy, Corros. Sci., 2010, 52(2), 589–594 CrossRef CAS.
- H. S. Kim and W. J. Kim, Enhanced corrosion resistance of ultrafine-grained AZ61 alloy containing very fine particles of Mg17Al12 phase, Corros. Sci., 2012, 75, 228–238 CrossRef.
- Y. Huai, Y. Xiong, X. Zha, L. Huan, S. Huinal and L. Ya, Microstructures, Mechanical Properties and Corrosion Behavior of Solution-Treated Mg-0.5Zr-1.8Zn-xGd Biodegradable Alloys, Techn. Rare Metal Mat. Eng., 2021, 50(6), 1919–1927 Search PubMed.
- V. E. Bazhenov, A. V. Li, A. A. Komissarov, A. V. Koltygin, S. A. Tavolzhanskii, V. A. Bautin, O. O. Voropaeva, A. M. Mukhametshina and A. A. Tokar, Microstructure and mechanical and corrosion properties of hot-extruded Mg-Zn-Ca-(Mn) biodegradable alloys, J. Magnesium Alloys, 2012, 9(4), 1428–1442 CrossRef.
- D. Ahmadkhaniha, Y. Huang, M. Jaskari, A. Järvenpää, M. H. Sohi, C. Zanella, L. P. Karjalainen and T. G. Langdon, Effect of high-pressure torsion on microstructure, mechanical properties and corrosion resistance of cast pure Mg, J. Mater. Sci., 2018, 53, 16585–16597 CrossRef CAS.
- A. Bahmani, S. Arthanari and K. S. Shin, Formulation of corrosion rate of magnesiumalloys using microstructural parameters, J. Magnesium Alloys, 2020, 8(1), 134–149 CrossRef CAS.
- Y. Luo, Y. Deng, L. Guan, L. Ye, X. Guo and A. Luo, Effect of grain size and crystal orientation on the corrosion behavior of as-extruded Mg-6Gd-2Y-0.2Zr alloy, Corros. Sci., 2020, 164, 108338 CrossRef CAS.
- J. Xu, C. Liu, J. Wu, H. Li, B. Qi, D. Zhang, Y. Zhang, Y. Zhao and L. Zhou, New insight into the role of microscale residual stresses on initial corrosion behavior of Ti35 alloy, Corros. Sci., 2022, 206, 110491 CrossRef CAS.
- G. R. Kumar and G. Rajyalakshmi, Role of nano second laser wavelength embedded recast layer and residual stress on electrochemical corrosion of titanium alloy, Mater. Res. Express, 2019, 6(8), 086583 CrossRef CAS.
- Z. Shi and A. Atrens, An innovative specimen configuration for the study of Mg corrosion, Corros. Sci., 2011, 53(1), 226–246 CrossRef CAS.
- M. C. Zhao, M. Liu, G. Song and A. Atrens, Influence of the β-phase morphology on the corrosion of the Mg alloy AZ91, Corros. Sci., 2008, 50(7), 1939–1953 CrossRef CAS.
- F. Cao, Z. Shi, G. L. Song, M. Liu and A. Atrens, Corrosion behaviour in salt spray and in 3.5% NaCl solution saturated with Mg (OH)2 of as-cast and solution heat-treated binary Mg-X alloys: X = Mn, Sn, Ca, Zn, Al, Zr, Si, Sr, Corros. Sci., 2013, 76, 60–97 CrossRef CAS.
| This journal is © The Royal Society of Chemistry 2024 |

