 Open Access Article
Design of polyurethane composite foam obtained from industrial PET wastes and MXenes for EMI shielding applications†
Edina Rusen‡
 *a,
Alexandra Mocanu‡
 ab,
Gabriela Toader‡c,
Aurel Diacon
 c,
Cosmin Romanitanb,
Ovidiu Iorgad,
Martino Aldrigo
 b,
Catalin Parvulescub,
Raul Mitran
 e and
Oana Brincoveanubf
aFaculty of Chemical Engineering and Biotechnologies, National University of Science and Technology Politehnica Bucharest, 1-7 Gh. Polizu Street, Bucharest, 011061, Romania. E-mail: edina_rusen@yahoo.com
bNational Institute for Research and Development in Microtechnologies—IMT Bucharest, 126A Erou Iancu Nicolae Street, 077190 Bucharest, Romania
cMilitary Technical Academy, “Ferdinand I”, 39-49 G. Cosbuc Blvd., Bucharest, 050141, Romania
dResearch and Innovation Center for CBRN Defense and Ecology, 225 Oltenitei Avenue, District 4, Bucharest, Romania
e“Ilie Murgulescu” Institute of Physical Chemistry, Romanian Academy, 202 Splaiul Indepedentei, Bucharest, 060021, Romania
fResearch Institute of the University of Bucharest, ICUB Bucharest, Soseaua Panduri, nr. 90, Sector 5, Bucharest, 050663, Romania
First published on 20th November 2024
Abstract
The primary aim of this study was to synthesize and characterize polyurethane (PUR) foams derived from the depolymerization products of poly(ethylene terephthalate) (PET) and MXenes (Nb2AlC). The depolymerized PET products were produced through a zinc acetate-catalyzed glycolysis process using diethylene glycol (DEG) as solvent. These glycolysis products were then reacted with 4,4′-diphenylmethane diisocyanate (MDI), commercial polyols, and MXenes to produce the PUR foams. The resulting materials were characterized using FT-IR, SEM, EDX mapping, mechanical testing, thermal analysis, and electromagnetic interference (EMI) shielding assessments. The analysis revealed that specimens with a higher concentration of the filler (3.55%) exhibited superior mechanical properties, while the thermal behavior remained relatively unchanged. The sample containing 2.56% of MXenes showed significant potential as an effective EMI shielding material in the 8–9 GHz frequency range, while the blank sample provided the best performance between 9–13 GHz, mostly due to a bigger high-frequency absorption in the upper part of the X band. Regarding mechanical performance, the compression force increased slightly from 1013.31 N to 1013.71 N as the Mxenes concentration increased from 2.56% to 3.55%.
1 Introduction
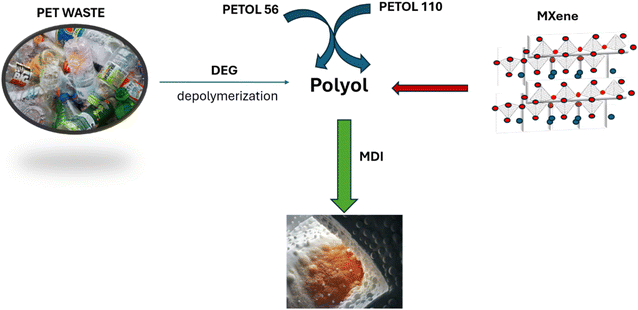
Polyethylene terephthalate (PET) is a highly significant and widely utilized engineering thermoplastic, commonly found in products like water bottles, food packaging, and synthetic textiles.1 Its lightweight, durability, and versatility make PET an indispensable material in modern-day society.2The increasing use of PET has led to a global crisis in waste management, as the improper disposal of PET products has caused significant environmental damage.3 Recycling PET is essential for addressing this issue, as it can greatly decrease the amount of plastic waste that ends up in landfills or oceans. The recycling process involves collecting used PET products, processing them into new materials, and repurposing them for the production of new products.
The recycling strategy defines 4 different categories for PET waste: re-extrusion (primary recovery), mechanical recycling (secondary recycling), chemical recycling (tertiary recycling), and energy recovery (quaternary recycling).4
Chemical recycling is a key strategy that allows PET waste to gain new functionalities through closed-loop, upcycling, or downcycling methods.5 For example, closed-loop recycling converts PET waste into products with comparable functionality, reducing the demand for virgin monomers. Upcycling, on the other hand, enhances the value of PET-based products by transforming PET bottle waste into high-performance textiles or mechanically resilient composites.6,7 Lastly, downcycling converts PET into lower-value or lower-quality products, such as construction materials or non-food packaging which are harder to recycle although their lifespan is extended.7
Thus, based on these chemical directions, a good opportunity to give PET waste a new life determined many researchers to develop new chemical recycling methods that involve mainly: (i) hydrolysis method; (ii) methanol alcoholysis method; (iii) ethylene glycol alcoholysis method; (iv) alcohol–alkali combined depolymerization method, and (v) ammonolysis.8
Our team was involved in PET recycling by the chemical method through glycolysis reactions both in conventional9 and microwave-assisted reactions.10 To produce new innovative composite materials our research was continuously directed to the reuse of oligomers, respectively monomers resulting from the depolymerization process of PET. Thus, the first innovative products that we obtained were polyurethane adhesives and rigid polyurethane foams.11
More recently, our team investigated the utilization of recycled PET by the chemical method to synthesize a new type of polyurethane flexible foam used as a filling agent namely fly ash, and glass wastes,12 respectively red mud and pyrite.13
In both articles previously published, the mechanical properties of the polyurethane flexible foams decreased as the amount of the filling agent increased. This behavior is attributed to the micro- to millimeter-scale size of the filling agent, which leads to non-homogeneous foam synthesis. Reducing the size of the filling agent could potentially improve uniformity, enhance mechanical properties, and ensure reproducibility of the formulated specimens, but this would likely result in higher production costs. To justify these increased costs, the new foams must demonstrate significantly superior properties compared to those currently available on the market.
MXenes is the denomination of several transition metal carbides, nitrides, or carbonitrides typically obtained by chemical delamination of 3D ternary (or quaternary) compounds known as MAX phases.14 MXenes have a general formula Mn+1XnTx (n = 1–3), where M represents a transition metal (such as Sc, Ti, Zr, Nb, and others), X is carbon and/or nitrogen and Tx represents the hydroxyl, oxygen, or fluorine terminations derived from the synthesis procedures.15 Since their discovery of Ti3C2Tx – 2D compound in 2011,16 nearly thirty compounds have already been synthesized and many more were predicted theoretically.
Today, with the rapid advancement of electronic technology and digital communication systems, particularly in fifth-generation (5G) communication, electromagnetic (EM) radiation has emerged as a new form of environmental pollution.17 The heavy EM radiation contamination not only severely disrupts the functioning of electronic equipment but also harms mankind's health and compromises information security.18 Although traditional metallic materials, owing to their superior electrical conductivity, have been extensively applied as outstanding EMI shielding materials, their shortcomings of poor mechanical flexibility, exceptionally high density, costly processing, and vulnerability to corrosion significantly prevent their application.19 As new materials for EMI shielding are evolving, polyurethane foams have been regarded as potential alternatives because of their lightweight, easy processing, low cost, and excellent anticorrosive properties compared to metal-based materials.20,21 Additionally, MXenes started to be intensively used in EMI shielding applications due to their superior properties in terms of electroconductivity, chemical functionality, ease of surface modification, excellent flexibility, and facile processing in polymer matrix compared to other carbonaceous fillers like carbon nanotubes or graphene.20,22–24
Building on our previous work with MXenes,25 which focused on synthesizing and characterizing nanocomposites based on polymer colloids (PC) and MXenes for EMI shielding applications – specifically in paints – this study aims to combine the properties of MXenes with polyurethane foams to create a novel material for EMI shielding. A key advantage of this new material is its low production cost, achieved by utilizing PET waste, which aligns with recycling principles and leads to the development of materials with promising mechanical, thermal, and EMI shielding properties.
2 Materials and methods
2.1 Materials
Polyethylene terephthalate (PET) having a molecular weight Mn = 25![[thin space (1/6-em)]](https://www.rsc.org/images/entities/char_2009.gif) 000 g mol−1 was used as flakes from post-consumer bottles. Diethylene glycol (DEG) (Fluka), zinc acetate (Fluka), 4,4′-diphenylmethane diisocyanate (MDI) (Aldrich), PETOL 110 (Mn = 110 g mol−1-diol) (Oltchim, S.A. Romania), PETOL 56 (Mn = 56 g mol−1-triol) (Oltchim, S.A. Romania), Nb2AlC-MXenes (Sigma-Aldrich), and triethylamine (TEA) (Aldrich) were used as received.
000 g mol−1 was used as flakes from post-consumer bottles. Diethylene glycol (DEG) (Fluka), zinc acetate (Fluka), 4,4′-diphenylmethane diisocyanate (MDI) (Aldrich), PETOL 110 (Mn = 110 g mol−1-diol) (Oltchim, S.A. Romania), PETOL 56 (Mn = 56 g mol−1-triol) (Oltchim, S.A. Romania), Nb2AlC-MXenes (Sigma-Aldrich), and triethylamine (TEA) (Aldrich) were used as received.
2.2 Methods
| Sample codes | Polyol from PET (g) | MDI (g) | PETOL 110 (g) | PETOL 56 (g) | Mxenes (g) |
|---|---|---|---|---|---|
| Sample 0 (blank) | 3 | 11 | 3 | 2 | 0 |
| A | 3 | 11 | 3 | 2 | 0.3 |
| B | 3 | 11 | 3 | 2 | 0.5 |
| C | 3 | 11 | 3 | 2 | 0.7 |
2.3 Characterization
A common method for evaluating a material's shielding properties is to calculate the total EM shielding effectiveness (SE) using eqn (1), which can be obtained from either simulations or direct measurements, when possible:26
| SE (dB) = SER (dB) + SEA (dB) | (1) |
SE (dB) = SER (dB) + SEA (dB) = 10![[thin space (1/6-em)]](https://www.rsc.org/images/entities/char_2009.gif) log[(1 − |S11|2)−1] + 10 log[(1 − |S11|2)−1] + 10![[thin space (1/6-em)]](https://www.rsc.org/images/entities/char_2009.gif) log[(1 − |S11|2)/|S21|2] log[(1 − |S11|2)/|S21|2]
| (2) |
Two primary physical mechanisms for modulating SE can be identified from eqn (1), respectively eqn (2): (i) EM reflections (which are enhanced in metals due to their high conductivity and minimal absorption); (ii) absorption, which is attributed to dielectric losses and low conductivity. Unlike metals, where SE cannot be adjusted, the SE of composites such as polymer-based materials can be engineered by altering the concentration of their constituents and/or fillers.
Moreover, by using eqn (3) and (4) it is also possible to extract the high-frequency conductivity σ and skin depth δ of the tested foams loaded with MXenes:27
SER = 35.9 + 10![[thin space (1/6-em)]](https://www.rsc.org/images/entities/char_2009.gif) log[σ/(2πfμ0μr)] log[σ/(2πfμ0μr)]
| (3) |
 | (4) |
3 Results and discussion
3.1 PET-based polyol-GPC characterization and synthesis of polyurethane foams
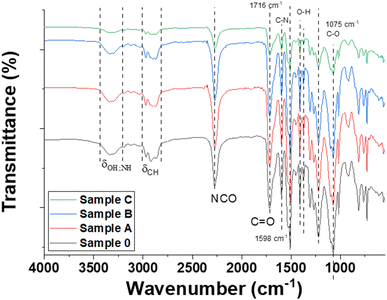
The first step of this study involved the depolymerization of PET flakes and the characterization of glycolysis products. The kinetics of the reaction was presented by our group elsewhere.9 Based on the previous experience, the PET flakes from post-consumer bottles were degraded in DEG as a glycolysis agent in the presence of zinc acetate catalyst at a temperature of 220 °C for 2 hours under a nitrogen atmosphere (as detailed in Section 2.2.1). The glycolysis products were investigated by GPC analysis to determine the molecular weight (Mn) and the dispersity index (PD) of the final product. Thus, the depolymerized PET registered a Mn of 420 g mol−1, while PD indicated a value of 1.2. These results are considered important for the next step of our study which consisted in the formulation of polyurethane foams based on the Mn of the polyol resulting from the depolymerization of PET. Thus, the synthesis of the polyurethane foams involved the use of MXenes, while keeping a constant molar ratio of the NCO/OH groups as presented in Table 1. The concentration of the filling agent (MXenes) varied from 1.55 up to 3.55% (weight), the codes representing the filler concentration.3.2 FT-IR analysis of the polyurethane foams
To evidence the reaction between the PET-based polyol and the isocyanate component, the PUR-based samples were investigated by FT-IR analysis (Fig. 1).In Fig. 1 the FT-IR analysis evidenced the characteristic vibrations of polyurethane structure for all samples filled with MXenes. The signal from 3342 cm−1 attributed to NH stretching and the signal from 1716 cm−1 assigned to C![[double bond, length as m-dash]](https://www.rsc.org/images/entities/char_e001.gif) O stretching confirmed the formation of urethane groups due to the reaction between the OH groups and NCO groups from MDI.28 Vibrations of CH2, respectively CH3 groups were registered at 2925 cm−1 and 2857 cm−1. The NCO group from 2267 cm−1 was attributed to the terminal groups of the polymeric chain. The C
O stretching confirmed the formation of urethane groups due to the reaction between the OH groups and NCO groups from MDI.28 Vibrations of CH2, respectively CH3 groups were registered at 2925 cm−1 and 2857 cm−1. The NCO group from 2267 cm−1 was attributed to the terminal groups of the polymeric chain. The C![[double bond, length as m-dash]](https://www.rsc.org/images/entities/char_e001.gif) C registered at 1598 cm−1 can be assigned to the MDI hard segments' aromatic rings or those from the terephthalate unit. The peak from 1520 cm−1 was attributed to the N–H bending in the plane of the amide group. Another indication that the reaction took place was proved by the CN stretching vibrations in amine assigned at 1219 cm−1.29 Also, for samples A, B, and C the vibration specific for the MAX phase at 550 cm−1 is noticed.30 It can be concluded that the above-mentioned samples are consistent with their chemical composition based on PUR foams and MXenes components.
C registered at 1598 cm−1 can be assigned to the MDI hard segments' aromatic rings or those from the terephthalate unit. The peak from 1520 cm−1 was attributed to the N–H bending in the plane of the amide group. Another indication that the reaction took place was proved by the CN stretching vibrations in amine assigned at 1219 cm−1.29 Also, for samples A, B, and C the vibration specific for the MAX phase at 550 cm−1 is noticed.30 It can be concluded that the above-mentioned samples are consistent with their chemical composition based on PUR foams and MXenes components.
3.3 SEM analysis, the pore size distribution and the density of the polyurethane foams
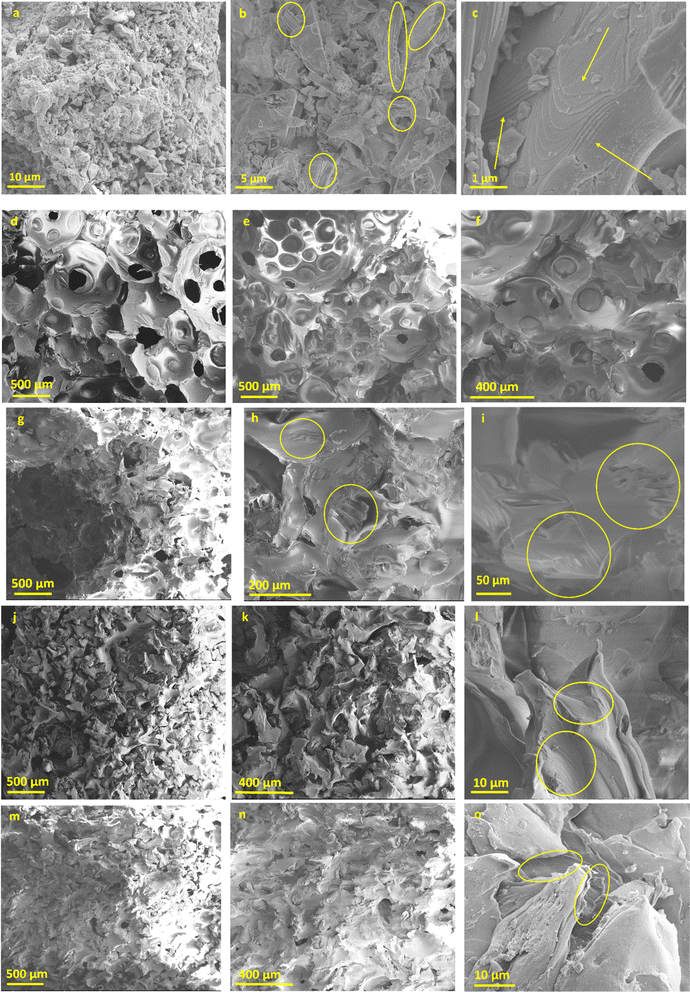
The next step of this study involved examining the morphology of all samples using SEM analysis. As shown in Fig. 2, the Nb2AlC-MXenes appear irregular and powder-like at low magnifications (Fig. 2a, 1000×). However, at higher magnifications (Fig. 2b, 10![[thin space (1/6-em)]](https://www.rsc.org/images/entities/char_2009.gif) 000×), certain areas (highlighted by yellow circles) reveal lamellar structures. In the detailed image taken at 50
000×), certain areas (highlighted by yellow circles) reveal lamellar structures. In the detailed image taken at 50![[thin space (1/6-em)]](https://www.rsc.org/images/entities/char_2009.gif) 000× magnification (Fig. 2c), the yellow arrows further illustrate these lamellar features, showing that the MXenes are compactly folded, these results being in good agreement with the literature data.31,32
000× magnification (Fig. 2c), the yellow arrows further illustrate these lamellar features, showing that the MXenes are compactly folded, these results being in good agreement with the literature data.31,32
For the PUR blank sample, analysis was conducted in different areas at two magnifications (Fig. 2d and e, 100×; Fig. 2f, 200×), indicating large pore formation. For Sample A, loaded with the lowest concentration of Nb2AlC, Fig. 2g revealed a porous structure at 100× magnification. The detailed images (highlighted by yellow circles) further showed the presence of exfoliated Nb2AlC (Fig. 2h and i). This suggests that dispersing MXenes into the polyol component followed by curing disrupted the naturally folded structure of the carbide-based MXenes. For the other two samples loaded with 0.5 g and 0.7 g MXenes, respectively, more compact structures were observed as the pore size decreased in Sample B (Fig. 2j and k) and Sample C (Fig. 2m and n). The detailed images for these samples (Fig. 2l and o) also showed exfoliated/detached MXenes embedded in the PUR matrix. Another important factor is the dispersibility of the MXenes within the PUR matrix, which leads to a uniform appearance of the samples and ensures an even distribution of the powder-like component throughout the polymer matrix, as illustrated in Fig. 3.
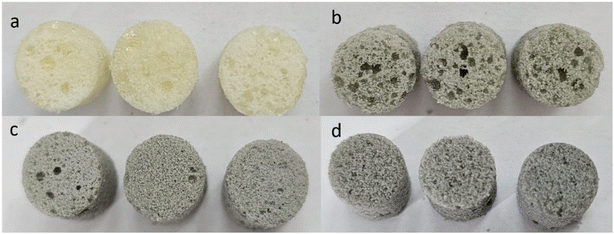 | ||
| Fig. 3 Images of blank sample (Sample 0) (a), Sample A (b), Sample B (c), and Sample C (d) that present the uniform distribution of MXenes. | ||
In the ESI,† we provide spectra for all samples and element distributions to support our SEM analysis, obtained via the EDX mapping procedure (Fig. S1–S4†). Two magnifications, at 200 μm and 10 μm, reveal consistent information about the presence of MXenes in all PET-based PUR foam-modified samples, confirmed by the uniform distribution of Al and Nb at both larger and smaller scales. For Sample 0, the EDX mapping and spectrum confirm the presence of C, N, and O, characteristic of the elemental composition of PUR (Fig. S1†). In PUR samples modified with varying Nb2AlC concentrations, EDX mapping at smaller scales (10 μm) shows that the MXenes are covered by the polymer matrix, as indicated by the presence of N from the blank PUR sample. Element quantification for all samples (Fig. S1b, S2b, S3b, and S4b†) shows an increase in Al atomic percentage from 0.19% to 0.36% as MXenes concentration rises from Sample A (Fig. S2-b†) to Sample C (Fig. S4-b†). However, for Sample C, the Nb element had lower atomic value compared to previous samples, which can be attributed to an agglomeration of the filling agent and probably poorer dispersion conditions in the polymer matrix (Fig. S4†).
To prove that the pore size is lower as the content of MXenes increased, the pore size distribution and the mean diameter of the pores for the blank sample and PUR foams loaded with Nb2AlC were obtained from SEM images by measuring around 200 pores. Consequently, the pore sizes were found to range from 52 μm to 485 μm, 40 μm to 537 μm, 40 μm to 253 μm, and 35 μm to 208 μm for Sample 0, A, B, and C, respectively (Fig. 4). The histogram was best fitted with the Gauss function. The highest percentage of pores for Samples 0, A, B, and C were found to be within 74–182 μm, 54–171 μm, 83–170 μm and 58–173 μm diameter size range having the mean diameter 119 ± 67 μm (Sample 0), 145 ± 70 μm (Sample A), 131 ± 41 μm (Sample B), 80 ± 34 μm (Sample C). Thus, by increasing the concentration of MXenes in the polymer matrix, the mean diameter of the pores decreased as suggested by the areas investigated through SEM analysis.
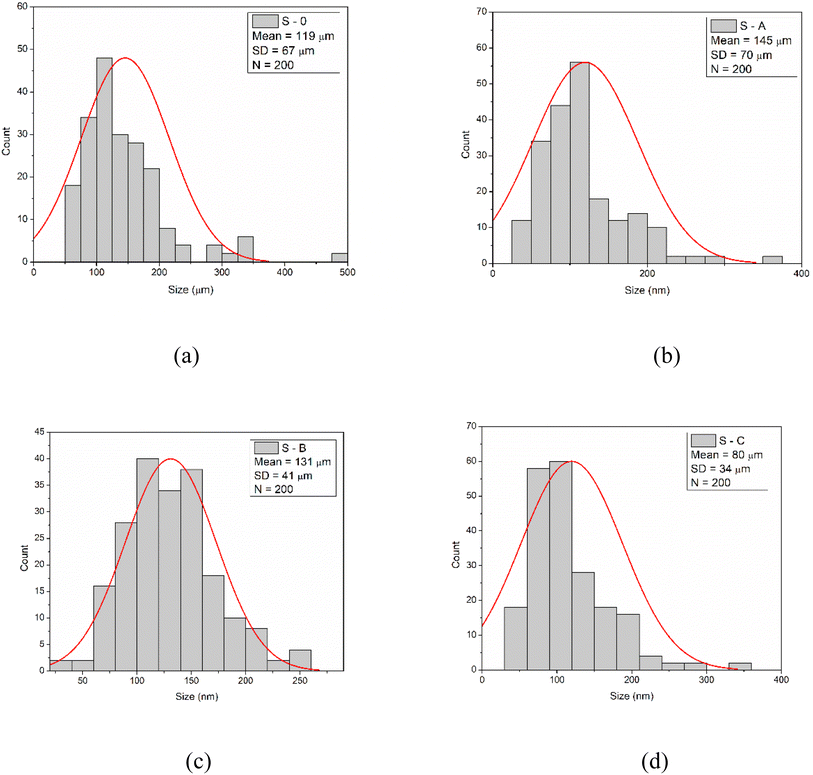 | ||
| Fig. 4 Pore size distribution and mean size diameter for Sample 0 (a), Sample A (b), Sample B (c), and Sample C (d). | ||
3.4 Density of the PUR-MXenes-based composites
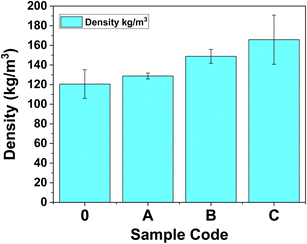
According to the determinations performed using ASTM D7710-14 as described in Section 2.3.4, the densities of the PUR foams varied from 120.51 ± 14.55 kg m−3 for Sample 0 to 128.75 ± 3.03 kg m−3 for Sample A, 148.82 ± 7.07 14.55 kg m−3 for Sample B, respectively 165.74 ± 25.05 kg m−3 for Sample C.Fig. 5 presents the evolution of the density of the PUR specimens with the MXenes content. As expected, the density increases with the concentration of MXenes loaded and is in good agreement with the pore size distribution (densities increase, pore size decrease).33,34
3.5 XRD characterization of the PUR-formulated foams
To prove the characteristic diffraction peaks of Nb2AlC the next stage of this study consisted of performing XRD analysis on the MXenes powder and the PUR-based foams loaded with MXenes. Thus, the XRD pattern of the PUR blank sample, Sample 0 (Fig. 6 – black line), presents a broad diffraction peak at ∼20°, which agrees with other XRD studies.35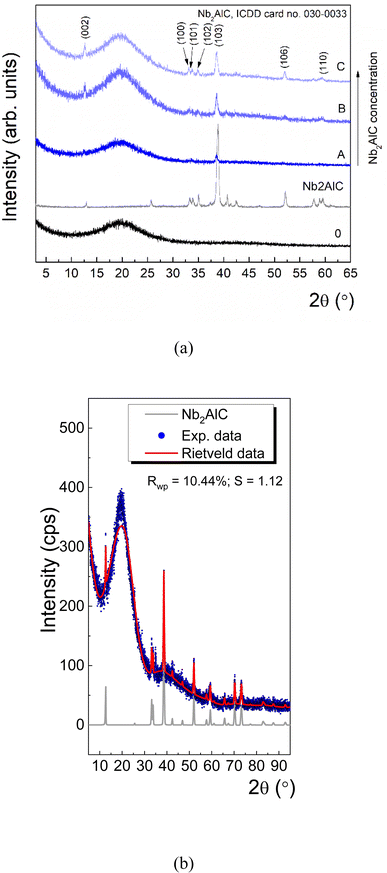 | ||
| Fig. 6 The XRD pattern for Nb2AlC and PUR loaded with Nb2AlC (a), and Rietveld refinement for Sample C (b). | ||
The Nb2AlC presents a set of diffraction peaks at 2θ = 12.86, 25.77, 33.32, 33.86, 35.11, 37.44, 38.84, 40.63, 42.42, 52.09, 57.64, 58.89, 59.61° which can be unambiguously ascribed to different (hkl) reflections of hexagonal Nb2AlC with a = b = 0.31 nm; c = 1.38 nm, according to ICDD (International Centre for Diffraction Data) database, card no. 030-0033. Further, with increasing the Nb2AlC concentration in the PUR matrix (i.e. from 0.3 g up to 0.7 g) it is obvious the formation of new diffraction peaks, which are given by (002), (100), (101), (102), (103), (106), (110) atomic planes of Nb2AlC (Fig. 6a). The crystallinity of Nb2AlC was evaluated by the Scherrer equation, which gives the relationship between the mean crystallite size and the broadening of the diffraction peaks.36 The analysis of the (103) main diffraction peak with a pseudo-Voigt fit reveals that the Full Width at Half Maximum (FWHM) is ∼0.27 (Nb2AlC), while for the composites its value ranges between ∼0.47 and ∼0.30 as the concentration increases. By applying the Scherrer equation, it was found that τ ∼30 nm for the initial Nb2AlC powder varies from ∼15 nm to ∼27 nm as the Nb2AlC increases in the PUR matrix. At the same time, one can note a shift of the (103) diffraction peak at smaller values from 2θ = 38.95° towards 2θ = 38.69°, which indicates a non-negligible tensile lattice strain in Nb2AlC after embedding in the PUR matrix.
Likewise, Rietveld refinement of Sample C (Fig. 6b) indicates the co-existence of PUR and Nb2AlC, and in addition, it shows the presence of a non-negligible lattice strain, ε ∼ +0.16%. At the same time, the mean crystallite size derived from the Rietveld refinement ∼28 nm is very close to the initial Nb2AlC powder. Thus, the XRD results are in good agreement with the morphological aspect of the samples proved by the detailed SEM images (Fig. 2f, i, l, and o respectively) that indicated a less folded structure of the Nb2AlC embedded in the PUR foam structure.
3.6 Compression tests of the polyurethane foams
Considering the practical application of the PUR-based samples filled with MXenes that can be used as insulator materials that can cover electronic equipment for EMI shielding compression tests were employed to determine the mechanical behavior of all specimens under loading.Thus, Fig. 7 illustrates the stress–strain plots for compression tests, while Table 2 compares the maximum force measured for each specimen. The comparison of the mechanical performance of the PUR-based samples was made based on the mean value of force expressed in N (Table 2 – last column).
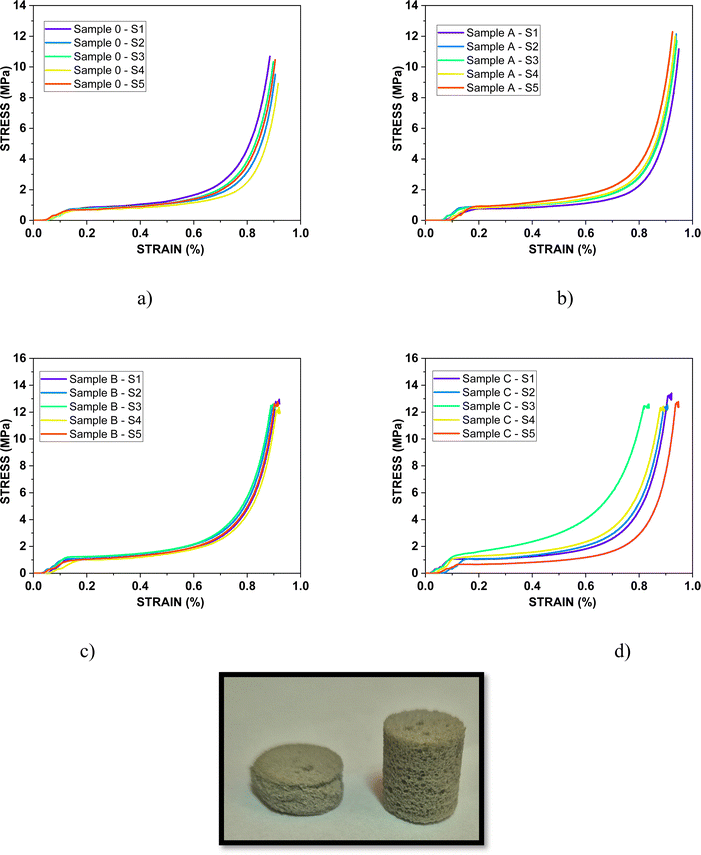 | ||
| Fig. 7 Stress–strain plots for Samples 0, A, B, and C and the optical image of the sample recorded before and after the compression test. | ||
| Sample code | Max force (N) | Max force (N) | Max force (N) | Max force (N) | Max force (N) | Mean value, (N) |
|---|---|---|---|---|---|---|
| Specimen 1 | Specimen 2 | Specimen 3 | Specimen 4 | Specimen 5 | ||
| Sample 0 | 881.58 | 737.24 | 869.04 | 716.41 | 846.43 | 810.14 |
| A | 930.64 | 982.45 | 984.87 | 992.75 | 974.95 | 973.13 |
| B | 1007.06 | 1012.88 | 1019.48 | 1012.76 | 1014.68 | 1013.37 |
| C | 1017.39 | 1016.96 | 1010.46 | 1010.73 | 1013.03 | 1013.71 |
The compression mechanical tests of the foams confirmed that the compression stress and compression strain increased for the samples in which the highest concentration of reinforcing agent was added. Thus, the best mechanical performances were registered by Sample C, respectively Sample B. Thus, the next analysis will be performed for Sample 0 and C, comparatively.
Based on the allure of the curves it can be noticed that three regions characterize the mechanical behavior of all samples, namely the elastic zone, the plateau zone, and the densification zone which were confirmed also by Petrů and Novák.37
The first step of the compression test takes place from the moment the cell walls approach under continuous loading until they begin to collapse. In the plateau stage, buckling of the samples under pressure occurs, while in the final stage, cell wall collapse occurs until reaching the opposite walls, which determines the densification of polyurethane foam.
The presence of MXenes extended the elastic region and increased the slope of the curves due to the higher rigidity of the cellular walls. For the plateau region, the slope increased slightly due to the incorporation of the Nb2AlC powder in the cellular structure. This led to a reinforcing of the cell walls that determined a higher mechanical resistance of the porous matrix.38 Furthermore, the propagation of the crack seems to be delayed giving higher resistance to complete breaking/collapse. All these mechanical improvements were registered for all samples compared with the blank sample and are influenced by the highest concentration of the filling agent and the uniform distribution of the fillers in the structure of the foams. The values registered for the compressive stress indicate that these types of materials may be suitable for use in the civil engineering industry.39–41
3.7 Thermal characterizations of the polyurethane foams
To explore the potential applications of the formulated foams, additional insights can be gained through TGA and DSC analyses. Before 230 °C, all specimens exhibited a similar weight loss of approximately 5%, attributed to the evaporation of water and the removal of low molecular weight additives. In Fig. 8, two major decomposition stages are identified within the temperature ranges of 230–320 °C and 450–480 °C, respectively. These stages correspond to the characteristic two-step decomposition of urethane bonds and the cleavage of polymer chains42 in Sample C (which contains the highest concentration of MXenes, Fig. 8 – red line). In contrast, Sample 0 (Fig. 8 – black line) shows three distinct stages of decomposition, with an additional step observed between 350–450 °C.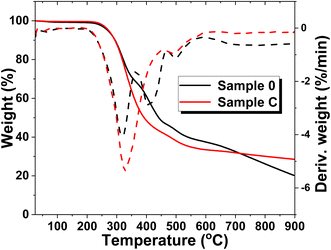 | ||
| Fig. 8 TGA and DTA analysis of blank sample, Sample 0, and polyurethane foams filled with the highest concentration of MXenes (0.7 g), Sample C. | ||
Between 320–400 °C, the Gram-Schmidt profile indicates the degradation of volatile compounds, the release of isocyanates and alcohols, and the breakdown of hard segments.43 Beyond 500 °C, the polymer matrix is completely degraded in all samples. Despite both samples experiencing significant weight loss between 230–500 °C, Sample C demonstrates higher thermal stability than Sample 0, as evidenced by a higher residual weight of approximately 30% compared to 20% for the blank sample. Additionally, the weight loss in Sample C occurs at a slower rate compared to Sample 0, suggesting an enhancement in thermal properties due to the presence of MXenes within the polyurethane foam structure. This improvement is further supported by the absence of the weight loss step observed in the blank sample, but not in Sample C.
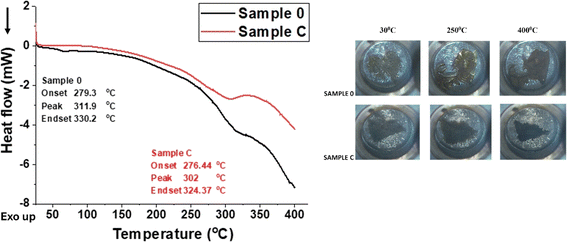
Fig. 9 is composed of two main sections describing the DSC graph for the thermal behavior of Sample 0, respectively Sample C and a set of microscope images taken during the DSC analysis showing the differences in structural change at three different temperatures of both samples.
Sample 0 shows a slightly abrupt slope between 280 °C and 350 °C, indicating a more rapid exothermic reaction, likely due to the breakdown of the PUR matrix without MXenes compared with Sample C. However, comparing the Tg of the two samples, it can be noticed that the values are close, the difference being around 10 °C. Taking into account that Sample C has a lower Tg, it can be concluded that the foam is more flexible compared to Sample 0 (compression tests proved an extension of the elastic zone) and the macromolecular chains slide over each other more easily, due to the presence of detached/exfoliated MXenes (evidenced by SEM and XRD analysis).
3.8 EMI shielding properties
To evaluate the EMI shielding properties for the synthesized materials at microwave frequencies, we employed a waveguide-based experimental setup25 to analyse their reflection and transmission properties covering frequencies from 8.2 to 12.4 GHz, known as the X band. This frequency range is particularly important for high-frequency applications being extensively used in radar systems for air control, weather, terrestrial and space communications, traffic light motion sensors, and RF sources for particle accelerators in medical applications. EMI poses significant issues by severely degrading the performance of electronics affecting not only their life expectancy but also altering the quality signal of the device. To mitigate these issues, various materials have been investigated for EMI protection, including pristine conductive polymers or hybrid composites of the polymers with carbonaceous materials like graphene, carbon nanotubes, and other nanofillers.44 Over the past decade, the development of two-dimensional (2D) atomically thin structures has led to new materials with EMI shielding capabilities comparable to carbon-based nanomaterials, such as MXenes which is a new class of transition metal carbides, nitrides, and carbonitrides.45 Therefore, materials can be engineered to provide either EM transparency or EMI shielding properties based on specific application needs.26As previously described in Section 2.3.9, the EMI shielding capabilities of Sample 0, A, B, and C, were determined using a calibrated VNA connected to two X-band waveguide transitions. The specimens were placed between these transitions, allowing us to record the scattering (S) parameters at the two ports of the VNA. Based on the measured S parameters (Fig. 10a), all relevant quantities were calculated using eqn (1)–(4) as outlined in Section 2.3.9.
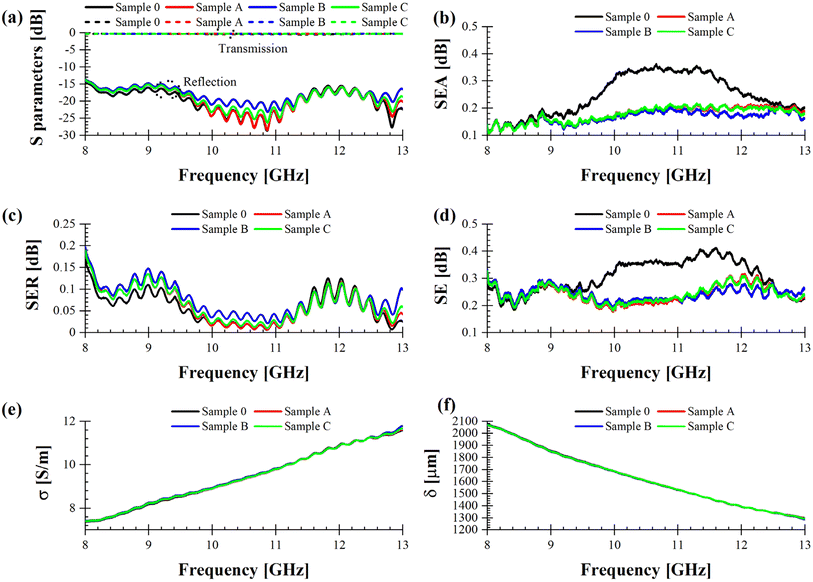 | ||
| Fig. 10 (a) Measured S parameters. Extracted (b) SEA, (c) SER, (d) SE, (e) conductivity, and (f) skin depth for blank PUR foam and the specimens loaded with MXenes in the X band. | ||
Fig. 10b–d show that Sample 0 (solid black line) provides the best performance between 9 and 13 GHz, mostly due to a bigger high-frequency absorption in the upper part of the X band; this means that the addition of MXenes does not entail a monotonic change of sample's performance in terms of EMI shielding in this particular frequency range. This could be ascribed in principle to an agglomeration of the filling agent in the polymeric matrix. However, we can observe an improvement of the EMI shielding characteristics in the 8–9 GHz frequency range (Fig. 11), which could be suitable for dedicated military and/or civilian applications requiring specific frequencies for secured telecommunications.
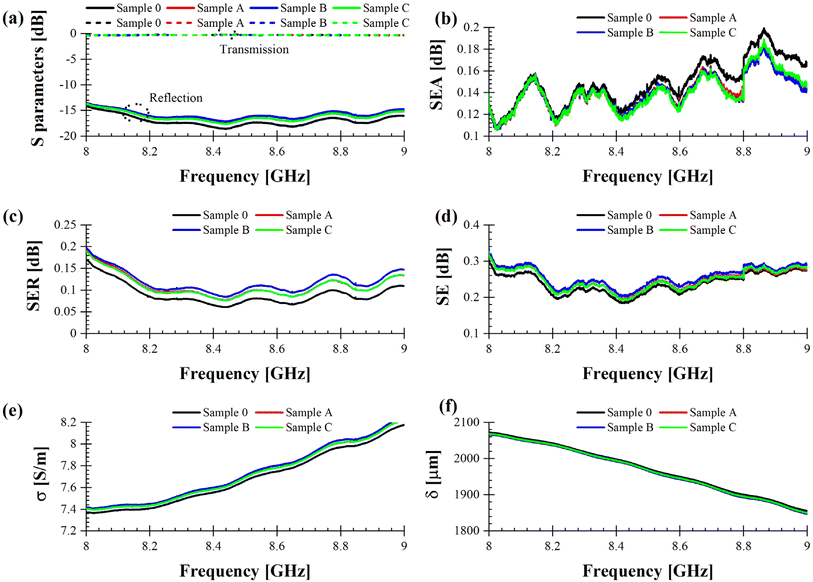 | ||
| Fig. 11 (a) Measured S parameters. Extracted (b) SEA, (c) SER, (d) SE, (e) conductivity, and (f) skin depth for blank PUR foam and the specimens loaded with MXenes in the 8–9 GHz band. | ||
Even if all the characterized samples exhibit good transmission and reflection properties (|S21| is always between 0 and −0.5 dB, whereas |S11| is always between −15 and −30 dB), Fig. 11 demonstrates that Sample B (solid blue line) offers the best EMI shielding performance (Fig. 11d) mostly due to the highest SER values (Fig. 11c), which translate into a bigger attenuation of the EM signal propagating in the waveguide, i.e., a degradation of the reflection coefficient with about 1.5 dB with respect to Sample 0. This result is corroborated by Fig. 11e, in which the conductivity σ of Sample B spans in the range 7.4–8.2 S m−1. This value is at least 50% greater than the conductivity of seawater, which is about 5 S m−1. Hence, the enhancement of the conductivity comes from the concentration of MXenes. Finally, the values of the skin depth δ (Fig. 11f) are strictly related to those of the conductivity, for the following reason: an increase of σ entails a decrease of δ and, most of all, a general rule of thumb for any conductive material is to have a thickness which is at least double with respect to its skin depth, to prevent the penetration of the high-frequency EM field inside the materials itself and, hence, additional losses. Since the thickness of all specimens' spans between 5.1 mm (Sample C), 5.82 mm (Sample B), 5.51 mm (Sample A) and 6.61 mm (Sample 0) it is evident that the skin depth has an abrupt decrease for increasing frequencies since the thickness of each sample becomes much greater than the corresponding skin depth.
As a whole, Sample B has the potential to be a good EMI shielding material and we expect that a further increase of the MXenes content will enhance the shielding properties, by keeping at the same time an acceptable degree of mechanical flexibility. The latter characteristic is an added value since it can follow the shape of the object to shield it from EMI. We stress here that for all the composite materials described in this work, the results are consistent and reproducible after systematic measurements.
4 Conclusions
This study highlighted the synthesis and characterization of polyurethane foams manufactured from industrial PET wastes and MXenes. Thus, the polyol component was comprised not only of different commercial polyols but also of glycolysis products resulting from PET depolymerization in the presence of DEG bringing added value to the newly formulated products in terms of recycling plastic wastes. The resulting PUR foam specimens were characterized by FT-IR, SEM, density measurements, XRD, mechanical, and thermal analysis, as well as EMI shielding capabilities.The FT-IR results showed the presence of urethane bond formation in all cases. SEM micrographs revealed that as the MXenes content increased from Sample A to Sample C, the structure became more compact, with a statistically significant reduction in pore size diameter. Additionally, SEM images showed a detached or unfolded appearance of the close-packed lamellar structures of Nb2AlC within the polymer matrix. EDX analysis and mapping indicated the presence and incorporation of Mxenes in all PUR samples both at larger (200 microns) and smaller scales (10 microns). The density of the PUR foams increased from 120 to nearly 170 kg m−3 with higher MXenes content. XRD analysis demonstrated tensile lattice strains in Nb2AlC after incorporation into the PUR matrix, indicated by a shift in the (103) diffraction peak from 2θ = 38.95° to 2θ = 38.69° proving a less folded structure compared with the packed lamellar structure of the pristine Mxenes. Compression tests revealed that Sample B and Sample C had similar performance, while the thermal behavior of Sample C was not significantly different from that of Sample 0.
Regarding EMI shielding properties, Sample B has the potential to become an effective EMI shielding material in the 8–9 GHz band, which could be suitable for dedicated military and/or civilian applications requiring specific frequencies for secured telecommunications.
It is anticipated that increasing the MXenes content further will enhance the shielding effectiveness while keeping an acceptable degree of mechanical performance.
Data availability
Data supporting this study are openly available from the corresponding authors.Conflicts of interest
All authors declare no conflicts of interest.Acknowledgements
This research was supported in part by the Romanian Ministry of Research, Innovation, and Digitalization through the Core Program within the National Research Development and Innovation Plan 2022–2027, under the Core Project “μNanoEl”, project no. PN 2307. The authors acknowledge the financial support received from the Competitiveness Operational Program 2014–2020 Priority Axis: research, technological development, and innovation (RDI) in support of economic competitiveness and business development operation stimulating the demand of enterprises for innovation through RDI projects carried out by enterprises individually or in partnership with R&D institutes and universities to innovate processes and products in economic sectors that have growth potential, project title “Greenol-Biopolyols obtained through an unconventional technology of vegetal waste recovery”, project code: 122990.References
- T. Muringayil Joseph, S. Azat, Z. Ahmadi, O. Moini Jazani, A. Esmaeili, E. Kianfar, J. Haponiuk and S. Thomas, Polyethylene terephthalate (PET) recycling: A review, Case Stud. Chem. Environ. Eng., 2024, 9, 100673 CrossRef CAS.
- P. Sarda, J. C. Hanan, J. G. Lawrence and M. Allahkarami, Sustainability performance of polyethylene terephthalate, clarifying challenges and opportunities, J. Polym. Sci., 2022, 60(1), 7–31 CrossRef CAS.
- M. G. Kibria, N. I. Masuk, R. Safayet, H. Q. Nguyen and M. Mourshed, Plastic Waste: Challenges and Opportunities to Mitigate Pollution and Effective Management, Int. J. Environ. Res., 2023, 17(1), 20 CrossRef CAS PubMed.
- F. Zhang, F. Wang, X. Wei, Y. Yang, S. Xu, D. Deng and Y.-Z. Wang, From trash to treasure: Chemical recycling and upcycling of commodity plastic waste to fuels, high-valued chemicals and advanced materials, J. Energy Chem., 2022, 69, 369–388 CrossRef CAS.
- J. Yang, Z. Li, Q. Xu, W. Liu, S. Gao, P. Qin, Z. Chen and A. Wang, Towards carbon neutrality: Sustainable recycling and upcycling strategies and mechanisms for polyethylene terephthalate via biotic/abiotic pathways, Eco-Environ. Health, 2024, 3(2), 117–130 CrossRef PubMed.
- R. Meys, F. Frick, S. Westhues, A. Sternberg, J. Klankermayer and A. Bardow, Towards a circular economy for plastic packaging wastes – the environmental potential of chemical recycling, Resour., Conserv. Recycl., 2020, 162, 105010 CrossRef.
- F. Weiland, M. Kohlstedt and C. Wittmann, Biobased de novo synthesis, upcycling, and recycling—the heartbeat toward a green and sustainable polyethylene terephthalate industry, Curr. Opin. Biotechnol., 2024, 86, 103079 CrossRef CAS PubMed.
- A. Bohre, P. R. Jadhao, K. Tripathi, K. K. Pant, B. Likozar and B. Saha, Chemical Recycling Processes of Waste Polyethylene Terephthalate Using Solid Catalysts, ChemSusChem, 2023, 16(14), e202300142 CrossRef CAS PubMed.
- E. Rusen, A. Mocanu, F. Rizea, A. Diacon, I. Calinescu, L. Mititeanu, D. Dumitrescu and A. M. Popa, Poly(ethylene terephthalate) Recycled from Post-Consumer Soft-Drinks Bottles I.Poly(ethylene terephthalate) depolymerization by glycolysis process, Mater. Plast., 2013, 50(2), 130–133 CAS.
- E. Rusen, A. Mocanu, F. Rizea, A. Diacon, I. Calinescu, L. Mititeanu, D. Dumitrescu and A. M. Popa, Post-consumer PET Bottles Recycling II. PET depolymerization using microwaves, Mater. Plast., 2013, 50(3), 201–207 CAS.
- E. Rusen, A. Mocanu, D. Fiat, A. M. Dumitrescu, P. O. Stanescu and A. Diacon, Straightforward Manufacturing of Polyurethane Adhesives and Foams from Post-consumer Poly(ethylene terephthalate) (PET) Bottles, Mater. Plast., 2015, 52(2), 209–213 Search PubMed.
- A. C. Mârșolea, A. Mocanu, P. O. Stănescu, O. Brincoveanu, C. Orbeci, R. Irodia, C. Pîrvu, A. Dinescu, C. Bobirica and E. Rusen, Synthesis and characterization of polyurethane flexible foams provided from PET derivatives, fly ash, and glass wastes, Heliyon, 2023, 9(12), e23097 CrossRef PubMed.
- A. C. Mârșolea, C. Orbeci, E. Rusen, P. O. Stanescu, O. Brincoveanu, R. Irodia, C. Pîrvu, A. Dinescu, C. Bobirica and A. Mocanu, Design of polyurethane composites obtained from industrial plastic wastes, pyrite and red mud, Constr. Build. Mater., 2023, 405, 133319 CrossRef.
- R. M. Ronchi, J. T. Arantes and S. F. Santos, Synthesis, structure, properties and applications of MXenes: Current status and perspectives, Ceram. Int., 2019, 45(15), 18167–18188 CrossRef CAS.
- M. Naguib, V. N. Mochalin, M. W. Barsoum and Y. Gogotsi, 25th Anniversary Article: MXenes: A New Family of Two-Dimensional Materials, Adv. Mater., 2014, 26(7), 992–1005 CrossRef CAS PubMed.
- M. Naguib, M. Kurtoglu, V. Presser, J. Lu, J. Niu, M. Heon, L. Hultman, Y. Gogotsi and M. W. Barsoum, Two-Dimensional Nanocrystals Produced by Exfoliation of Ti3AlC2, Adv. Mater., 2011, 23(37), 4248–4253 CrossRef CAS PubMed.
- Z. Li, Y. Sun, B. Zhou, Y. Feng, C. Liu and C. Shen, Flexible thermoplastic polyurethane/MXene foams for compressible electromagnetic interference shielding, Mater. Today Phys., 2023, 32, 101017 CrossRef CAS.
- E. G. Kıvrak, K. K. Yurt, A. A. Kaplan, I. Alkan and G. Altun, Effects of electromagnetic fields exposure on the antioxidant defense system, J. Microsc. Ultrastruct., 2017, 5(4), 167–176 CrossRef PubMed.
- R. Verma, P. Thakur, A. Chauhan, R. Jasrotia and A. Thakur, A review on MXene and its’ composites for electromagnetic interference (EMI) shielding applications, Carbon, 2023, 208, 170–190 CrossRef CAS.
- A. Iqbal, J. Kwon, M. K. Kim and C. M. Koo, MXenes for electromagnetic interference shielding: Experimental and theoretical perspectives, Mater. Today Adv., 2021, 9, 100124 CrossRef CAS.
- L. Liang, C. Yao, X. Yan, Y. Feng, X. Hao, B. Zhou, Y. Wang, J. Ma, C. Liu and C. Shen, High-efficiency electromagnetic interference shielding capability of magnetic Ti3C2Tx MXene/CNT composite film, J. Mater. Chem. A, 2021, 9(43), 24560–24570 RSC.
- Y. Liu, Y. Liu and X. Zhao, MXene Composite Electromagnetic Shielding Materials: The Latest Research Status, ACS Appl. Mater. Interfaces, 2024, 16(31), 41596–41615 CrossRef CAS PubMed.
- H. Zhang, J. Wan, R. Wu, Y. Chen, H. Yu and S. Shi, MXenes for electromagnetic interference shielding: Insights from structural design, Carbon, 2024, 218, 118716 CrossRef CAS.
- K. Chand, X. Zhang and Y. Chen, Recent progress in MXene and graphene based nanocomposites for microwave absorption and electromagnetic interference shielding, Arabian J. Chem., 2022, 15(10), 104143 CrossRef CAS.
- E. Rusen, A. Mocanu, O. Brincoveanu, A. Boldeiu, C. Romanitan, M. Aldrigo, S. Iordănescu, A. Diacon, G. Toader and R. Gavrila, MXenes and polymeric colloids nanocomposites for EMI shielding, J. Mater. Chem. C, 2024, 12(30), 11586–11593 RSC.
- Y. Tan, H. Luo, H. Zhang, X. Zhou and S. Peng, Lightweight graphene nanoplatelet/boron carbide composite with high EMI shielding effectiveness, AIP Adv., 2016, 6(3), 035208 CrossRef.
- M. H. Al-Saleh and U. Sundararaj, Electromagnetic interference shielding mechanisms of CNT/polymer composites, Carbon, 2009, 47(7), 1738–1746 CrossRef CAS.
- P. S. Lee, S.-C. Kim, E. T. Tikue and S. M. Jung, One-Pot Reaction of Waste PET to Flame Retardant Polyurethane Foam, via Deep Eutectic Solvents-Based Conversion Technology, J. Polym. Environ., 2022, 30(1), 333–343 CrossRef CAS.
- D. Cevher and S. Sürdem, Polyurethane adhesive based on polyol monomers BHET and BHETA depolymerised from PET waste, Int. J. Adhes. Adhes., 2021, 105, 102799 CrossRef CAS.
- T. Yousaf, A. Areeb, M. Murtaza, A. Munir, Y. Khan and A. Waseem, Silane-Grafted MXene (Ti3C2TX) Membranes for Enhanced Water Purification Performance, ACS Omega, 2022, 7(23), 19502–19512 CrossRef CAS PubMed.
- S. Tu, F. Ming, J. Zhang, X. Zhang and H. N. Alshareef, MXene-Derived Ferroelectric Crystals, Adv. Mater., 2019, 31(14), 1806860 CrossRef PubMed.
- P. A. Rasheed, R. P. Pandey, F. Banat and S. W. Hasan, Recent advances in niobium MXenes: Synthesis, properties, and emerging applications, Matter, 2022, 5(2), 546–572 CrossRef CAS.
- M. Ghorbandoust, M. Fasihi and R. Norouzbeigi, Tuning pore size and density of rigid polylactic acid foams through thermally induced phase separation and optimization using response surface methodology, Sci. Rep., 2024, 14(1), 12395 CrossRef CAS PubMed.
- O. Gotkiewicz, M. Kirpluks, Z. Walterová, O. Kočková, S. Abbrent, P. Parcheta-Szwindowska, U. Cabulis and H. Beneš, Biobased Ultralow-Density Polyurethane Foams with Enhanced Recyclability, ACS Sustain. Chem. Eng., 2024, 12(4), 1605–1615 CrossRef CAS.
- B. Noureddine, S. Zitouni, B. Achraf, C. Houssém, D.-R. Jannick and G. Jean-François, Development and Characterization of Tailored Polyurethane Foams for Shock Absorption, Appl. Sci., 2022, 12(4), 2206 CrossRef CAS.
- A. L. Patterson, The Scherrer Formula for X-Ray Particle Size Determination, Phys. Rev., 1939, 56(10), 978–982 CrossRef CAS.
- M. Petrů and O. Novák, Measurement and Numerical Modeling of Mechanical Properties of Polyurethane Foams, Aspects of Polyurethanes, IntechOpen, 2017 Search PubMed.
- M. H. Moghim, M. Keshavarz and S. M. Zebarjad, Effect of SiO2 nanoparticles on compression behavior of flexible polyurethane foam, Polym. Bull., 2019, 76(1), 227–239 CrossRef CAS.
- V. Calderón, S. Gutiérrez-González, J. Gadea, Á. Rodríguez and C. Junco, 10 – Construction Applications of Polyurethane Foam Wastes, in Recycling of Polyurethane Foams, ed. S. Thomas, A. V. Rane, K. Kanny, V. K. Abitha and M. G. Thomas, William Andrew Publishing, 2018, pp. 115–125 Search PubMed.
- D. M. Constantinescu and D. A. Apostol, Performance and Efficiency of Polyurethane Foams under the Influence of Temperature and Strain Rate Variation, J. Mater. Eng. Perform., 2020, 29(5), 3016–3029 CrossRef CAS.
- K. B. Park, H. T. Kim, N. Y. Her and J. M. Lee, Variation of Mechanical Characteristics of Polyurethane Foam: Effect of Test Method, Materials, 2019, 12(17), 2672 CrossRef CAS PubMed.
- R. Gu and M. M. Sain, Effects of Wood Fiber and Microclay on the Performance of Soy Based Polyurethane Foams, J. Polym. Environ., 2013, 21(1), 30–38 CrossRef CAS.
- J. Pagacz, E. Hebda, B. Janowski, D. Sternik, M. Jancia and K. Pielichowski, Thermal decomposition studies on polyurethane elastomers reinforced with polyhedral silsesquioxanes by evolved gas analysis, Polym. Degrad. Stab., 2018, 149, 129–142 CrossRef CAS.
- S. Parveen and A. Manju, Microwave Absorption and EMI Shielding Behavior of Nanocomposites Based on Intrinsically Conducting Polymers, Graphene and Carbon Nanotubes, in New Polymers for Special Applications, ed. Ailton De Souza, G., IntechOpen, Rijeka, 2012, ch. 3 Search PubMed.
- F. Shahzad, M. Alhabeb, C. B. Hatter, B. Anasori, S. Man Hong, C. M. Koo and Y. Gogotsi, Electromagnetic interference shielding with 2D transition metal carbides (MXenes), Science, 2016, 353(6304), 1137–1140 CrossRef CAS PubMed.
Footnotes |
| † Electronic supplementary information (ESI) available. See DOI: https://doi.org/10.1039/d4ra07447e |
| ‡ Co-authors equally contributed to this study. |
| This journal is © The Royal Society of Chemistry 2024 |

