 Open Access Article
A mitochondrial-targeted activity-based sensing probe for ratiometric imaging of formaldehyde reveals key regulators of the mitochondrial one-carbon pool†
Logan
Tenney
 a,
Vanha N.
Pham
 a,
Thomas F.
Brewer
 a and
Christopher J.
Chang
 *abc
*abc
aDepartment of Chemistry, University of California, Berkeley, CA 94720, USA. E-mail: chrischang@berkeley.edu
bDepartment of Molecular and Cell Biology, University of California, Berkeley, CA 94720, USA
cHelen Wills Neuroscience Institute, University of California, Berkeley, CA 94720, USA
First published on 25th April 2024
Abstract
Formaldehyde (FA) is both a highly reactive environmental genotoxin and an endogenously produced metabolite that functions as a signaling molecule and one-carbon (1C) store to regulate 1C metabolism and epigenetics in the cell. Owing to its signal-stress duality, cells have evolved multiple clearance mechanisms to maintain FA homeostasis, acting to avoid the established genotoxicity of FA while also redirecting FA-derived carbon units into the biosynthesis of essential nucleobases and amino acids. The highly compartmentalized nature of FA exposure, production, and regulation motivates the development of chemical tools that enable monitoring of transient FA fluxes with subcellular resolution. Here we report a mitochondrial-targeted, activity-based sensing probe for ratiometric FA detection, MitoRFAP-2, and apply this reagent to monitor endogenous mitochondrial sources and sinks of this 1C unit. We establish the utility of subcellular localization by showing that MitoRFAP-2 is sensitive enough to detect changes in mitochondrial FA pools with genetic and pharmacological modulation of enzymes involved in 1C and amino acid metabolism, including the pervasive, less active genetic mutant aldehyde dehydrogenase 2*2 (ALDH2*2), where previous, non-targeted versions of FA sensors are not. Finally, we used MitoRFAP-2 to comparatively profile basal levels of FA across a panel of breast cancer cell lines, finding that FA-dependent fluorescence correlates with expression levels of enzymes involved in 1C metabolism. By showcasing the ability of MitoRFAP-2 to identify new information on mitochondrial FA homeostasis, this work provides a starting point for the design of a broader range of chemical probes for detecting physiologically important aldehydes with subcellular resolution and a useful reagent for further studies of 1C biology.
Introduction
Formaldehyde (FA) is a reactive carbon species that plays diverse biochemical roles in physiology and disease across all kingdoms of life. This one-carbon aldehyde is a ubiquitous environmental toxin, where its sources include vehicle exhaust and forest fires, and in the chemical industry in the formulation of household products like plywood and resins.1 Indeed, the Environmental Protection Agency (EPA) has designated FA as a human carcinogen with the Occupational Safety and Health Administration (OSHA) setting permissible exposure limits of 0.75 ppm in workplace air.2,3 Elevations in FA are associated with serious diseases, including cancer, neurodegenerative diseases, heart disease, and diabetes.4,5 Concurrently, cells produce FA through several endogenous modes, including detoxification of alcohols and amines,6 enzymatic serine cleavage,7 oxidative folate metabolism,8 and demethylation of RNA and histones.9,10Along these lines, cells have evolved biochemical mechanisms to clear FA, and other aldehydes, in subcellular spaces to prevent their accumulation to toxic levels. For example, the cytosolic enzyme alcohol dehydrogenase 5 (ADH5) oxidizes the adduct of FA and glutathione, S-hydroxymethylglutathione, to form S-formylglutathione with subsequent release of formate.11 In mitochondria, aldehyde dehydrogenase 2 (ALDH2) directly oxidizes aldehydes, including FA, to more benign carboxylic acid products.12,13 Indeed, ALDH2 deficiency, presenting as alcohol-induced facial flushing, tachycardia, nausea, and headaches, is of the most common hereditary enzyme deficiencies, affecting 35–40% of East Asians and 8% of the world population.14 Mouse models lacking established modes of FA clearance by genetic ADH5 and/or ALDH2 knockout are predisposed to DNA damage with subsequent bone marrow failure and leukemia, highlighting the importance of metabolic clearance of endogenously produced FA.15 ALDH2 and ADH5 also act to redirect FA into the one-carbon (1C) metabolic cycle of the cell via conversion to formate, which is subsequently utilized as a 1C unit in the biosynthesis of nucleobases.8 Recently, we have demonstrated that FA serves as a signaling molecule, where it can post-translationally modify specific privileged cysteine sites in the proteome, including the terminal enzyme for S-adenosylmethionine (SAM) biosynthesis. FA-mediated SAM depletion, in turn, regulates the 1C metabolic cycle and epigenetics of the cell.16 This emerging body of work highlights the diverse roles of FA as a signaling molecule, 1C stock, and toxin, motivating the expanded development of chemical probes to enable studies of FA biology.
Recently, our laboratory17–22 and others23–27 have made advances in the development of activity-based sensing strategies28–30 to selectively image FA to probe its signaling and stress contributions in living cell, tissue, and whole-animal settings. FA-responsive fluorescence probes for use in microscopy assays can preserve spatial and temporal information that is lost in traditional analytical methods that involve biological sample destruction to measure FA levels.31–34 In this context, activity-based sensing probes with further improved spatial resolution, specifically those with organelle specificity, have shown promise in uncovering new modes of analyte regulation, as our laboratory has previously shown with molecular imaging of reactive oxygen species and transition metal signals.35,36 Given that the modes of FA production and scavenging are highly compartmentalized, the development of FA probes with organelle-level resolution is important in understanding its biological maintenance in subcellular detail. Mitochondria, in particular, are important to FA metabolism as they house several potential FA sources, including the serine cleavage enzyme serine hydroxymethyltransferase-2 (SHMT2)37 and a main mode of aldehyde clearance, ALDH2.38
Here we report the design, synthesis, and biological evaluation of Mitochondrial-targeted Ratiometric Formaldehyde Probes (MitoRFAPs) for ratiometric FA imaging (Scheme 1). These probes rely on our versatile 2-aza-Cope reactivity approach which enables selective detection of FA over other biologically relevant reactive carbon species, while other hydrazine-based mitochondrial aldehyde probes, that lack the rearrangement step, may interact with other aldehyde species.39,40RFAPs provide a ratiometric readout (λex = 488 nm product/λex = 405 nm reactant) that enables internal self-calibration to correct for potential fluctuations in dye loading, light intensity, and sample thickness between biological specimens.19 Working through a modular synthetic pathway that relies on a key intermediate, RFAP-Alkyne (4), we synthesized and tested two MitoRFAP derivatives that leverage a triphenylphosphonium headgroup popularized by Murphy for mitochondrial targeting,41–44 finding that tuning to the appropriate linker length is key to optimizing the live-cell permeability of the probe. We establish the benefits of subcellular targeting by showing that MitoRFAP-2 can identify a depletion in mitochondrial FA pools in response to genetic knockout of SHMT enzymes, while an analogous, non-targeted RFAP-2 derivative is not capable of detecting this change to the mitochondrial 1C pool. We also leveraged MitoRFAP-2 to observe enhanced FA clearance achieved upon pharmacological activation of cells carrying the common human mutant form of ALDH2 (ALDH2*2) to correct for their genetic deficiencies in ALDH2 activity. Finally, we used MitoRFAP-2 to profile basal mitochondrial FA pools across a panel of breast cancer cell lines, showing that FA-dependent fluorescent signals correlate with the expression of major FA-producing (SHMT2) and FA-scavenging (ALDH2) enzymes. Taken together, these experiments showcase the ability of MitoRFAP-2 as an enabling chemical tool to detect and decipher endogenous mitochondrial FA sources, scavengers, and signals. This work opens the door to further development and application of probes to study reactive carbon species in health and disease.
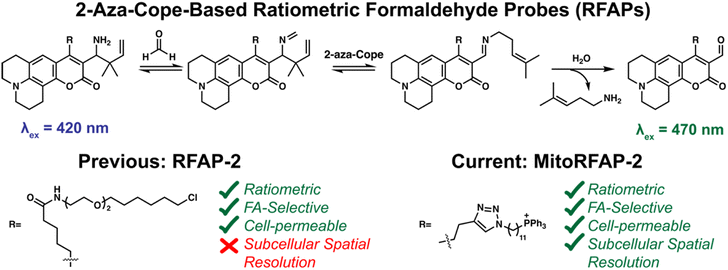 | ||
| Scheme 1 Chemical mechanism of the 2-aza-Cope trigger reaction for activity-based sensing of formaldehyde (FA). Previous and current derivatives of RFAP for imaging FA in living cells. | ||
Results and discussion
Design and synthesis of mitochondrial ratiometric formaldehyde probes (MitoRFAPs), mitochondrial-targeted activity-based sensing probes for formaldehyde (FA)
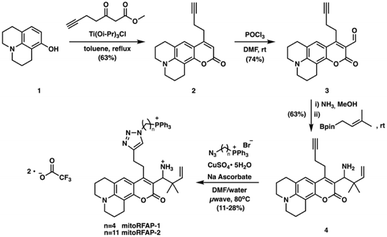
To probe mitochondrial formaldehyde pools in living cells, we designed bifunctional fluorophores comprised of two components: (i) a formaldehyde-sensitive, coumarin dye that responds to FA through a 2-aza-Cope reaction, and (ii) a lipophilic triphenylphosphonium (TPP) cation as a mitochondrial-targeting moiety.41–45 We utilized a modular synthetic route that relied on a key intermediate, RFAP-alkyne (4), which was ligated to TPP-azide conjugates with varying linker lengths.Scheme 2 depicts the synthetic route used to prepare the Mitochondrial Ratiometric Formaldehyde Probe (MitoRFAP) dyes described in this manuscript. First, compound 1 was acylated via a titanium-catalyzed Friedel–Crafts reaction to yield the alkyne-functionalized coumarin 2 in 63% yield, in accordance with a published procedure.46 Dye 2 was then formylated, using the Vilsmeier–Haack formylation, to isolate the corresponding coumarin aldehyde 3 in 74% yield.47 Aldehyde 3 was then transformed by amino-prenylation by treatment with ammonia followed by 3-methyl-2-butenylboronic acid pinacol ester to achieve the modular RFAP-alkyne synthon 4. RFAP alkyne 4 was then ligated to the azide-TPP targeting agent via copper-catalyzed click chemistry. MitoRFAP-1 was designed with 4 methylene units between TPP and RFAP moieties. A previous observation by the Murphy and Hartley laboratories showing that certain molecular cargo-TPP conjugates require long, lipophilic linkers to permeate mitochondria48 led us to design the 11-methylene linked probe, MitoRFAP-2.
Assessment of formaldehyde sensitivity and selectivity of MitoRFAP dyes in vitro
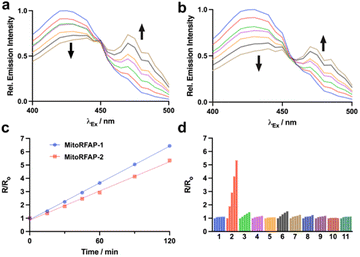
Both MitoRFAP-1 and MitoRFAP-2 show the expected ratiometric fluorescence response to treatment with FA after incubation in aqueous media. The response is robust, with MitoRFAP-2 showing an approximately 5.5-fold change in excitation fluorescence ratios to FA within 2 hours as measured at λem = 510 nm with λex = 470 nm for product and λex = 420 nm for reactant (Fig. 1a–c). This observed change in ratio is based on the FA-dependent, aza-Cope-driven conversion of an electron-donating homoallylamine group into an electron-withdrawing aldehyde, which leads to a red shift in the dye excitation profile by increasing favorability of internal charge transfer in this push–pull coumarin chromophore. Similar to our original non-targeted RFAP derivatives,19 these activity-based sensing probes act through the 2-aza-Cope trigger and are, as expected, highly selective for formaldehyde over other biologically relevant aldehydes, including acetaldehyde and methylglyoxal at pH 7.4 and pH 7.8 (Fig. 1d and S1†).49,50 Importantly, no reactivity was observed with H2O2, a reactive oxygen species with importance in mitochondrial signaling,51 or glutathione, a biological reducing agent present at millimolar levels throughout the cell.52Comparing MitoRFAP-1 and MitoRFAP-2 cell permeability, localization, and formaldehyde sensitivity in live-cell imaging assays with exogenous FA addition
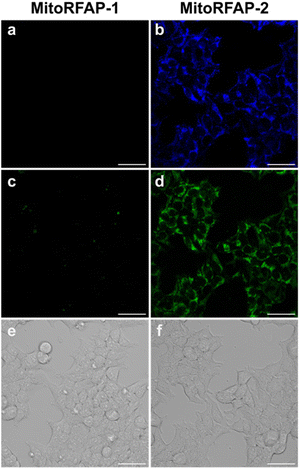
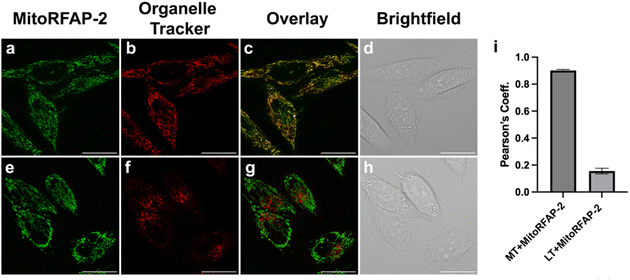
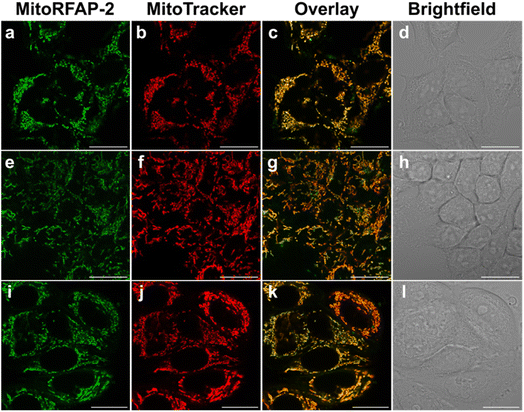
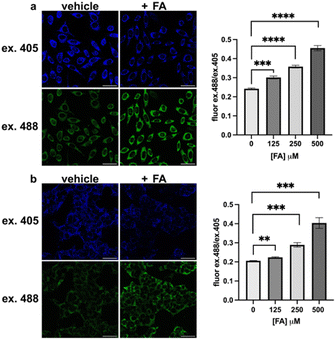
With these spectroscopic data in hand, we then applied MitoRFAP-1 and MitoRFAP-2 in live-cell confocal imaging experiments to determine cellular membrane permeability and subcellular localization of the probes. As a starting point, HEK 293T cells stained with equimolar concentrations of both derivatives show a stark contrast in fluorescence intensity, with MitoRFAP-2 providing a strong fluorescence signal, and MitoRFAP-1 showing essentially no signal under the same conditions (Fig. 2). Moreover, MitoRFAP-2 was found to have no significant cytotoxicity at concentrations used for subsequent experiments (Fig. S2 and S3†). Given the superior live-cell staining capabilities and low toxicity of MitoRFAP-2 bearing the longer C11 linker relative to the MitoRFAP-1 analog with a shorter C4 linker, we conducted all subsequent live-cell imaging experiments with this probe. Gratifyingly, MitoRFAP-2 demonstrated strong co-localization with established mitochondrial dye, MitoTracker™ Deep Red, with a Pearson correlation coefficient near 1 (mean value of 0.901), in HeLa cells (Fig. 3a–d and i). In this context, a Pearson correlation coefficient of 1 would reflect perfect overlap of signals, a value of zero would indicate no correlation between signals, while a value of −1 would represent a perfect inverse relationship (e.g., where one signal is present, the other is never present). The overlap between MitoRFAP-2 and LysoTracker™ Deep Red, an off-target stain for the lysosome organelle, was also analyzed and showed a much lower Pearson's correlation coefficient, with a mean value of only 0.155 (Fig. 3e–i). The fluorescence profile of single HeLa cells was also analyzed, which showed a strong correlation of signal from MitoRFAP-2 and MitoTracker (Fig. S4†).We then applied MitoRFAP-2 to a broader range of cell lines with co-staining using organelle markers. In each cell line, Mito-RFAP-2 showed faithful mitochondrial localization, suggesting that this probe can be used in live-cell mitochondrial FA imaging applications derived from a range of tissue types (Fig. 4 and S5†). To ensure that MitoRFAP-2 is sensitive to changes in mitochondrial FA levels in a live-cell context, we loaded the probe in HEK 293T and HeLa cells with subsequent exogenous additions of small amounts of FA. Additions of exogenous FA resulted in a dose-dependent increase in the λex = 488 nm (product)/λex = 405 nm (reactant) ratio of the MitoRFAP-2 reagent (Fig. 5).
Imaging endogenous formaldehyde fluxes in a colorectal carcinoma cell model lacking serine hydroxymethyltransferases (SHMTs) and alcohol dehydrogenase 5 (ADH5)
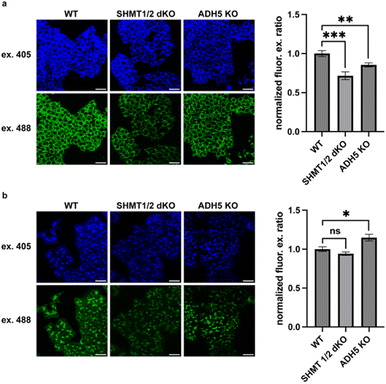
We next applied MitoRFAP-2 to study the impact of modulating the activity of mitochondrial enzymes specifically involved in the localized production and scavenging of formaldehyde within this subcellular space. In this context, serine hydroxymethyltransferases 1 and 2 (SHMT 1 and 2) are responsible for enzymatic conversion between serine and glycine, reversibly catalyzing the transfer of a hydroxymethyl group from serine to tetrahydrofolate (THF). The resulting folate derivative from SHMT activity, 5,10-methylene-THF, is a functional 1C unit in cellular metabolism.53,54 Interestingly, we have found that 5,10-methylene-THF also spontaneously decomposes to produce approximately two equivalents of formaldehyde in vitro, providing another source of 1C units that can also feed into 1C metabolic cycles via formate production.8 We sought to test the hypothesis that SHMT1/2 double knockout (dKO) cells would have depleted mitochondrial FA pools relative to wild-type (WT) cells, using an HCT-116 colon cancer cell line model. We also included an HCT-116 ADH5 KO model, as ADH5 is the main enzyme responsible for cytosolic clearance of FA, to determine whether perturbations to the cytosolic FA pool would have any crosstalk with the mitochondrial FA pool. Finally, as a key set of control experiments to assess whether MitoRFAP-2 could provide unique information on subcellular FA pools owing to its mitochondrial targetability, we also compared the fluorescent responses of a previously reported non-targeted parent FA sensor, RFAP-2,19 in these models under the same conditions. Indeed, the control probe RFAP-2, which does not possess the ability to selectively localize in mitochondria, is unable to detect changes in FA with subcellular resolution. The ability of the triphenylphosphonium targeting moiety to achieve rapid, selective, and efficient mitochondrial localization48,55 of MitoRFAP-2 compared to the relatively slower rate of aza-Cope FA reactivity, coupled with a ratiometric response with an internal calibration standard to normalize signal, ensures that this probe is responsive to FA fluxes with superior subcellular resolution compared to the non-targeted control.To our delight, imaging with MitoRFAP-2 in the SHMT1/2 dKO cell model showed a robust decrease in the mitochondrial FA pool relative to wild-type congeners (Fig. 6a), identifying that enzymatic serine cleavage is indeed an endogenous source of FA in mitochondria. Interestingly, MitoRFAP-2 imaging in the ADH5 KO cell line also showed depletion of mitochondrial FA relative to WT. This result is more difficult to interpret, but it suggests that mitochondria could be involved in responding to elevations in cytosolic FA fluxes by reciprocally lowering mitochondrial FA pools. Most importantly, the untargeted parent RFAP-2 probe showed no significant differences in ratiometric fluorescence signals between WT and SHMT1/2 dKO cells (Fig. 6b), but still robustly reported the expected increase in FA levels in ADH5 KO cells vs. WT cells.19,20 Taken together, these data establish that appending an organelle-targeting group can enhance spatial resolution for subcellular FA imaging, in this case to the mitochondria. Indeed, the targetable MitoRFAP-2 probe can report on mitochondrial-localized changes in FA fluxes induced by genetic manipulation of FA-producing and FA-scavenging enzymes that the non-targeted RFAP-2 derivative cannot.
MitoRFAP-2 monitors depletion of mitochondrial formaldehyde pools through pharmacological activation and rescue of deficient alcohol dehydrogenase 2 activity in cells with the inherited ALDH2 E487K human mutation
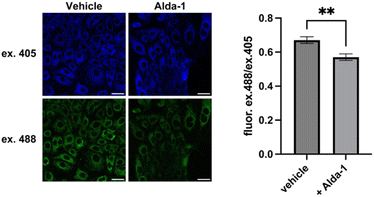
Next, we applied MitoRFAP-2 to measure endogenous changes in mitochondrial FA pools in the SNU-182 hepatocellular carcinoma cell line expressing a very common human mutation in the mitochondrial ALDH2 enzyme, termed ALDH2*2. Individuals who express ALDH2*2 possess a single nucleotide polymorphism that results in an inactive E487K point mutant enzyme, in a homozygous or heterozygous manner.56 This population has a greatly reduced ability to metabolize acetaldehyde, the initial product of ethanol metabolism, as well as other endogenously produced aldehydes, including formaldehyde.57 This pervasive human mutation is associated with a flushing effect upon consumption of alcohol, a phenotypic signature of acetaldehyde build-up,58 and is connected to the development of cancer,59,60 cardiovascular disease,61 and neurodegenerative diseases.62Using MitoRFAP-2 imaging, we probed whether a chronic, aberrantly-elevated aldehyde state could be modulated via pharmacological treatment with a small-molecule ALDH2 activator, Alda-1; this compound restores activity of the ALDH2*2 mutant enzyme to near wide-type activity.63 Indeed, we observed that SNU-182 cells, which express the ALDH2*2 E487K mutant enzyme, treated with Alda-1 for 24 h show a reduction in excess mitochondrial FA load relative to vehicle-treated cells (Fig. 7). Interestingly, we also found that the basal FA pool was also lowered in HeLa cells by treatment with Alda-1, which establishes that MitoRFAP-2 is sensitive enough to detect endogenous pools of mitochondrial FA in live cells and indicates that ALDH2 activation can be observed when treating cells possessing wild-type ALDH2 with Alda-1 (Fig. S7†).63
MitoRFAP-2 provides profile of basal levels of mitochondrial formaldehyde across a panel of breast cancer cell lines and shows correlations with biochemical FA sources and scavengers
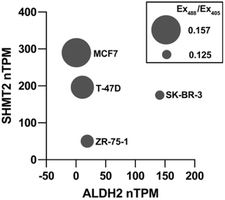
With data showing that MitoRFAP-2 can detect basal levels of mitochondrial FA and changes upon genetic and pharmacological alterations in mitochondrial FA sources and scavengers, we profiled basal mitochondrial FA levels across a panel of breast cancer cell lines with varying levels of expression of SHMT2 and ALDH2, two key regulators of formaldehyde metabolism in the mitochondria. We showcased the use of MitoRFAP-2 in this assay using flow cytometry, establishing that the probe can be used beyond microscopy applications. Cells were stained with MitoRFAP-2, suspended, and then analyzed. The results show that high levels of SHMT2 expression and low levels of ALDH2 expression, identified by RNA transcripts per million,64 correlate with an elevated mitochondrial FA pool as measured by MitoRFAP-2 fluorescence (Fig. 8 and S8†). In particular, MCF7 cells have the lowest reported ALDH2 transcript levels in the panel tested and are shown here to have the highest levels of mitochondrial FA. Notably, this result aligns well with previous observations that MCF7 cells have elevated FA levels compared to several other cancer cell lines.34 Moreover, cells expressing higher levels of ALDH2 RNA, such as SK-BR-3, show lower levels of basal mitochondrial FA. These collective results suggest that a combination of high SHMT2 and low ALDH2 expression, read out in the form of elevated mitochondrial FA levels, could represent a biological signature that signals a 1C metabolic imbalance leading to elevated levels of genotoxic FA in cancer cells.Conclusions
To close, we have developed an organelle-targetable, activity-based sensing platform, exemplified by MitoRFAP-2, for selective detection of mitochondrial FA pools using live-cell imaging microscopy or flow cytometry assays. The synthesis of MitoRFAP-1 and MitoRFAP-2 relied on a key intermediate 4, RFAP-alkyne, which can be used in a modular fashion to ligate various chemical organelle-targeting agents. Both probes rely on a lipophilic triphenylphosphonium (TPP) cation for mitochondrial localization, but likely owing to its longer, hydrophobic linker, only MitoRFAP-2 appears to be permeable across live-cell membranes. MitoRFAP-2 shows high selectivity for FA over other biologically relevant competing reactive carbon species in the cell, including closely related aldehydic analytes like acetaldehyde and methylglyoxal, and is sufficiently sensitive to not only demonstrate dose-dependent response to exogenous additions of FA, but to detect basal, endogenous levels of mitochondrial FA and respond to changes in this pool by genetic or pharmacological manipulation. For example, in an HCT-116 colorectal carcinoma cell line model, MitoRFAP-2 was able to decipher the contributions of serine hydroxymethyltransferase enzymes (SHMTs) as 1C sources feeding into the mitochondrial FA pool. Indeed, because upregulation of mitochondrially-localized SHMT2 is correlated with poor prognosis of cancer, with data showing that it drives cell proliferation in several cancer types,65,66 our findings connect this association with potentially aberrant elevations in mitochondrial FA. Importantly, the impact of genetic knockout of SHMT on mitochondrial FA pools that is identified by MitoRFAP-2, which cannot be detected by the untargeted parent probe RFAP-2, showcases the benefits of subcellular targeting of chemical imaging probes to increase their sensitivity and spatial resolution. Our data suggest that uniquely regulated, local fluxes of FA exist within subcellular compartments and presage that dynamic FA gradients may exist between various organelles within the cell.In another example to showcase its utility, MitoRFAP-2 is capable of monitoring rescue of elevated mitochondrial FA pools in the inherited human E487K mutation in ALDH2 (ALDH2*2), where Alda-1 treatment of SNU-182 cells expressing ALDH2*2 can reduce basal levels of mitochondrial FA. ALDH2 is responsible for the clearance of several toxic, endogenously produced aldehydes, including acetaldehyde, a product of the metabolism of consumed and internally generated ethanol. Alda-1 activates ALDH2*2 activity towards smaller substrates, like acetaldehyde and propionaldehyde,63 and this present study suggests that clearance of excess formaldehyde could be a benefit of Alda-1 treatment. This situation is particularly important given our recent findings that FA is a 1C epigenetic regulator by modulating cellular levels of the major 1C methyl carrier SAM. Finally, we used MitoRFAP-2 to comparatively profile basal levels of mitochondrial FA across a panel of breast cancer cell lines using flow cytometry. Increases in endogenous mitochondrial FA pools detected by MitoRFAP-2 correlate with high expression levels of the mitochondrial FA-generating enzyme SHMT2 and low expression levels of the mitochondrial FA-scavenging enzyme ALDH2. Given that FA is a carcinogen and genotoxin, an emerging signal that regulates epigenetics and 1C metabolic cycles, and acts as a 1C stock, these data provide a starting point for the use of this reagent to decipher complex contributions of mitochondrial FA to cancer, metabolism and a range of other diseases, and underscore the broader importance of developing chemical tools with improved spatial resolution to unveil new biology.
Data availability
Additional synthetic, analytical, and biological data are available in the ESI of this article.†Author contributions
C. J. C. conceived and directed the project. L. T., T. F. B., and C. J. C. designed the probes. L. T. and V. N. P. designed cell imaging assays. L. T. synthesized, purified, and characterized the compounds and performed spectroscopic and cell imaging assays. L. T. and C. J. C. wrote and edited the manuscript. All authors provided critical feedback and have approved the final version of the manuscript.Conflicts of interest
The authors declare no competing financial interest.Acknowledgements
We thank the NIH (ES 28096 and GM 139245 to C. J. C.) for support of this work. V. N. P. was supported by the National Science Foundation for Graduate Research Fellowship and NIH Chemical Biology Interface Training Grant T32 GM066698. C. J. C. is a CIFAR Fellow. Instruments in the CoC-NMR facility are supportedin part by NIH S10OD024998. We thank Alison Killilea (UC Berkeley Tissue Culture Facility) for expert technical assistance and Hasan Celik, Alicia Lund, and UC Berkeley's NMR facility in the College of Chemistry (CoC-NMR) for spectroscopic assistance. We thank Profs. Joshua Rabinowitz (Princeton University) and K. J. Patel (Oxford University) for sharing the HCT-116 wild-type, ADH5 knockout, and SHMT1/SHMT2 double knockout cell lines. We thank Prof. Daria Mochly-Rosen and their lab for conversations focused on the ALDH2*2 cell model systems. We thank Prof. Alanna Schepartz for use of their laboratory's flow cytometer and Prof. Dean Toste for use of their laboratory's LC/MS TOF instrument.Notes and references
- X. Tang, Y. Bai, A. Duong, M. T. Smith, L. Li and L. Zhang, Environ. Int., 2009, 35, 1210–1224 CrossRef CAS PubMed.
- O US EPA, Facts About Formaldehyde, https://www.epa.gov/formaldehyde/facts-about-formaldehyde, (accessed October 18, 2023) Search PubMed.
- R. Baan, Y. Grosse, K. Straif, B. Secretan, F. E. Ghissassi, V. Bouvard, L. Benbrahim-Tallaa, N. Guha, C. Freeman, L. Galichet and V. Cogliano, Lancet Oncol., 2009, 10, 1143–1144 CrossRef PubMed.
- Z. Tong, C. Han, W. Luo, X. Wang, H. Li, H. Luo, J. Zhou, J. Qi and R. He, AGE, 2013, 35, 583–596 CrossRef PubMed.
- Y. Zhang, Y. Yang, X. He, P. Yang, T. Zong, P. Sun, R. Sun, T. Yu and Z. Jiang, J. Cell. Mol. Med., 2021, 25, 5358–5371 CrossRef CAS PubMed.
- D. Leys, J. Basran and N. S. Scrutton, EMBO J., 2003, 22, 4038–4048 CrossRef CAS PubMed.
- Y. Xu, H. Meng, J. Ren and A.-P. Zeng, J. Biol. Eng., 2020, 14, 15 CrossRef CAS.
- G. Burgos-Barragan, N. Wit, J. Meiser, F. A. Dingler, M. Pietzke, L. Mulderrig, L. B. Pontel, I. V. Rosado, T. F. Brewer, R. L. Cordell, P. S. Monks, C. J. Chang, A. Vazquez and K. J. Patel, Nature, 2017, 548, 549–554 CrossRef CAS PubMed.
- J. D. W. Toh, S. W. M. Crossley, K. J. Bruemmer, E. J. Ge, D. He, D. A. Iovan and C. J. Chang, Proc. Natl. Acad. Sci. U. S. A., 2020, 117, 25284–25292 CrossRef CAS PubMed.
- Y. Shi and J. R. Whetstine, Mol. Cell, 2007, 25, 1–14 CrossRef CAS PubMed.
- R. J. Hopkinson and C. J. Schofield, Biochemistry, 2018, 57, 904–906 CrossRef CAS.
- B. Jackson, C. Brocker, D. C. Thompson, W. Black, K. Vasiliou, D. W. Nebert and V. Vasiliou, Hum. Genomics, 2011, 5, 283 CrossRef CAS PubMed.
- J.-M. Guo, A.-J. Liu, P. Zang, W.-Z. Dong, L. Ying, W. Wang, P. Xu, X.-R. Song, J. Cai, S.-Q. Zhang, J.-L. Duan, J. L. Mehta and D.-F. Su, Cell Res., 2013, 23, 915–930 CrossRef CAS PubMed.
- Y. Matsumura, K. M. Stiles, J. Reid, E. Z. Frenk, S. Cronin, O. E. Pagovich and R. G. Crystal, Mol. Ther.–Methods Clin. Dev., 2019, 15, 72–82 CrossRef CAS PubMed.
- F. A. Dingler, M. Wang, A. Mu, C. L. Millington, N. Oberbeck, S. Watcham, L. B. Pontel, A. N. Kamimae-Lanning, F. Langevin, C. Nadler, R. L. Cordell, P. S. Monks, R. Yu, N. K. Wilson, A. Hira, K. Yoshida, M. Mori, Y. Okamoto, Y. Okuno, H. Muramatsu, Y. Shiraishi, M. Kobayashi, T. Moriguchi, T. Osumi, M. Kato, S. Miyano, E. Ito, S. Kojima, H. Yabe, M. Yabe, K. Matsuo, S. Ogawa, B. Göttgens, M. R. G. Hodskinson, M. Takata and K. J. Patel, Mol. Cell, 2020, 80, 996–1012.e9 CrossRef CAS PubMed.
- V. N. Pham, K. J. Bruemmer, J. D. W. Toh, E. J. Ge, L. Tenney, C. C. Ward, F. A. Dingler, C. L. Millington, C. A. Garcia-Prieto, M. C. Pulos-Holmes, N. T. Ingolia, L. B. Pontel, M. Esteller, K. J. Patel, D. K. Nomura and C. J. Chang, Science, 2023, 382, eabp9201 CrossRef CAS PubMed.
- T. F. Brewer and C. J. Chang, J. Am. Chem. Soc., 2015, 137, 10886–10889 CrossRef CAS PubMed.
- W. Liu, C. Truillet, R. R. Flavell, T. F. Brewer, M. J. Evans, D. M. Wilson and C. J. Chang, Chem. Sci., 2016, 7, 5503–5507 RSC.
- T. F. Brewer, G. Burgos-Barragan, N. Wit, K. J. Patel and C. J. Chang, Chem. Sci., 2017, 8, 4073–4081 RSC.
- K. J. Bruemmer, R. R. Walvoord, T. F. Brewer, G. Burgos-Barragan, N. Wit, L. B. Pontel, K. J. Patel and C. J. Chang, J. Am. Chem. Soc., 2017, 139, 5338–5350 CrossRef CAS PubMed.
- K. J. Bruemmer, O. Green, T. A. Su, D. Shabat and C. J. Chang, Angew. Chem., Int. Ed., 2018, 57, 7508–7512 CrossRef CAS PubMed.
- J. Ohata, K. J. Bruemmer and C. J. Chang, Acc. Chem. Res., 2019, 52, 2841–2848 CrossRef CAS PubMed.
- A. Roth, H. Li, C. Anorma and J. Chan, J. Am. Chem. Soc., 2015, 137, 10890–10893 CrossRef CAS PubMed.
- L. He, X. Yang, Y. Liu, X. Kong and W. Lin, Chem. Commun., 2016, 52, 4029–4032 RSC.
- Y. Du, Y. Zhang, M. Huang, S. Wang, J. Wang, K. Liao, X. Wu, Q. Zhou, X. Zhang, Y.-D. Wu and T. Peng, Chem. Sci., 2021, 12, 13857–13869 RSC.
- Y. Tang, X. Kong, A. Xu, B. Dong and W. Lin, Angew. Chem., Int. Ed., 2016, 55, 3356–3359 CrossRef CAS PubMed.
- Y. H. Lee, Y. Tang, P. Verwilst, W. Lin and J. S. Kim, Chem. Commun., 2016, 52, 11247–11250 RSC.
- K. J. Bruemmer, S. W. M. Crossley and C. J. Chang, Angew. Chem., Int. Ed., 2020, 59, 13734–13762 CrossRef CAS PubMed.
- K. J. Bruemmer, T. F. Brewer and C. J. Chang, Curr. Opin. Chem. Biol., 2017, 39, 17–23 CrossRef CAS PubMed.
- J. Chan, S. C. Dodani and C. J. Chang, Nat. Chem., 2012, 4, 973–984 CrossRef CAS PubMed.
- T. Szarvas, E. Szatlóczky, J. Volford, L. Trézl, E. Tyihák and I. Rusznák, J. Radioanal. Nucl. Chem., 1986, 106, 357–367 CrossRef CAS.
- S. E. Ebeler, A. J. Clifford and T. Shibamoto, J. Chromatogr. B: Biomed. Sci. Appl., 1997, 702, 211–215 CrossRef CAS PubMed.
- P. Španěl, D. Smith, T. A. Holland, W. A. Singary and J. B. Elder, Rapid Commun. Mass Spectrom., 1999, 13, 1354–1359 CrossRef.
- S. Kato, P. J. Burke, T. H. Koch and V. M. Bierbaum, Anal. Chem., 2001, 73, 2992–2997 CrossRef CAS PubMed.
- B. C. Dickinson, D. Srikun and C. J. Chang, Curr. Opin. Chem. Biol., 2010, 14, 50–56 CrossRef CAS PubMed.
- S. C. Dodani, S. C. Leary, P. A. Cobine, D. R. Winge and C. J. Chang, J. Am. Chem. Soc., 2011, 133, 8606–8616 CrossRef CAS.
- Y. Zeng, J. Zhang, M. Xu, F. Chen, R. Zi, J. Yue, Y. Zhang, N. Chen and Y. E. Chin, J. Cancer, 2021, 12, 5888–5894 CrossRef CAS PubMed.
- A. A. Klyosov, Biochemistry, 1996, 35, 4457–4467 CrossRef CAS PubMed.
- F. Xin, Y. Tian, C. Gao, B. Guo, Y. Wu, J. Zhao, J. Jing and X. Zhang, Analyst, 2019, 144, 2297–2303 RSC.
- A. Xu, Y. Tang and W. Lin, New J. Chem., 2018, 42, 8325–8329 RSC.
- M. P. Murphy and R. A. J. Smith, Annu. Rev. Pharmacol. Toxicol., 2007, 47, 629–656 CrossRef CAS.
- R. A. J. Smith, C. M. Porteous, A. M. Gane and M. P. Murphy, Proc. Natl. Acad. Sci. U. S. A., 2003, 100, 5407–5412 CrossRef CAS PubMed.
- M. P. Murphy and R. C. Hartley, Nat. Rev. Drug Discovery, 2018, 17, 865–886 CrossRef CAS PubMed.
- R. A. J. Smith, R. C. Hartley, H. M. Cochemé and M. P. Murphy, Trends Pharmacol. Sci., 2012, 33, 341–352 CrossRef CAS PubMed.
- J. Zielonka, J. Joseph, A. Sikora, M. Hardy, O. Ouari, J. Vasquez-Vivar, G. Cheng, M. Lopez and B. Kalyanaraman, Chem. Rev., 2017, 117, 10043–10120 CrossRef CAS PubMed.
- L. Wirtz, D. Auerbach, G. Jung and U. Kazmaier, Synthesis, 2012, 44, 2005–2012 CrossRef CAS.
- M. W. Beck, R. S. Kathayat, C. M. Cham, E. B. Chang and B. C. Dickinson, Chem. Sci., 2017, 8, 7588–7592 RSC.
- H. A. Prag, D. Kula-Alwar, L. Pala, S. T. Caldwell, T. E. Beach, A. M. James, K. Saeb-Parsy, T. Krieg, R. C. Hartley and M. P. Murphy, Mol. Pharmaceutics, 2020, 17, 3526–3540 CrossRef CAS PubMed.
- H. K. Seitz and F. Stickel, Genes Nutr., 2010, 5, 121–128 CrossRef CAS PubMed.
- M. P. Kalapos, Toxicol. Lett., 1999, 110, 145–175 CrossRef CAS PubMed.
- Y. Ohsaki, P. O'Connor, T. Mori, R. P. Ryan, B. C. Dickinson, C. J. Chang, Y. Lu, S. Ito and A. W. Cowley, Am. J. Physiol.: Renal Physiol., 2012, 302, F95–F102 CrossRef CAS PubMed.
- H. J. Forman, H. Zhang and A. Rinna, Mol. Aspects Med., 2009, 30, 1–12 CrossRef CAS PubMed.
- A. E. Morellato, C. Umansky and L. B. Pontel, Redox Biol., 2021, 40, 101850 CrossRef CAS PubMed.
- G. S. Ducker and J. D. Rabinowitz, Cell Metab., 2017, 25, 27–42 CrossRef CAS PubMed.
- M. F. Ross, G. F. Kelso, F. H. Blaikie, A. M. James, H. M. Cochemé, A. Filipovska, T. Da Ros, T. R. Hurd, R. A. J. Smith and M. P. Murphy, Biochemistry, 2005, 70, 222–230 CAS.
- C.-H. Chen, B. R. Kraemer and D. Mochly-Rosen, Dis. Models Mech., 2022, 15, dmm049601 CrossRef PubMed.
- C.-H. Chen, J. C. B. Ferreira, E. R. Gross and D. Mochly-Rosen, Physiol. Rev., 2014, 94, 1–34 CrossRef CAS PubMed.
- M. Y. Eng, S. E. Luczak and T. L. Wall, Alcohol Res. Health, 2007, 30, 22–27 Search PubMed.
- Q. Wang, B. Chang, X. Li and Z. Zou, J. Clin. Transl. Hepatol., 2021, 9, 90–98 Search PubMed.
- J. S. Chang, J.-R. Hsiao and C.-H. Chen, J. Biomed. Sci., 2017, 24, 19 CrossRef PubMed.
- C.-H. Chen, J. C. B. Ferreira and D. Mochly-Rosen, in Aldehyde Dehydrogenases: From Alcohol Metabolism to Human Health and Precision Medicine, ed. J. Ren, Y. Zhang and J. Ge, Springer, Singapore, 2019, pp. 53–67 Search PubMed.
- Y. Zhao and C. Wang, BioMed Res. Int., 2015, 2015, e174050 Search PubMed.
- S. Perez-Miller, H. Younus, R. Vanam, C.-H. Chen, D. Mochly-Rosen and T. D. Hurley, Nat. Struct. Mol. Biol., 2010, 17, 159–164 CrossRef CAS PubMed.
- The Human Protein Atlas, https://www.proteinatlas.org/, (accessed January 17, 2024) Search PubMed.
- Z. Liu, M. Fan, J. Hou, S. Pan, Y. Xu, H. Zhang, C. Liu, X. Hao, X. Li and H. Wang, Cell Death Dis., 2023, 14, 1–11 CrossRef CAS PubMed.
- G. Y. Lee, P. M. Haverty, L. Li, N. M. Kljavin, R. Bourgon, J. Lee, H. Stern, Z. Modrusan, S. Seshagiri, Z. Zhang, D. Davis, D. Stokoe, J. Settleman, F. J. de Sauvage and R. M. Neve, Cancer Res., 2014, 74, 3114–3126 CrossRef CAS PubMed.
Footnote |
| † Electronic supplementary information (ESI) available. See DOI: https://doi.org/10.1039/d4sc01183j |
| This journal is © The Royal Society of Chemistry 2024 |

