 Open Access Article
A zinc metal complex as an NIR emissive probe for real-time dynamics and in vivo embryogenic evolution of lysosomes using super-resolution microscopy†
Abdul
Salam‡
 a,
Kush
Kaushik‡
 a,
Bodhidipra
Mukherjee‡
 b,
Farhan
Anjum
 b,
Goraksha T.
Sapkal
 a,
Shagun
Sharma
 a,
Richa
Garg
 a and
Chayan Kanti
Nandi
 *ab
*ab
aSchool of Chemical Sciences, Indian Institute of Technology Mandi, HP-175075, India. E-mail: chayan@iitmandi.ac.in
bSchool of Biosciences and Bioengineering, Indian Institute of Technology Mandi, HP-175075, India
First published on 5th September 2024
Abstract
Zinc (Zn) based fluorescent metal complexes have gained increasing attention due to their non-toxicity and high brightness with marked fluorescence quantum yield (QY). However, they have rarely been employed in super-resolution microscopy (SRM) to study live cells and in vivo dynamics of lysosomes. Here, we present an NIR emissive highly photostable Zn-complex as a multifaceted fluorescent probe for the long-term dynamical distribution of lysosomes in various cancerous and non-cancerous cells in live condition and in vivo embryogenic evolution in Caenorhabditis elegans (C. elegans). Apart from the normal fission, fusion, and kiss & run, the motility and the exact location of lysosomes at each point were mapped precisely. A notable difference in the lysosomal motility in the peripheral region between cancerous and non-cancerous cells was distinctly observed. This is attributed to the difference in viscosity of the cytoplasmic environment. On the other hand, along with the super-resolved structure of the smallest size lysosome (∼77 nm) in live C. elegans, the complete in vivo embryogenic evolution of lysosomes and lysosome-related organelles (LROs) was captured. We were able to capture the images of lysosomes and LROs at different stages of C. elegans, starting from a single cell and extending to a fully matured adult animal.
Introduction
In recent decades, transition metal complexes (Ru, Ir, Os, Re) have shown potential as photoluminescent probes for SRM imaging.1–8 It is a very powerful technique that can capture real-time dynamics of biological events in living conditions by breaking the diffraction limit of conventional fluorescence microscopy. SRM also provides very high-resolution images and videos down to the nanometre level very precisely.9,10 Much less attention has been paid to Zn-complexes, although they are earth-abundant, highly biocompatible, less cytotoxic, and have high brightness with substantially high QY.11–13 Recently, only a few studies have been reported on the use of Zn-complexes in SRM imaging.14,15 However, they have not been employed for lysosomal dynamics, their cellular distribution, and in vivo embryogenic evolution.Lysosomes are tiny particles16 that handle waste disposal for the cell by digesting obsolete materials and play a very significant role in cellular homeostasis.17,18 The motility and location of lysosomes inside the cellular environment play an essential role in their activity during phagocytosis and autophagy.19 Depending on their location and the regular mixing of different subsets of lysosomes at distinct locations, they maintain homeostasis of the entire cell.20 However, the relationship between the location and dynamic nature of lysosomes,21 and how fast or slow they move inside the cells at two distinct locations for their functionality, especially in cancerous or non-cancerous cells, is not understood properly. Evidence suggests that cancer cells depend on lysosomal volume and subcellular localization during oncogenic transformation.22,23 Lysosomes are also found to be upregulated and mislocalized in cancer.23 It has recently been shown that depending on their subcellular localization, they can promote invasion, angiogenesis, and metastasis when localized extracellularly.24 In addition, when they are located intracellularly, they can trigger apoptosis by leaking into the cytosol.24 As a result, long-term lysosomal distribution and their mapping by directly tracking their precise location may play a significant role in improving therapeutics.
Here, we present a morpholine-conjugated Zn(II) metal complex as an efficient fluorescent probe for super-resolution radial fluctuation (SRRF) microscopy25,26 of lysosomal motility and precise positions in various cancerous and non-cancerous cells. The non-toxic, high brightness, and NIR emissive nature of the Zn-complex minimizes cell damage and provides a better signal-to-noise ratio. The Zn-complex is very effective in providing direct visualization of the live fission, fusion, and kiss & run processes of lysosomes in real-time that are regularly happening inside the cellular environment. The Zn-complex is utilized for real-time tracking of lysosomal dynamics, including distance and speed across both peripheral and perinuclear regions within the cellular domains in both cancerous and non-cancerous cells. The obtained result suggests that peripheral lysosomes travel longer distances at higher speeds than perinuclear lysosomes because of the diverse functioning of lysosomes at distinct locations. Perinuclear lysosomes maintain a highly acidic environment for the degradation of cellular cargos, while peripheral lysosomes, involved in cellular transportation and communication, have a low acidic environment.21,27 Interestingly, the peripheral lysosomes in cancerous cells travel farther at higher speed compared to the peripheral lysosomes of non-cancerous cells. This difference in the motility of the lysosomes arises due to the lower viscosity of the cytoplasmic domain of cancerous cells.28–30
LROs, which are mainly present in the intestinal cells of C. elegans, were found to play a significant role in Zn storage and promote detoxification and subsequent mobilization, linking cellular and organismal Zn metabolism.31 Within a developing embryo, lysosomes are involved in the destruction of transient organs or misplaced cells and help in the removal of certain nonessential organelles, thereby streamlining its growth.32 In addition, it has also been reported that the intestine of C. elegans mediates high Zn homeostasis and controls the level of Zn by regulating excretion of the excess Zn from the basolateral surface of intestinal cells.33 The present fluorescent Zn-complex was used to understand these phenomena by directly visualizing them inside C. elegans. We have tracked the lysosomal embryonic evolution by capturing time-lapse images at one-minute time intervals for 16 hours. We examined the in vivo dynamics of lysosomes and LROs in C. elegans, starting from a single cell and extending to a fully matured C. elegans. During the initial stages of embryogenesis, the lysosomal movement seems to be very fast, with many fusion/fission events that give rise to unstable LROs. They finally reach a stable structure at around 5–7 hours during their comma stage which lasts up to the elongation and quickening stages. It was further noticed that at the initial stage, lysosomes and LROs were scattered throughout the cells, but at a later stage, they were mainly accumulated in the intestine. The Zn-complex was released from the body of the organism through the intestine at the time of hatching.
Results and discussion
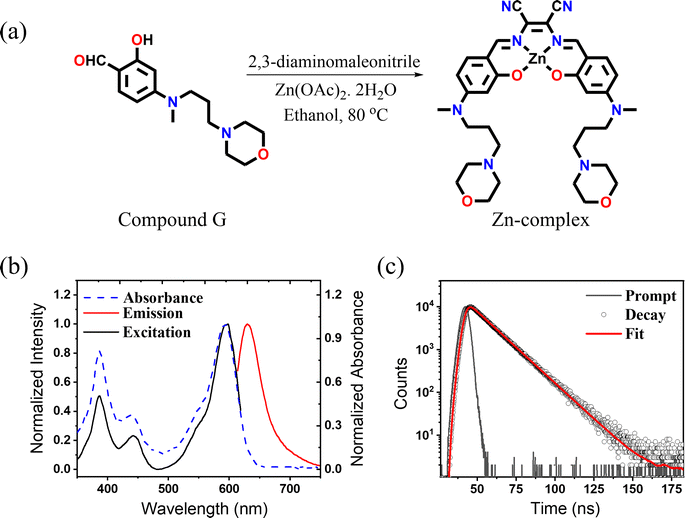
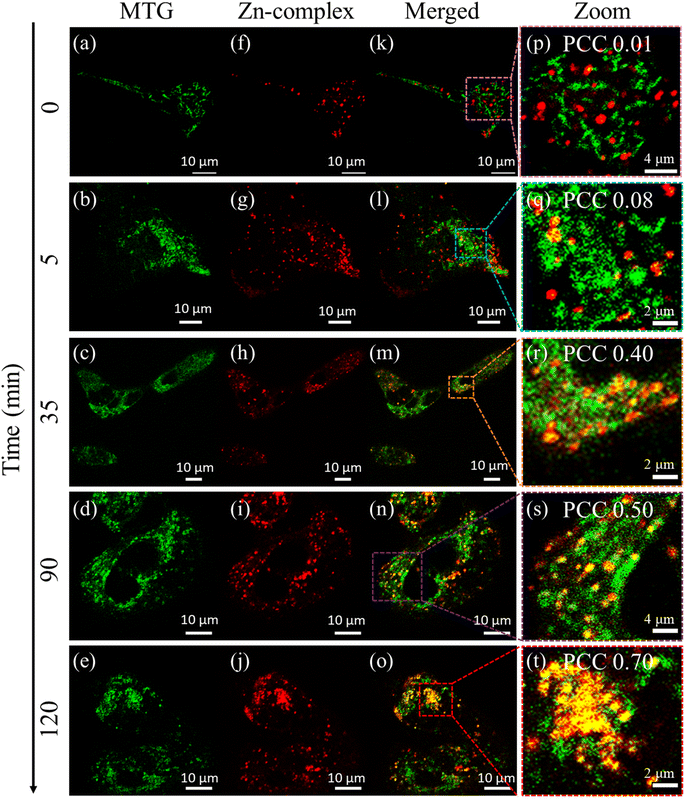
The Zn-complex was synthesized by following a modification of a previously reported procedure34 from the reaction of 2,3-diaminomaleonitrile and 2-hydroxy-4-(methyl(3-morpholinopropyl)amino)benzaldehyde (compound G) as shown in Fig. 1a. The details of the synthesis and the characterization have been provided in Scheme S1.† All the products were characterized and analyzed using high-resolution electron spray ionization mass spectrometry (ESI-MS) and 1H-NMR (Fig. S1–S8†). After successful synthesis, photophysical characterization was carried out. The bands at 387 and 442 nm in the absorption spectrum are attributed to π–π* transitions, while the highly intense band at 592 nm is ascribed to an intramolecular charge transfer transition35 (Fig. 1b). The complex exhibits an emission maximum at 633 nm, extending up to ∼750 nm, upon excitation at 592 nm. A perfect match of the absorption and excitation spectra suggested that the emission comes only from the absorbing species. The measured QY in DMSO solvent was found to be 0.33 and the measured fluorescence lifetime (Fig. 1c) was found to be 3.56 ns. The above result highlights the distinct bright and NIR nature of the Zn-complex. Before proceeding further, we checked the cytotoxicity of the Zn-complex, conducted in a HeLa cell using XTT assay. We found that the Zn-complex is highly biocompatible and has negligible toxicity (Fig. S9†) in cells. Next, we carried out the colocalization study with LysoTracker Green (LTG) in the HeLa cell to confirm the specificity of the Zn-complex to the lysosome (Fig. S10a–d†). The overlay images and the calculated Pearson Correlation Coefficient (PCC) value of 0.83 confirm its high lysosomal specificity (Fig. S10e†). The line profile diagrams shown by white dotted lines depict the high overlapping of the Zn-complex and LTG, indicating high lysosomal staining (Fig. S10f†).Mitophagy36,37 plays a crucial role in regulating cellular metabolism upon removal of the damaged mitochondria by lysosomes. We proceeded to capture the mitophagy event using carbonyl cyanide m-chlorophenylhydrazone (CCCP), which is an oxidative phosphorylation decoupling agent. CCCP makes the mitochondrial inner membrane permeable to H+ and causes the reduction of the mitochondrial inner membrane potential.38 To visualize mitophagy, the Zn-complex and MitoTracker Green (MTG) were used to stain the lysosomes and mitochondria in HEK cells, respectively. The cells were incubated for 30 minutes with the Zn-complex and MTG. After the incubation, CCCP was added to depolarize the mitochondrial membrane in a time-dependent manner. It is evident that before adding CCCP, no contact between mitochondria and lysosomes was observed and they were found to be distinct entities (Fig. 2, 0 min). As time progressed, few yellow spots appeared at around 35 min. This indicated the initiation of the mitophagy (Fig. 2), which increased substantially at around 90 to 120 minutes. The increased PCC values from ∼0.01 to 0.70 confirm the appreciable overlap between lysosomes and mitochondria during mitophagy (Fig. 2p–t).
Next, single-particle level photophysical studies such as total photon count and photons/cycle were carried out (Fig. S11†). These are very useful parameters to predict the feasibility of a fluorescent probe for its SRM activity. For this, picomolar (pM) concentration of the probe was spin-coated onto a precleaned glass coverslip. This helped in getting single particles that are separated from one another. The homebuilt single-particle setup (100×, oil immersion, 1.49 NA, Nikon TIRF objective mounted invertedly on a Nikon Ti epifluorescence microscope) was used for the data acquisition. A 532 nm laser source was used for the excitation, and emission was collected using appropriate dichroic and filter sets (details in the ESI†). For comparison, all the real-time traces are kept at the same time scales (Fig. S11a and b†). Nearly 300–400 time traces from individual bright spots were analyzed. It is imperative to emphasize that the total number of photons, ∼12![[thin space (1/6-em)]](https://www.rsc.org/images/entities/char_2009.gif) 500 (Fig. S11c†) and ∼700 photons per cycle (Fig. S11d†), were good for SRM imaging. Fig. S11e† represents the scattered plot of single-molecule localizations for ∼10–15 Zn-complexes aligning at the centre. The calculated localization precision (σSMLM), which is inversely proportional to the number of photons in a switching cycle, is obtained by fitting the 2D Gaussian distribution. A ∼48.5 nm and ∼46.3 nm precision was obtained in the x and y directions, respectively (Fig. S11f and g†). Fig. S11h† represents the localized reconstructed image of an individual Zn-complex. Since the size of lysosomes ranges from ∼0.05 to 0.50 μm, the Zn-complex can be used to visualize lysosomal dynamics in live cell conditions with the help of SRM.39
500 (Fig. S11c†) and ∼700 photons per cycle (Fig. S11d†), were good for SRM imaging. Fig. S11e† represents the scattered plot of single-molecule localizations for ∼10–15 Zn-complexes aligning at the centre. The calculated localization precision (σSMLM), which is inversely proportional to the number of photons in a switching cycle, is obtained by fitting the 2D Gaussian distribution. A ∼48.5 nm and ∼46.3 nm precision was obtained in the x and y directions, respectively (Fig. S11f and g†). Fig. S11h† represents the localized reconstructed image of an individual Zn-complex. Since the size of lysosomes ranges from ∼0.05 to 0.50 μm, the Zn-complex can be used to visualize lysosomal dynamics in live cell conditions with the help of SRM.39
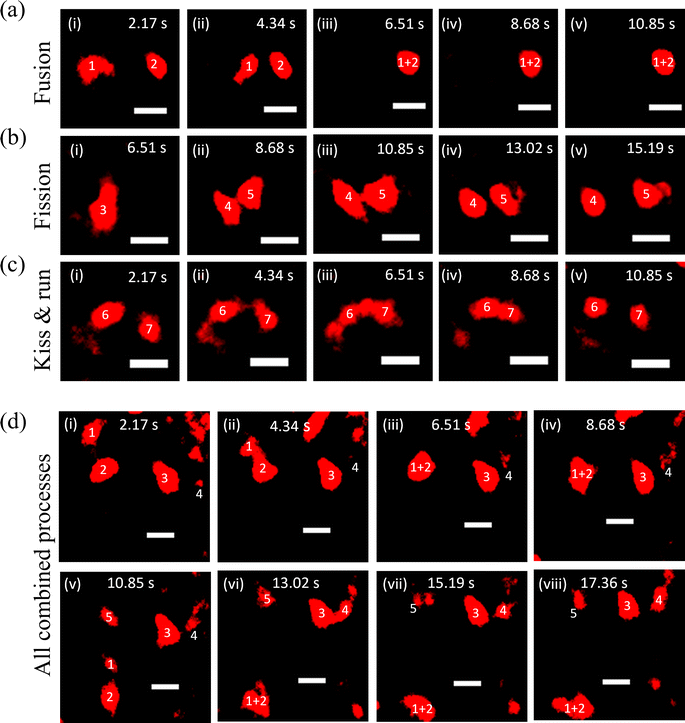
To carry out their cellular functions, lysosomes must move and interact with each other and other organelles to balance the overall homeostasis of the cells.40 Therefore, after measuring the properties of the probe at the single-particle level, we employed the SRM to capture lysosomal dynamics such as fusion, fission, and ‘kiss & run’ processes in HeLa cells. First, the fusion process was captured (Fig. 3a and Video S1†), wherein lysosomes denoted as 1 and 2 remain distinct at 2.17 s initially and head towards each other at 4.34 s. Finally, they fuse in the next frame at 6.51 s (Fig. 3a-iii) and remain fused in successive frames. Further, the fission process was observed, featuring a lysosome labelled as 3 in the initial frame at 6.51 s, disintegrating in the next frame, and achieved complete separation at 13.02 s (Fig. 3b and Video S2†). The kiss & run process was also recorded, involving lysosomes labelled as 6 and 7 in the first frame at 2.17 s, initiating their approach at 4.34 s and interacting with each other at 6.51 s. Finally, they were separated at 10.85 s (Fig. 3c and Video S3†). In a separate event, all three processes (kiss & run, fusion, and fission) that were occurring simultaneously have been presented in Fig. 3d (Video S4†).
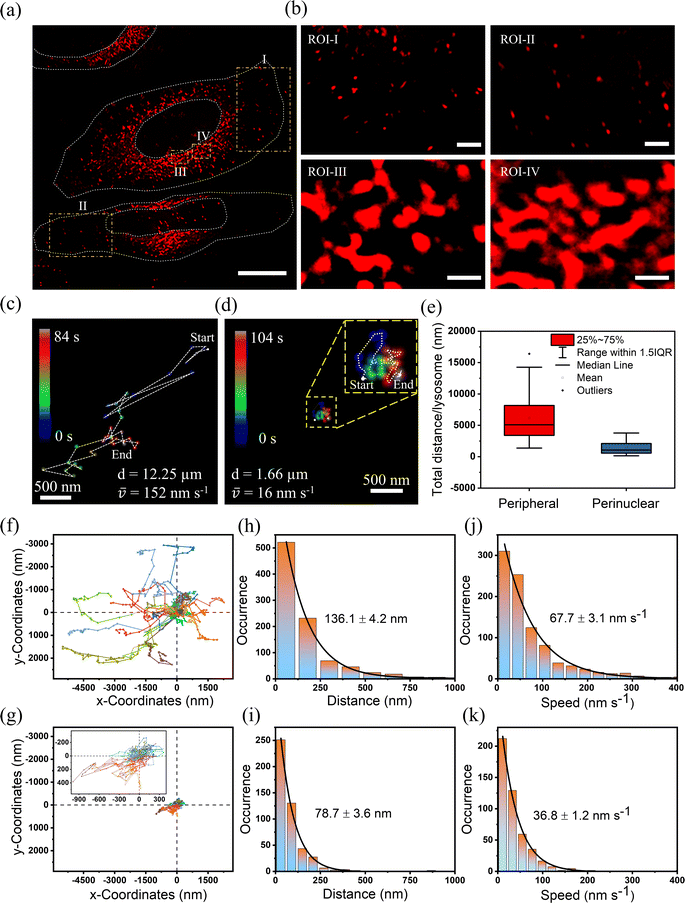
Utilizing SRRF microscopy, our focus is on deciphering the intricate dynamics of lysosomes within cellular environments. Our primary objective revolved around precisely quantifying the speed of lysosomes in various mammalian cells. We have taken both cancerous and non-cancerous cells such as HeLa, HEK, THP-1, and MDA-MB-231 and measured their speed and distance in the perinuclear and peripheral regions. We captured a video of lysosomal movement in HeLa cells using SRRF-stream (details can be found in the ESI†). Video S5† shows the complete movement of lysosomes in HeLa cells. The first frame of the video can be seen in Fig. 4a. For a detailed understanding of the lysosomal dynamics and their distance travelled, we choose regions of interest (ROIs) I–IV, where ROI-I and II are taken from peripheral regions and ROI-III and IV are taken from perinuclear regions. It is evident from the images that the perinuclear lysosomes are close together, while peripheral lysosomes are very far from each other. For measuring the speed and distance travelled, we tracked the centroid of ∼40–50 lysosomes for 50 frames (∼108 s). The trajectory of one of the lysosomes present at the cell periphery is represented in Fig. 4c (Video S6†) and the perinuclear lysosome is shown in Fig. 4d (Video S7†) respectively. The most extended trajectory for a single lysosome at the peripheral region reaches up to 12.25 μm, and the average speed of 152 nm s−1 (Fig. 4c). On the other hand, the trajectory for a single lysosome at the perinuclear region was found to be 1.66 μm, at an average speed of 16 nm s−1 (Fig. 4d). This clearly shows a ∼10-fold decrement of speed at the perinuclear region compared to peripheral lysosomes. Fig. 4e shows the distribution of total distance travelled by all lysosomes individually using a box plot. This plot shows that the total distance travelled by peripheral lysosomes is significantly more than that of perinuclear lysosomes. To demonstrate that in general peripheral lysosomes travel larger distances, we calculated the average distance and average speed by tracking 25 lysosomes individually. Fig. 4f showed that at the peripheral region, the average distance and average speed were 136.1 nm and 67.7 nm s−1, respectively. However, the corresponding average distance and speed in the perinuclear region were observed to be 78.7 nm and 36.8 nm s−1 (Fig. 4g). The distance travelled by lysosomes in the perinuclear region is much smaller than that in the peripheral region when compared to the same coordinate system. We analyzed the same lysosomal movement in the perinuclear and peripheral regions in HEK (Fig. S12 and Videos S8–S10†), THP-1 (Fig. S13 and Videos S11–S13†), and MDA-MB-231 (Fig. S14 and Videos S14–S16†) cells. We found that in all these cells, peripheral lysosomes travelled greater distances with higher speeds than perinuclear lysosomes. Interestingly, the morphological variations of lysosomes at these two locations were observed both in cancerous and non-cancerous cells (Fig. S15a and b†). The data revealed that lysosomes in the peripheral regions exhibit circular morphology, whereas perinuclear lysosomes adopt a tubular shape. These observations showed that the orchestrated positioning of lysosomes within specific cellular locations is not random. Rather, it is a strategic adaptation that aligns with their multifaceted functions. Lysosomes present at these two locations show different morphology and chemical composition to fulfill the inhomogeneous cellular need.41,42 For example, perinuclear lysosomes exhibit increased ion concentrations, facilitating the degradation of obsolete cellular materials. In contrast, peripheral lysosomes within the cell's outer regions maintain a comparatively lower ion concentration, implicating their role in intracellular transport rather than degradation.21,27,43 This transport function is crucial for maintaining cellular organization and facilitating essential cellular processes such as signal transduction, metabolism, and cellular communication. This suggests the local viscosity around the perinuclear region is higher than that around the peripheral region, which results in low motility of lysosomes in the perinuclear region compared to the peripheral region.
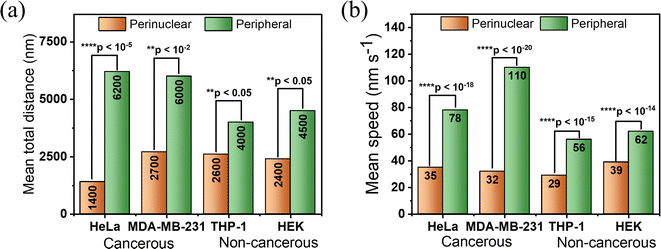
Importantly, on careful evaluation, we found that the peripheral lysosomes in cancerous cells are traveling ∼30% more in comparison to non-cancerous cells. On the other hand, the perinuclear lysosomes didn't show any significant differences (Fig. 5a and b). To comprehend the difference of distance and speed of lysosomes in cancerous and non-cancerous cells at the peripheral region, we determined the average size of lysosomes in all cells. We found the average size of these lysosomes lies within ∼240–280 nm (Fig. S16a–d†). The obtained results suggested that the motility of lysosomes is not directly affected by the size of lysosomes in cancerous and non-cancerous cells. Rather, it depends on other intracellular factors. It is to be pointed out, using an in vivo radiofrequency electron paramagnetic resonance technique, Halpern et al. reported that the aqueous cytoplasm domain of cancer cells is less viscous in comparison with normal cells. In another report, Rebelo et al., using atomic force microscopy, showed that cancerous cells in culture media, are less viscous than normal cells.28–30 Considering the above facts, it is understood that the differences observed in intracellular motility of lysosomes in cancerous and non-cancerous cells exist due to the change in local viscosity of the cytoplasmic domain.
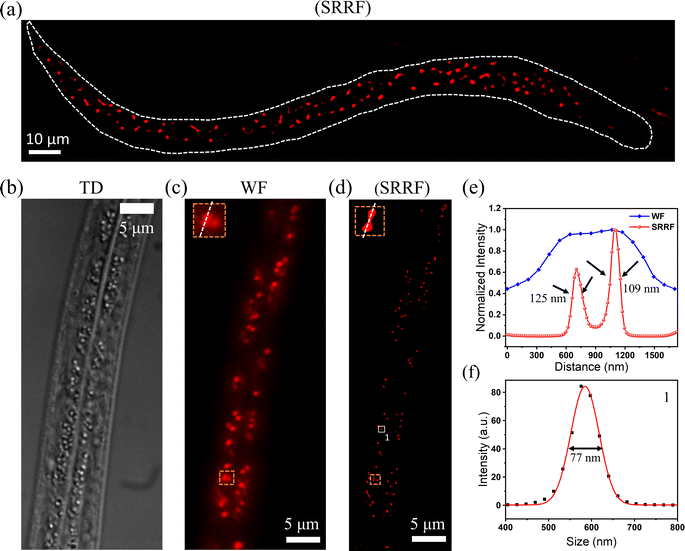
Further, to assess the in vivo imaging efficacy of the Zn-complex, we opted for C. elegans, a freely living transparent nematode commonly found in temperate terrestrial environments. This model organism was chosen because it possesses homologous chromosomes confirmed to share 60% to 80% of human genes. It has been a widely utilized model in molecular and developmental biology research.44 Lysosomes play a key role in research on triggering proteostasis renewal in C. elegans, and hence, we checked the lysosomal dynamics in this nematode.45 A 100× objective (1.5×, 1.45 NA) was used to record the movie of 3000 frames with 50 ms exposure time. The data were analyzed with an open-source version of NanoJ-SRRF on a high-performance GPU having 1076 cores. A ring radius of 0.5 with 5 times radial magnification was chosen than the original pixel size to obtain clear SRRF images. Fig. 6a shows the SRRF image of lysosomes throughout the whole C. elegans. Fig. 6b and c show the transmission detection (TD) and wide-field (WF) images of C. elegans, respectively. Fig. 6d shows the super-resolved image of lysosomes. Fig. 6e is the comparison of WF and SRRF of two close lysosomes shown in the inset of Fig. 6c and d with FWHM of 109 and 125 nm, respectively. It is to be pointed out here that, at the maximum resolution of a lysosome, a diameter of ∼77 nm was obtained by SRRF microscopy, as shown in Fig. 6f.
Lysosomes and LROs play a very significant role in C. elegans embryogenesis and its functionality. Next, we studied their live evolution from single cell to its full maturity adult stage. For the experiment, gravid adults were grown in an OP-50 seeded NGM plates that were stained with the Zn-complex for 24 hours. For a detailed understanding of embryonic evolution, we have taken 4 embryos marked as 1–4 at the different stages (Fig. 7a) of the lifecycle of C. elegans. The TD images of these embryos and their corresponding fluorescence images are shown in Fig. 7a–c. What we observed was the Zn-complex fluorescent probe internalized only in the gonads and not in predeveloped embryos which were protected by the eggshell (marked 4 in Fig. 7a–c). The stained gonad later developed into an embryo (embryos 1–3) and was used for our embryonic evolution. The embryo marked as Em 1 is in a double-cell stage. Based on their size, as reported earlier by Radek Jankele et al.,46 we marked the larger cell as AB, whereas the smaller one was denoted as P1. The AB cells after development give rise to the nervous system, the hypodermis, and half of the pharynx, while the P1 cells give rise to the intestinal cells and body wall muscle cells.47 In the AB cell, as observed in ESI Video S17† and in Fig. 7b, lysosomes (marked as yellow arrow) were seen to merge and form large LROs. The size of the LROs found to be in wild-type C. elegans varies from 0.7 to 1.2 μm,48 which is larger than a normal lysosome size of 0.1–0.5 μm in mammalian cells.39
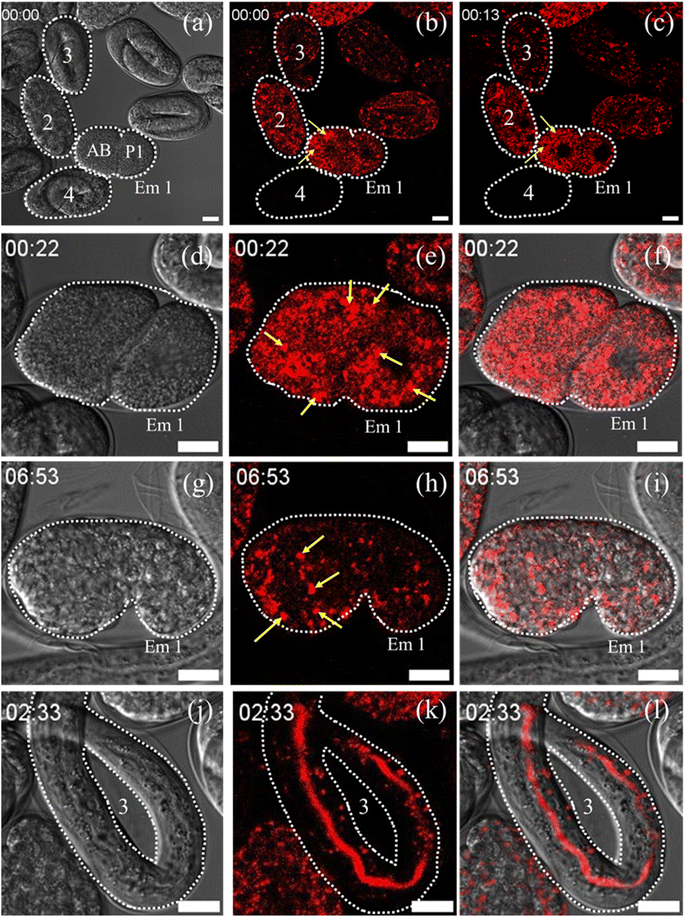 | ||
| Fig. 7 (a) TD image of C. elegans embryos marked as Em 1, 2, 3 and 4, where Em 1 is in the two cell stage and designated as AB and P1.46 (b) Corresponding Zn-complex stained image of C. elegans shows the formation of unstable large LROs (yellow arrow) in AB-cells. (c) Disappearance of these unstable LROs in the AB-cell at around 13 minutes. (d–f) The TD, Zn-complex stained and the merged images of Em 1. The data show the increase in LRO number and density (marked as yellow) at around 22 min during cell division. (g–i) The TD, stained, and merged images of Em 1 in the comma stage. The results show the formation of stable LROs at 6–7 hours. (j–l) The TD, stained and merged images of embryo 3. The data show the accumulation of the Zn-complex probe in the intestinal cells and intestinal lumen. Scale bar 10 μm. The corresponding video of the full event has been presented as Videos S17 and S18.† | ||
The structures were found to be highly unstable and disappeared from the AB cell within 13 min, as shown in Fig. 7c (corresponding TD image has been provided in Fig. S17a†). We observed that the number of these large distinct LROs increased during cell division of Em 1 at around 22 minutes (Fig. 7d–f) up to 51 minutes (Fig. S17b and c†). During the initial stages of embryogenesis, the lysosomal movement seems to be very fast, with many fusion/fission events happening (22–51 minutes) and giving rise to LROs, as shown in Video S17.† Finally, these LROs were found to be stable at the comma stage of the embryos at around 5–7 hours (Fig. 7g–i). The LROs were then transported downstream with further embryonic development during the 2-fold and 3-fold stages of the embryo, as shown in Video S10.† After that, during the elongation and quickening stage of the embryo, we can see it remaining stable and distributed throughout the body of the C. elegans (Video S18†). It is further interesting to be pointed out that probe-stained lysosomes or LROs were spread all across the cytoplasm of the embryo in the closely matured young adult at around 14 hours (the time is considered assuming the full cycle of embryonic development from a single cell to a fully matured young adult). Next, the probe was found to be accumulated in the intestinal cells and intestinal lumen as shown in marked embryo 3 and presented in Fig. 7j–l. The probe persists till the hatching stage of the embryo and gets cleared from the body. We hope that our observations on embryogenic evolution of lysosomes and LROs in C. elegans will not only help in understanding various activities related to their functions but will also help in understanding various LRO related disease conditions like umbilical hernia, coarse facial features, obesity, hypoglycemia, postnatal growth retardation, and hepatomegaly. LROs also contain various neurological pathway intermediates which have been associated with aging and Alzheimer's disease. Hence our observation can also be correlated with aging-related studies in C. elegans.
Conclusion
We present a biocompatible, non-toxic, highly bright, and photostable NIR emissive fluorescent Zn-complex for the long-term speed mapping of lysosomes using the SRM imaging technique in various cancerous and non-cancerous cells. The probe was also very efficient for the in vivo lysosomal embryogenic evolution in C. elegans. The probe was able to directly visualize live fission, fusion, and kiss & run. During their dynamic activity, the motility and the exact location of the lysosomes at each point were precisely mapped. Using various cancerous and non-cancerous cells, we observed a notable speed change in the peripheral region of cells. The lysosomes move much faster in cancer cells than non-cancer cells in the peripheral regions. The probe was very efficient in capturing the smallest size of lysosome down to ∼77 nm in live C. elegans. It also successfully tracked the complete embryogenic evolution of lysosomes and LROs at different stages, starting from a single cell, extending to a fully matured C. elegans, and provided very insightful information about their dynamical changes during the evolution. We hope that our observations on embryogenic evolution will help in understanding the therapeutic interventions for various disease conditions.Data availability
The data (instrumentation, synthetic procedures, structural characterization data, photophysical study, super-resolution imaging, in vivo imaging) that support this article are available in the article itself and its ESI.†Author contributions
AS synthesized and characterized all the compounds with the help of GTS. AS performed all the bulk-level photophysical experiments with the help of SS. AS performed the single-molecule studies. FA cultured and performed all cellular experiments with the help of RG and AS. KK developed the scripts for multiple analysis concerning lysosomal mobility with the help of AS. BM cultured and performed all the C. elegans related experiments. AS analyzed the data with the help of KK and FA. AS and FA performed live cell SRM with the help of KK. CKN guided the complete project and wrote the manuscript with the help of AS, KK, and BM.Conflicts of interest
The authors declare no conflict of interest.Acknowledgements
CKN is thankful for the research grant of the Council of Scientific & Industrial Research (IITM/CSIR/CKN/449) and Science and Engineering Research Board's (SERB) core research grant (CRG/2020/000268). CKN is thankful to the facilities of the Advanced Material Research Centre (AMRC), IIT Mandi. CKN acknowledge the Sophisticated Analytical and Technical Help Institutes (SATHI), IIT Delhi and Indian Science Technology and Engineering facilities Map (I-STEM). AS, KK, BM, GTS, and SS thank the Ministry of Education, India, for the scholarship. FA thanks the SERB for the scholarship. RG acknowledges the Prime Minister Research Fellowship. CKN thanks IIT Mandi for providing a state-of-the-art instrumentation facility including the cell culture and C. elegans model system.References
- S. Sreedharan, et al., Multimodal Super-resolution Optical Microscopy Using a Transition-Metal-Based Probe Provides Unprecedented Capabilities for Imaging Both Nuclear Chromatin and Mitochondria, J. Am. Chem. Soc., 2017, 139, 15907–15913 CrossRef CAS PubMed.
- M. R. Gill, et al., A ruthenium(II) polypyridyl complex for direct imaging of DNA structure in living cells, Nat. Chem., 2009, 1, 662–667 CrossRef CAS PubMed.
- A. Byrne, C. S. Burke and T. E. Keyes, Precision targeted ruthenium(II) luminophores; highly effective probes for cell imaging by stimulated emission depletion (STED) microscopy, Chem. Sci., 2016, 7, 6551–6562 RSC.
- Q. Chen, et al., Super-Resolution Tracking of Mitochondrial Dynamics with an Iridium(III) Luminophore, Small, 2018, 14, 1802166 CrossRef PubMed.
- F. Dröge, et al., A Dinuclear Osmium(II) Complex Near-Infrared Nanoscopy Probe for Nuclear DNA, J. Am. Chem. Soc., 2021, 143, 20442–20453 CrossRef PubMed.
- X. Tian, et al., A Cyclometalated Iridium(III) Complex as a Microtubule Probe for Correlative Super-Resolution Fluorescence and Electron Microscopy, Adv. Mater., 2020, 32, 2003901 CrossRef CAS PubMed.
- K. L. Smitten, et al., Mononuclear ruthenium(II) theranostic complexes that function as broad-spectrum antimicrobials in therapeutically resistant pathogens through interaction with DNA, Chem. Sci., 2020, 11, 8828–8838 RSC.
- K. L. Smitten, et al., Using Nanoscopy To Probe the Biological Activity of Antimicrobial Leads That Display Potent Activity against Pathogenic, Multidrug Resistant, Gram-Negative Bacteria, ACS Nano, 2019, 13, 5133–5146 CrossRef CAS PubMed.
- L. Schermelleh, et al., Super-resolution microscopy demystified, Nat. Cell Biol., 2019, 21, 72–84 CrossRef CAS PubMed.
- B. Huang, M. Bates and X. Zhuang, Super-Resolution Fluorescence Microscopy, Annu. Rev. Biochem., 2009, 78, 993–1016 CrossRef CAS PubMed.
- X. Tian, et al., Probe for simultaneous membrane and nucleus labeling in living cells and in vivo bioimaging using a two-photon absorption water-soluble Zn(II) terpyridine complex with a reduced π-conjugation system, Chem. Sci., 2017, 8, 142–149 RSC.
- Y. Chen, Y. Bai, Z. Han, W. He and Z. Guo, Photoluminescence imaging of Zn2+ in living systems, Chem. Soc. Rev., 2015, 44, 4517–4546 RSC.
- S. Sinha, et al., Cysteamine-Based Cell-Permeable Zn2+-Specific Molecular Bioimaging Materials: From Animal to Plant Cells, ACS Appl. Mater. Interfaces, 2013, 5, 11730–11740 CrossRef CAS PubMed.
- J. Tang, et al., A photoactivatable Znsalen complex for super-resolution imaging of mitochondria in living cells, Chem. Commun., 2016, 52, 11583–11586 RSC.
- Z. Feng, et al., Lighting up RNA-specific multi-photon and super-resolution imaging using a novel zinc complex, Nanoscale, 2023, 15, 5486–5493 RSC.
- C. De Duve and R. Wattiaux, Functions of lysosomes, Annu. Rev. Physiol., 1966, 28, 435–492 CrossRef CAS PubMed.
- C. Yang and X. Wang, Lysosome biogenesis: regulation and functions, J. Cell Biol., 2021, 220, e202102001 CrossRef CAS PubMed.
- H. Xu and D. Ren, Lysosomal physiology, Annu. Rev. Physiol., 2015, 77, 57–80 CrossRef CAS PubMed.
- J. Pu, C. M. Guardia, T. Keren-Kaplan and J. S. Bonifacino, Mechanisms and functions of lysosome positioning, J. Cell Sci., 2016, 129, 4329–4339 CrossRef CAS PubMed.
- B. Cabukusta and J. Neefjes, Mechanisms of lysosomal positioning and movement, Traffic, 2018, 19, 761–769 CrossRef CAS PubMed.
- A. Ballabio and J. S. Bonifacino, Lysosomes as dynamic regulators of cell and organismal homeostasis, Nat. Rev. Mol. Cell Biol., 2020, 21, 101–118 CrossRef CAS PubMed.
- E. R. Machado, I. Annunziata, D. van de Vlekkert, G. C. Grosveld and A. d'Azzo, Lysosomes and Cancer Progression: A Malignant Liaison, Front. Cell Dev. Biol., 2021, 9, 642494 CrossRef PubMed.
- C. Fennelly and R. K. Amaravadi, Lysosomal Biology in Cancer. in Lysosomes: Methods and Protocols, ed. K. Öllinger and H. Appelqvist, Springer New York, New York, NY, 2017, pp. 293–308, DOI:10.1007/978-1-4939-6934-0_19.
- R. Halaby, Role of lysosomes in cancer therapy, Res. Rep. Biol., 2015, 6, 147–155 CAS.
- N. Gustafsson, et al., Fast live-cell conventional fluorophore nanoscopy with ImageJ through super-resolution radial fluctuations, Nat. Commun., 2016, 7, 12471 CrossRef CAS PubMed.
- S. Culley, K. L. Tosheva, P. Matos Pereira and R. Henriques, SRRF: universal live-cell super-resolution microscopy, Int. J. Biochem. Cell Biol., 2018, 101, 74–79 CrossRef CAS PubMed.
- P. Saftig and J. Klumperman, Lysosome biogenesis and lysosomal membrane proteins: trafficking meets function, Nat. Rev. Mol. Cell Biol., 2009, 10, 623–635 CrossRef CAS PubMed.
- H. J. Halpern, G. V. R. Chandramouli, E. D. Barth, C. Yu, M. Peric, D. J. Grdina and B. A. Teicher, Diminished Aqueous Microviscosity of Tumors in Murine Models Measured with In Vivo Radiofrequency Electron Paramagnetic Resonance 1, Cancer Res., 1999, 59(22), 5836–5841 CAS.
- L. E. Shimolina, et al., Imaging tumor microscopic viscosity in vivo using molecular rotors, Sci. Rep., 2017, 7, 41097 CrossRef CAS PubMed.
- L. M. Rebelo, J. S. De Sousa, J. Mendes Filho and M. Radmacher, Comparison of the viscoelastic properties of cells from different kidney cancer phenotypes measured with atomic force microscopy, Nanotechnology, 2013, 24, 055102 CrossRef CAS PubMed.
- H. C. Roh, S. Collier, J. Guthrie, J. D. Robertson and K. Kornfeld, Lysosome-Related Organelles in Intestinal Cells are a Zinc Storage Site in C. elegans, Cell Metab., 2012, 15, 88–99 CrossRef CAS PubMed.
- G. J. Hermann, et al., Genetic Analysis of Lysosomal Trafficking in Caenorhabditis elegans, Mol. Biol. Cell, 2005, 16, 3273–3288 CrossRef CAS PubMed.
- B. J. Earley, A. D. Mendoza, C.-H. Tan and K. Kornfeld, Zinc homeostasis and signaling in the roundworm C. elegans, Biochim. Biophys. Acta, Mol. Cell Res., 2021, 1868, 118882 CrossRef CAS PubMed.
- Y. Hai, et al., Luminescent zinc salen complexes as single and two-photon fluorescence subcellular imaging probes, Chem. Commun., 2011, 47, 2435–2437 RSC.
- D. Xie, et al., Construction of an orthogonal ZnSalen/Salophen library as a colour palette for one- and two-photon live cell imaging, Chem. Sci., 2014, 5, 2318–2327 RSC.
- R. J. Youle and D. P. Narendra, Mechanisms of mitophagy, Nat. Rev. Mol. Cell Biol., 2011, 12, 9–14 CrossRef CAS PubMed.
- G. Ashrafi and T. L. Schwarz, The pathways of mitophagy for quality control and clearance of mitochondria, Cell Death Differ., 2013, 20, 31–42 CrossRef CAS PubMed.
- F. Anjum, et al., Directly visualizing mitochondrial shrinkage and lysosomal expansion during mitophagy using super-resolution microscopy, New J. Chem., 2022, 46, 20069–20073 RSC.
- A. Yadav, et al., Bovine Serum Albumin-Conjugated Red Emissive Gold Nanocluster as a Fluorescent Nanoprobe for Super-resolution Microscopy, J. Phys. Chem. Lett., 2020, 11, 5741–5748 CrossRef CAS PubMed.
- B. Storrie and M. Desjardins, The biogenesis of lysosomes: is it a kiss and run, continuous fusion and fission process?, BioEssays, 1996, 18, 895–903 CrossRef CAS PubMed.
- L. Wang, Y. Xiao, W. Tian and L. Deng, Activatable Rotor for Quantifying Lysosomal Viscosity in Living Cells, J. Am. Chem. Soc., 2013, 135, 2903–2906 CrossRef CAS PubMed.
- C. Bussi and M. G. Gutierrez, One size does not fit all: lysosomes exist in biochemically and functionally distinct states, PLoS Biol., 2024, 22, e3002576 CrossRef CAS PubMed.
- D. E. Johnson, P. Ostrowski, V. Jaumouillé and S. Grinstein, The position of lysosomes within the cell determines their luminal pH, J. Cell Biol., 2016, 212, 677–692 CrossRef CAS PubMed.
- S. J. Cook, et al., Whole-animal connectomes of both Caenorhabditis elegans sexes, Nature, 2019, 571, 63–71 CrossRef CAS PubMed.
- K. A. Bohnert and C. Kenyon, A lysosomal switch triggers proteostasis renewal in the immortal C. elegans germ lineage, Nature, 2017, 551, 629–633 CrossRef CAS PubMed.
- R. Jankele, R. Jelier and P. Gönczy, Physically asymmetric division of the C. elegans zygote ensures invariably successful embryogenesis, Elife, 2021, 10, e61714 CrossRef CAS PubMed.
- M. Kubo and B. Cinader, IL-3 production as a function of age and its correlation with splenomegaly: age versus disease-related change, Immunol. Lett., 1990, 24, 133–136 CrossRef CAS PubMed.
- E. M. Campbell and H. Fares, Roles of CUP-5, the Caenorhabditis elegans orthologue of human TRPML1, in lysosome and gut granule biogenesis, BMC Cell Biol., 2010, 11, 40 CrossRef PubMed.
Footnotes |
| † Electronic supplementary information (ESI) available. See DOI: https://doi.org/10.1039/d4sc04638b |
| ‡ Abdul Salam, Kush Kaushik, and Bodhidipra Mukherjee equally contributed to this work. |
| This journal is © The Royal Society of Chemistry 2024 |

