 Open Access Article
Ultra-low dual detection of tetrahydrocannabinol and cannabidiol in saliva based on electrochemical sensing and machine learning: overcoming cross-interferences and saliva-to-saliva variations†
Greter A.
Ortega‡
,
Herlys
Viltres‡
 ,
Hoda
Mozaffari
,
Syed Rahin
Ahmed
,
Seshasai
Srinivasan
,
Hoda
Mozaffari
,
Syed Rahin
Ahmed
,
Seshasai
Srinivasan
 * and
Amin Reza
Rajabzadeh
 *
*
School of Engineering Practice and Technology, McMaster University, 1280 Main Street West, Hamilton, ON L8S 4L8, Canada. E-mail: ssriniv@mcmaster.ca; rajaba@mcmaster.ca
First published on 15th July 2024
Abstract
A novel alternative to cope with saliva-to-saliva variations and cross-interference while sensing delta-9-tetrahydrocannabinol (THC) and cannabidiol (CBD) is reported here using two voltammetric sensors coupled with machine learning. The screen-printed electrodes modified with the same analyte molecules (m-Z-THC and m-Z-CBD) were employed for sensing ultra-low concentrations of THC and CBD in the 0 to 5 ng mL−1 range in real human saliva samples. Simultaneous detection of THC and CBD was carried out using m-Z-THC or m-Z-CBD to study the performance of each modified sensor. Also, CBD and THC have the same molecular structure; there is only a slight difference in how the atoms are arranged, and therefore both molecules will have similar electrochemical performance. Consequently, CBD can be a potential interference while detecting THC and THC can be an interference during CBD detection using electrochemical sensors. Therefore, machine learning was introduced to analyze the sensor analytical responses to overcome such issues. The data processing results provide suitable accuracies of 100% for training in the case of both sensors and 92 and 83% for m-Z-THC and m-Z-CBD, respectively, for dataset testing THC and CBD in saliva samples. Additionally, the saliva samples containing CBD and THC as cross-interference were accurately identified and classified.
1. Introduction
Electrochemical detection of coexisting analytes with similar structure interferents is a significant problem in chemical sensors. For example, Δ9-tetrahydrocannabinol (THC), which is the main psychoactive of cannabis, is currently traceable in saliva samples by using electrochemical sensors.1 However, cannabis-based medicine can now be prescribed for medicinal use in many countries, comprising both THC and the familiar component cannabidiol (CBD).2The previous work published by the authors of this article reported an innovative electrochemical-based sensor to detect ultra-low Δ9-tetrahydrocannabinol (THC) in saliva.3 The carbon-based working electrode (WE) was modified in the sensor fabrication by electrodeposition of the same analyte to be detected later in the sample using square wave voltammetry (SWV). Nevertheless, while THC presents a phenol group, oxidizable at potentials near 0.4 V, CBD arranges two aromatic meta-hydroxyl groups with the same oxidizable capability at almost the same potential as THC. Hence, CBD is a substantial interferent during the detection of THC by electrochemistry.
Nowadays, strategies have been implemented to overcome interferences during electrochemical testing. Overall, some of them reported for THC and CBD detection4 are pre-treatment procedures that encompass solid-phase extraction,5 paper chromatography,6 or other separation methods;7 molecularly imprinted nanoparticles (nanoMIPs);8 working electrode modifications with macrocyclic compounds9 and suitable (nano)materials.10 In other cases, two different methodologies have been applied to prevent the interferences because of the adsorption of oxidation products, such as pH optimization and the pre-treatment of the electrode through a cathodic potential step.11 However, all these strategies are ineffective in detecting an ultra-low concentration of THC in the presence of CBD under practical sensor conditions and in a short time.
Furthermore, many challenges have not been fully addressed in the literature for saliva sensors due to the complexity of the nature of saliva.12–14 Human saliva is a complex matrix with a viscosity of approximately 1.30 times higher than that of water, affecting the analyte's diffusion and the reaction rates on the electrodes.13,14 In addition, saliva has various natural or adulterant electroactive components that may interfere with the electrochemical performance of the analyte. Furthermore, the pH, conductivity, and protein–chemical–solid compositions of saliva, among others, change over time and vary from person to person. For all the reasons mentioned, obtaining consistent responses during the electrochemical testing of chemical sensors is incredibly problematic.
Machine learning (ML) algorithms offer exceptional solutions to complex and large-size data systems involving problems that traditionally require tedious hand-tuning rules and tasks with fluctuating environments.15 ML refers to computational techniques that learn from past experiences, i.e., data, to create logical and precise prediction algorithms. The data used in these learning algorithms play a crucial role in the success of ML models; hence, ML is the intersection of data analysis and statistics with computer programming.16
Some reports have implemented ML algorithms coupled with different analytical techniques to detect an assortment of analytes in the past years. Some examples are fluorescence,17 colorimetry,18 colour-based lateral flow test,19 ion-mobility spectrometry (IMS), and photoionization detection comprising electrochemical-based sensors (PIDECS),20 transcriptomics and proteomics data,21 Fourier transform infrared spectroscopy (FTIR),22,23 and electrochemical sensors.24 Table S1, provided in the ESI,† presents a summary of the reports dealing with ML in electrochemical sensors. In THC detection, few reports deal with ML during data set analysis; one used a chemiresistor25 and the other used impedance.26 Recently Rao et al.27 studied the detection of a broad range of dopamine concentrations (9–200 μM) in the presence of a similar structure molecule epinephrine (EP) in PBS and blood and urine diluted 100 times in PBS (to eliminate the matrix effect) by implementing ML techniques sequentially. They used dual-modal sensors and selective features to feed the proposed ML algorithm. The focus of this work, however, is to detect ultra-low concentrations of cannabis in real samples (real saliva) in the presence of similar structures via feeding different ML algorithms separately with the entire voltammetry signals. Given the similar molecular structures of CBD and THC, which lead to comparable electrochemical performance and potential cross-interference, the novelty of this work lies in the dual detection of THC and CBD, differentiating their concentrations and addressing their cross-interferences while mitigating saliva-to-saliva variations. Table S2 is provided in the ESI† for details.
This paper reports on the development of two sensors to detect THC and CBD in real saliva. This work also introduces ML to analyze the data sets obtained from the electrochemical THC and CBD sensors to overcome the person-to-person variation setbacks and the cross-interference problems in complex saliva samples.
2. Materials and methods
For the purposes of this research, saliva samples from healthy humans in the lab, the authors, were used in this study. The screen-printed electrodes (SPE), TE100, employed in this study were obtained from Zensor R&D and comprise working (3 mm/0.071 cm2) and counter carbon electrodes and a silver reference electrode (TE100). From now on, Zensor will be used to refer to SPEs. The reagents (−)-trans-Δ9-tetrahydrocannabinol (THC) and cannabidiol (CBD) were obtained from Cerilliant-Sigma-Aldrich as standard solutions in methanol (ampule of 1 mg mL−1) with the appropriate certification for laboratory uses. An ELISA THC Oral Fluid Kit Product (no. 120519) was acquired from Neogen Corporation.Electrochemical analyses were carried out using a mono-potentiostat PalmSens4 with the PSTrace 5-Palm-Sens software. Samples were analyzed by performing Fourier transform infrared (FTIR) spectroscopy using a micro-attenuated total reflectance (micro-ATR) accessory equipped with a germanium crystal under a Hyperion 2000 microscope incorporated into a Bruker Tensor II spectrometer. XPS analyses were performed using a Kratos AXIS Supra X-ray photoelectron spectrometer with a monochromatic Al K(alpha) source (15 mA, 15 kV). The work function of the spectrometer was calibrated to the Au 4f7/2 line for metallic gold with a binding energy (BE) of 83.96 eV, and the dispersion of the equipment was regulated to the Cu 2p3/2 line of metallic copper with a BE of 932.62 eV. An analysis area of 300 × 700 microns and a pass energy of 160 eV were the conditions used to collect the survey scans. High-resolution analyses were performed using an analysis area of 300 × 700 microns and a pass energy of 20 eV. The spectra were charged and corrected to the C–C, C–H line of the carbon 1 s spectrum (aliphatic carbon) set to 285.00 eV and analyzed using the CasaXPS software (version 2.3.14).
2.1. Electrochemical sensors
In the THC-based sensor, the working electrode was modified with THC molecules (m-Z-THC), and in the case of the CBD-based sensor, with CBD molecules (m-Z-CBD).![[thin space (1/6-em)]](https://www.rsc.org/images/entities/char_2009.gif) :
:![[thin space (1/6-em)]](https://www.rsc.org/images/entities/char_2009.gif) 1 ratio were added onto the m-Z-THC electrodes and immediately subjected to SWV using the subsequent conditions: 0.05 V for 30 s as a precondition potential, 3 s as the equilibration time, 0–0.8 V range for the voltammetric potential scan from and a frequency of 15 Hz, 25 mV as the amplitude, and 5 mV as the step potential. For traditional analysis, the current values corresponding to each concentration result from subtracting the intensity of the peaks for the samples recovered with m-Z-THC (sensing electrode) minus the signal obtained with the pristine electrode (pristine Zensor, p-Z).
1 ratio were added onto the m-Z-THC electrodes and immediately subjected to SWV using the subsequent conditions: 0.05 V for 30 s as a precondition potential, 3 s as the equilibration time, 0–0.8 V range for the voltammetric potential scan from and a frequency of 15 Hz, 25 mV as the amplitude, and 5 mV as the step potential. For traditional analysis, the current values corresponding to each concentration result from subtracting the intensity of the peaks for the samples recovered with m-Z-THC (sensing electrode) minus the signal obtained with the pristine electrode (pristine Zensor, p-Z).
2.2. Machine learning algorithms
Principal component analysis and several ML techniques like random forest, artificial neural network, and support vector machine for dimensionality reduction were used to classify THC and CBD saliva samples with concentrations of 0, 2, and 5 ng mL−1. The training dataset was divided into subspaces based on an attribute that offers maximum information gain. In all cases, the ratio of training to testing dataset was 4. In this study, the optimal number of random trees was 200. An artificial neural network (ANN) was also used in this study for the purposes of classification. The dense network structure used in this study consisted of three hidden layers with 32, 64, and 128 nodes, respectively. The rectified linear unit function was used for the activation of the hidden layers, and softmax for the output layer was implemented. Additionally, regularization techniques, as well as dropout, were executed. This study also used the support vector machine (SVM) as another alternative for classification and regression. In this case, a radial basis function kernel for classification and a moderate regularization parameter for regression were included.A logistic regression classifier for binary classification of the interaction between THC and CBD was also evaluated. Lastly, this work used principal component analysis (PCA) for dimensionality reduction and different preprocessing techniques, including standard scaler and non-linear power transformer for feature scaling. In all cases, the cumulative explained variance of the transformed dataset covered 98% of the original datasets. A detailed explanation of each algorithm is described in the ESI† S2.2.
3. Results and discussion
3.1. Characterization of m-Z-THC and m-Z-CBD
Both sensors, the m-Z-THC and the m-Z-CBD developed in this study, were designed based on the hydroxyl group oxidation present in THC and CBD molecules during the application of a potential to create C![[double bond, length as m-dash]](https://www.rsc.org/images/entities/char_e001.gif) O moieties followed by the formation of quinones, adducts, or more complex structures (Fig. 1a).28 The presence of THC or CBD species in the sensors (m-Z-THC and m-Z-CBD) enhanced further physical and chemical interactions of the working electrodes with the THC or CBD molecules present in the sample, hence the oxidation process. To determine the electrochemical behaviour of bare Zensor and modified Zensor electrodes, SWV was performed in PBS solution. After modifying the pristine Zensor electrodes, an oxidation peak between 0.4 and 0.7 V appears in the m-Z-THC and the m-Z-CBD sensors (Fig. 1b). The peak related to m-Z-CBD appeared at slightly higher potentials compared to m-Z-THC.
O moieties followed by the formation of quinones, adducts, or more complex structures (Fig. 1a).28 The presence of THC or CBD species in the sensors (m-Z-THC and m-Z-CBD) enhanced further physical and chemical interactions of the working electrodes with the THC or CBD molecules present in the sample, hence the oxidation process. To determine the electrochemical behaviour of bare Zensor and modified Zensor electrodes, SWV was performed in PBS solution. After modifying the pristine Zensor electrodes, an oxidation peak between 0.4 and 0.7 V appears in the m-Z-THC and the m-Z-CBD sensors (Fig. 1b). The peak related to m-Z-CBD appeared at slightly higher potentials compared to m-Z-THC.
 | ||
| Fig. 1 a) Schematic representation of the oxidation of THC and CBD molecules. b) SWV response of THC-based (m-Z-THC, 130 ng) and CBD-based (m-Z-CBD, 100 ng) sensors in PBS. | ||
On the other hand, FTIR and XPS characterization techniques were employed to study the pristine and modified electrode samples to get a deeper understanding of the surface of the electrode. In the FTIR spectrum (Fig. S1a†), the weak peaks in the 3000–2800 cm−1 region are correlated with the stretching vibration of C–H bonds for pristine and modified electrodes. The characteristic peak for the stretching of the O![[double bond, length as m-dash]](https://www.rsc.org/images/entities/char_e001.gif) C bond appears at approximately 1746 cm−1 in all samples (Fig. S1b,† zoom of the region 2000–1000 cm−1). The signal at 1580 cm−1 can be assigned to the C
C bond appears at approximately 1746 cm−1 in all samples (Fig. S1b,† zoom of the region 2000–1000 cm−1). The signal at 1580 cm−1 can be assigned to the C![[double bond, length as m-dash]](https://www.rsc.org/images/entities/char_e001.gif) C bonds in aromatic ring structures, and the band at 1441 cm−1 was associated with the C–H bending mode. However, significant changes after pristine electrode modification were not possible to distinguish in the FTIR spectrum due to this technique's ability to sense the bulk material, not the surface. In this case, all chemical processes for Zensor electrode modification occur on the surface of the working electrode; therefore, the XPS technique was used to gain a clearer vision.
C bonds in aromatic ring structures, and the band at 1441 cm−1 was associated with the C–H bending mode. However, significant changes after pristine electrode modification were not possible to distinguish in the FTIR spectrum due to this technique's ability to sense the bulk material, not the surface. In this case, all chemical processes for Zensor electrode modification occur on the surface of the working electrode; therefore, the XPS technique was used to gain a clearer vision.
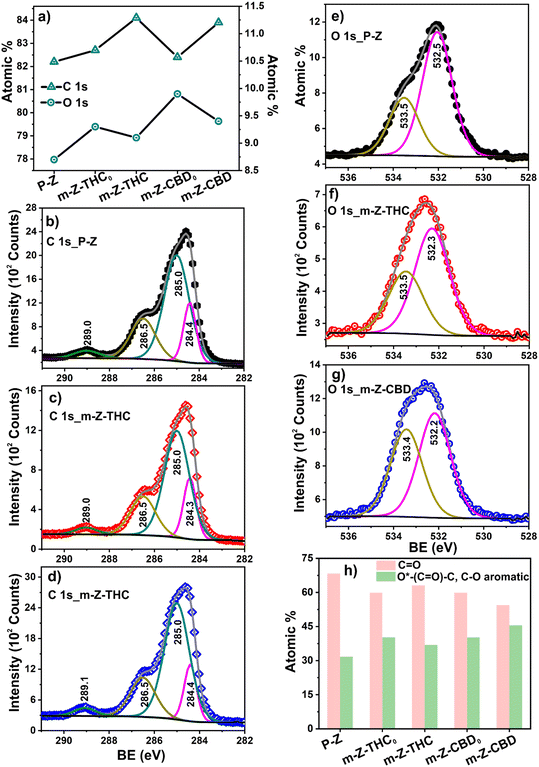
The XPS spectrum for the WE surface of pristine Zensor electrodes (p-Z) was obtained after dispensing THC or CBD (m-Z-THC0 and m-Z-CBD0) and SWV electrodeposition in PBS was the final manufacturing step. The survey spectra confirmed the existence of only C, O, N, Cl, S, and Si for all five samples and P in four of the samples (Table S5†). After pristine Zensor modification, the C and O atomic percent increased for both m-Z-THC and m-Z-CBD electrodes (Fig. 3a). In the case of the electrodes after dispensing m-Z-THC0 and m-Z-CBD0, the amount of C was observed to be slightly lower than that after the final electrodeposition step; meanwhile, the percent of O was found to be lower for the final sensors (m-Z-THC and m-Z-CBD). These changes in the sample's composition could be related to the interaction of the organic molecules with the working electrode surface and the formation of complex structures between the modifier molecules (Fig. 1a).
The C 1s high-resolution signal of the pristine sample was deconvoluted into four contributions at 284.4, 285.0, 286.5, and 289.0 eV (Fig. 2b, Table S6†). The first contribution is related to aromatic C![[double bond, length as m-dash]](https://www.rsc.org/images/entities/char_e001.gif) C from graphitic carbon and ink employed for the working electrode preparation.29 The signal at 285.0 eV was associated with C–C/C–H. The contributions at higher binding energies, 286.5 and 289.0 eV, were related to C–OH/C–O–C/C–Cl and O–C
C from graphitic carbon and ink employed for the working electrode preparation.29 The signal at 285.0 eV was associated with C–C/C–H. The contributions at higher binding energies, 286.5 and 289.0 eV, were related to C–OH/C–O–C/C–Cl and O–C![[double bond, length as m-dash]](https://www.rsc.org/images/entities/char_e001.gif) O, respectively.30,31 After pristine electrode modification with THC or CBD, no substantial variations were evidenced in the high-resolution C 1s signals for the other four samples (Fig. 2b and c and S2, Table S6†).
O, respectively.30,31 After pristine electrode modification with THC or CBD, no substantial variations were evidenced in the high-resolution C 1s signals for the other four samples (Fig. 2b and c and S2, Table S6†).
On the other hand, two contributions were observed in the O 1s spectra of all the samples. In the case of pristine modification, the first contribution at 532.5 eV was assigned to C![[double bond, length as m-dash]](https://www.rsc.org/images/entities/char_e001.gif) O.30 The second peak was observed at higher binding energy, recorded at 533.5 eV for aromatic O*–(C
O.30 The second peak was observed at higher binding energy, recorded at 533.5 eV for aromatic O*–(C![[double bond, length as m-dash]](https://www.rsc.org/images/entities/char_e001.gif) O)–C/C–O (Fig. 2e, Table S7†).29 The O 1s for modified sensors showed a small shift (0.2–0.3 eV) to lower binding energy for the first contribution (Fig. 2f and g and S2; Table S7†). This might suggest slight changes in the O environment after pristine modification.
O)–C/C–O (Fig. 2e, Table S7†).29 The O 1s for modified sensors showed a small shift (0.2–0.3 eV) to lower binding energy for the first contribution (Fig. 2f and g and S2; Table S7†). This might suggest slight changes in the O environment after pristine modification.
For the specific case of electrode modification with THC, a decrease and an increase of atomic percent for the first and second contributions, respectively, were observed in the O 1s fit when the modifier molecule was deposited onto the surface of the electrode (m-Z-THC0) (Fig. 2h). After SWV analysis of m-Z-THC0, the atomic percent of the C![[double bond, length as m-dash]](https://www.rsc.org/images/entities/char_e001.gif) O contribution increased; meanwhile, a decrease for O*–(C
O contribution increased; meanwhile, a decrease for O*–(C![[double bond, length as m-dash]](https://www.rsc.org/images/entities/char_e001.gif) O)–C/C–O was evidenced. These changes are related to the oxidation of the OH group to the quinones in the THC structure, which appears at 532.2 eV (C
O)–C/C–O was evidenced. These changes are related to the oxidation of the OH group to the quinones in the THC structure, which appears at 532.2 eV (C![[double bond, length as m-dash]](https://www.rsc.org/images/entities/char_e001.gif) O, first contribution).
O, first contribution).
A similar behaviour was evidenced for m-Z-CBD, where the atomic percent for the first peak of the O 1s fit in m-Z-CBD was found to be lower than in m-Z-THC and higher for the second peak. Additionally, the difference between both contributions in the m-Z-CBD sensor was significantly smaller than in the case of m-Z-THC because the CBD molecule has two OH groups present in the structure. However, one of these OH groups does not participate in the oxidation process. The XPS results corroborated that the element oxygen plays a substantial role in the electrochemical oxidation of THC and CBD molecules on the surface of the working electrode. Furthermore, the oxidation of OH groups in the modifier molecules to quinones after SWV of deposited electrodes with possible dimer and polymer formation was also confirmed.
3.2. Traditional analysis of the sensor performance
Considering previous studies, saliva viscosity and natural conformation disturbed the electrode performance controlled by adsorption processes. In this sense, electroactive molecules, proteins such as mucin, or supernatant solids should be eliminated to decrease the variability among the results. It is important to mention that the THC concentration must be invariant in all processes. For this reason, an optimization of the saliva collection and filtration process was required. Table 1 summarizes the values of THC recoveries in saliva samples after being collected or filtered and quantified using the ELISA THC Oral Fluid Kit Product from Neogen Corporation.
| Filtersa | Collectors | ||
|---|---|---|---|
| Type–diameter–pore size | THC recovery (%) | Type | THC recovery (%) |
| a PTFE – polytetrafluoroethylene, PES – polyethersulfone, PVDF – polyvinylidene, wwPTFE – water wettable polytetrafluoroethylene. | |||
| PTFE–25 mm–0.2 μm | 0 | PureSal/filtration (swab + squeeze) | 7 (±13) |
| PES–25 mm–0.2 μm | 0 | NeoSal (swab + buffer) 1![[thin space (1/6-em)]](https://www.rsc.org/images/entities/char_2009.gif) : :![[thin space (1/6-em)]](https://www.rsc.org/images/entities/char_2009.gif) 4 4 |
16 (±5) |
| PVDF–25 mm–0.2 μm | 0 | SalivaBio swab (swab + squeeze) | 84 (±24) |
| Nylon–25 mm–0.2 μm | 0 | SalivaBio swab + pure Sal filter | 72 (±20) |
| Nylon–25 mm–0.45 μm | 0 | POREX OFCD-100 (no filter) | 94 (±3) |
| Nylon–13 mm–0.45 um | 7 (±7) | POREX OFCD-201-SRF (with filter) | 64 (±3) |
| wwPTFE NanoSEP–0.2 μm | 9 (±16) | POREX OFCD-100 + glass wool | 75 (±5) |
| wwPTFE NanoSEP–0.45 μm | 0 | POREX OFCD-100 swab + glass wool | 75 (±5) |
| wwPTFE-13 mm–0.45 μm | 0 | Centrifuged | 91 (±19) |
| wwPTFE–13 mm–0.2 μm | 76 (±20) | N/A | N/A |
| wwPTFE–25 mm–0.2 um | 64 (±7) | N/A | N/A |
| Glass wool (Pyrex 3950) | 76 (±5) | N/A | N/A |
Some collection or filtration systems provided high values of recoveries; however, they also presented some disadvantages. For example, the wwPTFE filter (0.2 μm) and POREX OFCD-201-SRF (with filter) helped clean the saliva but showed low volume recoveries. SalivaBio and POREX OFCD-100 were unsuccessful in cleaning, providing almost raw saliva. In contrast, the PureSal product was successful in cleaning the saliva; however, it resulted in a loss of THC in the swab. The SalivaBio Swab + PureSal filter interacted with the samples, leading to electrochemical interferences and a strong signal around 0.4 V, like THC. Lastly, the POREX OFCD-100 + glass wool successfully cleaned the saliva but was difficult to squeeze, compromising the volume recovery.
The best collection/filtration solution was the combination of the swab of the collector OFCD-100 and post-filtration using glass wool (Pyrex 9350). In this case, such a combination cleans the saliva samples, presents suitable volume recovery, and has no electrochemical interference. From this point, all experiments were performed using this strategy.
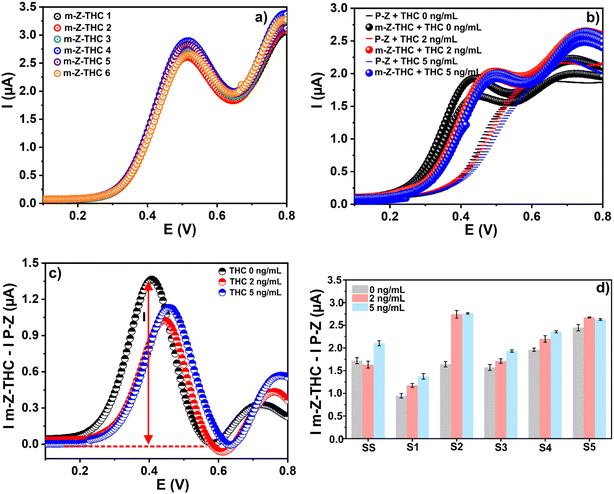
However, even after cleaning the saliva, there were inconsistencies in the results when comparing the current values of the same concentration but in different individual samples. For example, in Fig. 3d, the results show inconsistencies and unclear tendencies while testing different concentrations of THC.
3.3. CBD and THC as interferences of the THC and CBD electrochemical sensors
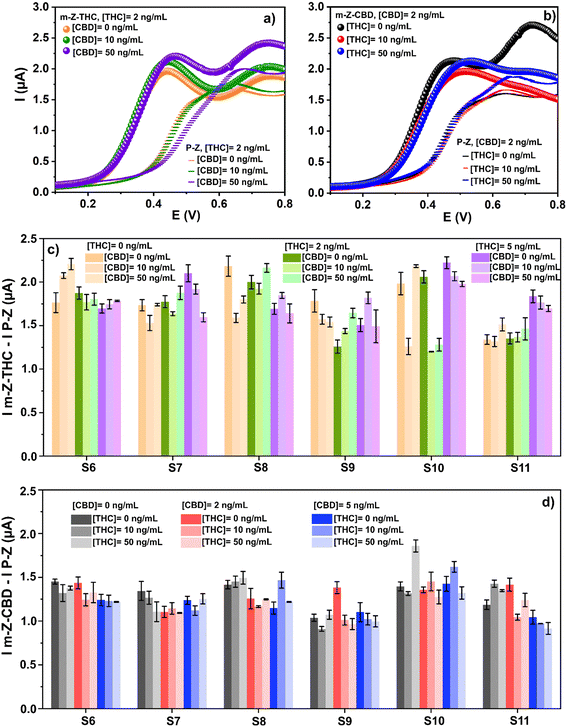
The selectivity of the designed sensors was evaluated through the effect of CBD (THC) molecules in the determination of THC (CBD). The impact of CBD on THC detection was studied employing the m-Z-THC sensor, and the effect of THC using the m-Z-CBD sensor when CBD was detected. Fig. 5a illustrates an example of the raw data in detecting THC (2 ng mL−1) in the presence of different amounts of CBD (0, 10, and 50 ng mL−1) using the m-Z-THC sensor. After the analyses, three well-defined peaks appeared between 0.4 and 0.6 V. Furthermore, a shift to higher potential values was observed when 50 ng mL−1 CBD was employed as an interferent.As shown in Fig. 1, the peak for CBD appears at higher potential values compared to THC signals when the electrochemical oxidation of these molecules is carried out; therefore, the presence of CBD in the sample can provoke the change observed in the THC signal potential. Similar signals are observed when THC is present during CBD detection using m-Z-CBD (Fig. 5b). In this case, the three peaks evidenced after analyses appear between 0.4 and 0.6 V. However, the peaks observed when THC was employed as an interferent were broader, and a shift in the potential was observed for both interfering concentrations (10 and 50 ng mL−1). This shift was more significant when 50 ng mL−1 THC was employed.
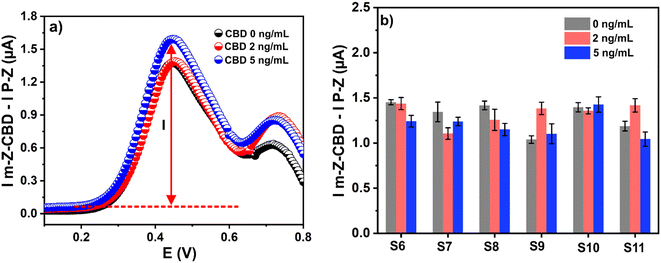
In this research, six samples from different healthy co-workers were employed in the experiments. Fig. 5c shows the results of THC detection in the presence of CBD using the m-Z-THC sensor. However, as can be seen, the signals cannot be differentiated when the sample is analyzed with a different amount of the target analyte and interfering molecule. A similar behaviour is observed when the m-Z-CBD sensor is employed for CBD detection in the presence of THC concentrations (Fig. 5d). The similarities in the chemical structures of THC and CBD and the saliva-to-saliva variation (person-to-person variation) are the two principal factors that lead to the inability to differentiate between the signals obtained from the different performed experiments. However, the influence of these two factors on the final results can be corrected using machine learning.
3.4. Machine learning algorithms
Moreover, proper selection of signal features can play a critical role in the success of a ML model. As a result, ML techniques were trained with only statistical features of signals, including the maximum, minimum, distance between the maximum and the minimum, mean, variance, skewness, and kurtosis or the entire signal (Fig. 3c). Different dimensionality reduction techniques were used on the whole signal. Furthermore, the effect of feature scaling on ML techniques was studied. The datasets for all techniques were split into training and testing.
The best scenario using statistical features resulted in an accuracy of 100% in training and a poor accuracy of 60% in testing. The norm in most literature studies using training ML techniques only on statistical features is deemed unsuccessful. For this reason, instead of using statistical features, the mentioned RF, SVM, and ANN techniques were applied to the entire signal (Table 2).
| Model | Preprocessing | Number of principal components | Train | Test | |||
|---|---|---|---|---|---|---|---|
| THC | CBD | m-Z-THC | m-Z-CBD | m-Z-THC | m-Z-CBD | ||
| RF | — | — | — | 100 | 100 | 76 | 65 |
| RF | — | 12 | 7 | 100 | 100 | 92 | 84 |
| SVM | StandardScaler | — | — | 78 | 75 | 56 | 62 |
| SVM | — | 18 | 7 | 83 | 78 | 76 | 62 |
| SVM | PowerTransformer | 8 | 5 | 99 | 92 | 84 | 78 |
| ANN | — | — | — | 82 | 88 | 68 | 68 |
| ANN | StandardScaler | — | — | 93 | 94 | 83.5 | 70 |
The results demonstrate significant improvements in the accuracy of ML techniques with dimensionality reduction and preprocessing. A complex dataset with many features is often susceptible to overfitting and sparsity, where training instances are not distributed uniformly across all dimensions. This indicates that the dataset can be transferred to a lower-dimension space with minimal information leakage (less than 2%). A scatter plot visualizes the relationship of the first two principal components for the multi-classification of CBD for a sample dataset (Fig. 6).
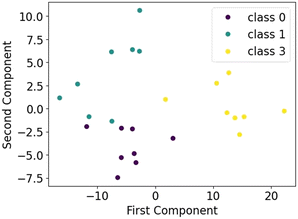 | ||
| Fig. 6 Distribution of the first and second principal components for a ternary classification of CBD. | ||
Dimensionality reduction techniques scale down the impact of noise and redundant features, consequently increasing the accuracy. SVM and ANN methods are sensitive to the scale of features and distances between instances. As a result, feature rescaling can improve the performance of the models.
Overall, the RF model with dimensionality reduction outperforms SVM and ANN. This result can be explained based on the nature of the RF technique as an ensemble machine-learning technique. It combines various rule-based decision trees on a random subset of the entire data, where each tree is trained on a random set of features. This randomness curbs the overfitting problem of the decision tree. Moreover, RF is a rule-based technique and is less sensitive to feature scaling. It should be noted that variations in signal shapes represent mainly saliva variation.
Table 3 summarizes the accuracy of each model in training and testing THC and CBD samples interrogated with m-Z-THC and m-Z-CBD and in the presence of cross-interference CBD and THC, respectively. The ML techniques were used to identify signals with interference (class 1) versus signals without interference (class 2). The results demonstrate the superiority of the SVM method over other classification techniques. The entire signal features were used for training and preprocessing, including applying dimensionality reduction on datasets before training for all methods except the decision tree.
| Technique | m-Z-THC | m-Z-CBD | ||
|---|---|---|---|---|
| Training (%) | Testing (%) | Training (%) | Testing (%) | |
| Logistic regression | 70 | 70 | 68 | 70 |
| Decision tree | 70 | 72 | 66 | 63 |
| Support vector machine | 95 | 90 | 96 | 93 |
The SVM model was used to classify the concentration class of the target sensor in the presence of THC/CBD. Table 4 summarizes the accuracy of results for training and testing datasets for both sensors. The results prove the capability of the SVM method to identify the class in the presence of an interferent.
| Sensor | Training (%) | Testing (%) |
|---|---|---|
| m-Z-THC | 96 | 77 |
| m-Z-CBD | 96 | 72 |
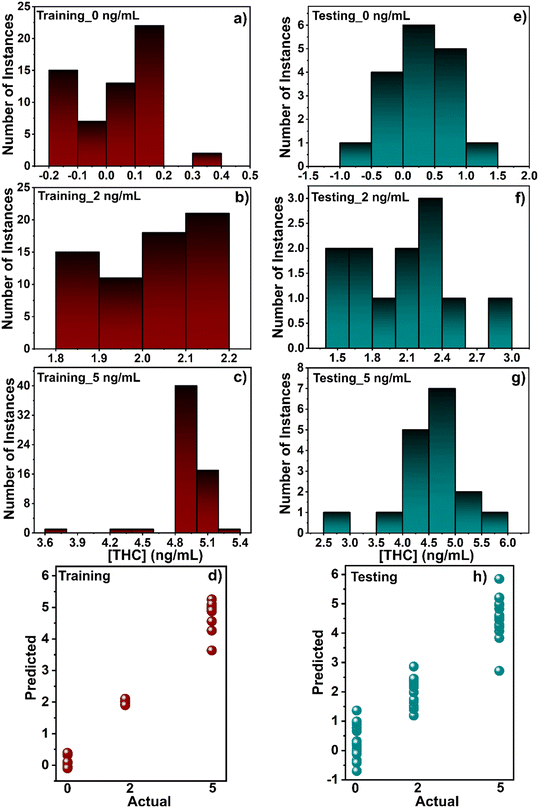
Finally, an SVM regression model was deployed to predict the exact concentration of THC in the presence of CBD. Fig. 7 shows a histogram of predicted results per class for training and testing sets. The result is auspicious despite being trained by discrete values and not continuous concentration values. However, since regression does not meet the high standard for accuracies in real THC testing (higher than 90%), it was discarded as a viable option for CBD, and instead, only the SVM classification method was pursued. Although this article presents robust classification results, further work is needed to develop a reliable regression model.
4. Conclusions
This work presented electrochemical-based sensors coupled with machine learning analysis for the ultra-low detection of THC or CBD in real saliva samples in the absence or presence of CBD or THC as an interferent. Due to variations in person-to-person saliva and potential CBD/THC interferences, the traditional analysis of calibration curves by plotting analyte concentrations versus response current values led to unacceptable results. Therefore, ML algorithms were introduced to analyze the datasets to overcome these setbacks. Overall, the classification of THC (CBD) samples with 0, 2, and 5 ng mL−1 presented the best performance, with accuracies approaching 92% and 83% for testing when using RF. In addition, the results proved the capability of ML techniques for identifying the presence of the CBD or THC interference with accuracies of 90–93% and multi-classification with accuracies of 72–77% using SVM.Ethical statement
All experiments were performed in accordance with the Institution Guidelines, and approved by the ethics committee at McMaster University. Informed consents were obtained from human participants of this study.Data availability
While we are committed to transparency and publishing the details of the method used in this work, we are constrained by a patent proprietary agreement to publish raw data and code.Conflicts of interest
There are no conflicts to declare.Acknowledgements
The authors would like to acknowledge the support of Collaborative Research and Development Grants from the Natural Sciences and Engineering Research Council of Canada, Mitacs, and eye3Concepts Inc. for funding this research.References
- M. Klimuntowski, M. M. Alam, G. Singh and M. M. R. Howlader, ACS Sens., 2020, 5, 620–636 CrossRef CAS.
- G. Pearlson, Weed Sci., 2020, 246–260 Search PubMed.
- G. A. Ortega, S. R. Ahmed, S. K. Tuteja, S. Srinivasan and A. R. Rajabzadeh, Talanta, 2022, 236, 122863 CrossRef CAS PubMed.
- V. Ramzy and R. Priefer, Talanta, 2021, 222, 121528 CrossRef CAS PubMed.
- M. A. Balbino, I. C. Eleotério, L. S. De Oliveira, M. M. T. De Menezes, J. F. De Andrade, A. J. Ipólito and M. F. De Oliveiraa, J. Braz. Chem. Soc., 2014, 25, 589–596 CAS.
- T. Pholsiri, A. Lomae, K. Pungjunun, S. Vimolmangkang, W. Siangproh and O. Chailapakul, Sens. Actuators, B, 2022, 355, 131353 CrossRef CAS.
- B. Zanfrognini, L. Pigani and C. Zanardi, J. Solid State Electrochem., 2020, 24, 2603–2616 CrossRef CAS.
- X. Tang, Y. Gu, P. Tang and L. Liu, Int. J. Electrochem. Sci., 2022, 17, 220562 CrossRef CAS.
- H. Luo, L. X. Chen, Q. M. Ge, M. Liu, Z. Tao, Y. H. Zhou and H. Cong, J. Inclusion Phenom. Macrocyclic Chem., 2019, 95, 171–198 CrossRef CAS.
- A. Khoobi, N. Soltani and M. Aghaei, J. Alloys Compd., 2020, 831, 154715 CrossRef CAS.
- R. G. Rocha, J. S. Stefano, I. V. S. Arantes, M. M. A. C. Ribeiro, M. H. P. Santana, E. M. Richter and R. A. A. Munoz, Electroanalysis, 2019, 31, 153–159 CrossRef CAS.
- A. Gomez Cardoso, S. Rahin Ahmed, Z. Keshavarz-Motamed, S. Srinivasan and A. Reza Rajabzadeh, Bioelectrochemistry, 2023, 152, 108440 CrossRef CAS PubMed.
- A. G. Cardoso, H. Viltres, G. A. Ortega, V. Phung, R. Grewal, H. Mozaffari, S. R. Ahmed, A. R. Rajabzadeh and S. Srinivasan, TrAC, Trends Anal. Chem., 2023, 160, 116965 CrossRef CAS.
- K. Ngamchuea, C. Batchelor-McAuley and R. G. Compton, Sens. Actuators, B, 2018, 262, 404–410 CrossRef CAS.
- C. Pezzo, Hands-On Machine Learning with Scikit-Learn & TensorFlow, 2017 Search PubMed.
- M. Mohri, A. Rostamizadeh and A. Talwalkar, Foundations of Machine Learning, 2nd edn, 2012 Search PubMed.
- Y. Nakano, T. Takeshita, N. Kamio, S. Shiota, Y. Shibata, N. Suzuki, M. Yoneda, T. Hirofuji and Y. Yamashita, Artif. Intell. Med., 2014, 60, 97–101 CrossRef PubMed.
- Ö. B. Mercan, V. Kılıç and M. Şen, Sens. Actuators, B, 2021, 329, 129037 CrossRef.
- A. Carrio, C. Sampedro, J. L. Sanchez-Lopez, M. Pimienta and P. Campoy, Sensors, 2015, 15, 29569–29593 CrossRef.
- P. C. Riley and S. V. Deshpande, Machine learning based spectral interpretation in chemical detection, Proc. SPIE 11006, Artificial Intelligence and Machine Learning for Multi-Domain Operations Applications, 10 May 2019, p. 110061X, DOI:10.1117/12.2518929.
- D. Ding, S. Han, H. Zhang, Y. He and Y. Li, Comput. Biol. Chem., 2019, 83, 107106 CrossRef CAS.
- M. Sánchez-Brito, F. J. Luna-Rosas, R. Mendoza-González, M. M. Mata-Miranda, J. C. Martínez-Romo and G. J. Vázquez-Zapién, Talanta, 2021, 221, 121650 CrossRef.
- M. Ghassemi, S. Barzegari, P. Hajian, H. Zham, H. R. Mirzaei and F. H. Shirazi, J. Mol. Struct., 2021, 1229, 129493 CrossRef.
- P. Puthongkham, S. Wirojsaengthong and A. Suea-Ngam, Analyst, 2021, 146, 6351–6364 RSC.
- I. Strauss, G. Valle, F. Artoni, E. D'Anna, G. Granata, R. Di Iorio, D. Guiraud, T. Stieglitz, P. M. Rossini, S. Raspopovic, F. M. Petrini and S. Micera, Sci. Rep., 2019, 9, 1–11 CrossRef PubMed.
- S. I. Hwang, N. G. Franconi, M. A. Rothfuss, K. N. Bocan, L. Bian, D. L. White, S. C. Burkert, R. W. Euler, B. J. Sopher, M. L. Vinay, E. Sejdic and A. Star, ACS Sens., 2019, 4, 2084–2093 CrossRef CAS PubMed.
- Z. Rao, B. Guo, J. Zu, W. Zheng and Y. Zu, IEEE Sens. J., 2024, 24, 7463–7472 CAS.
- D. Caprioglio, D. Mattoteia, O. Taglialatela-Scafati, E. Muñoz and G. Appendino, Biomolecules, 2021, 11, 991 CrossRef CAS.
- H. Hantsche, Adv. Mater., 1993, 5, 778 CrossRef.
- M. Biesninger, X-ray Photoelectron Spectroscopy (XPS) Reference Pages, (accessed 28 September 2023).
- H. Viltres, O. F. Odio, M. C. Biesinger, G. Montiel, R. Borja and E. Reguera, ChemistrySelect, 2020, 5, 4875–4884 CrossRef CAS.
Footnotes |
| † Electronic supplementary information (ESI) available. See DOI: https://doi.org/10.1039/d4sd00102h |
| ‡ G. Ortega and H. Viltres have equal contribution as first author. |
| This journal is © The Royal Society of Chemistry 2024 |

