DOI:
10.1039/D4SD00169A
(Paper)
Sens. Diagn., 2024,
3, 1285-1297
A highly selective chromo-fluorogenic probe for specific detection of sarin gas simulant diethylchlorophosphate in liquid and vapor phases†
Received
22nd May 2024
, Accepted 21st June 2024
First published on 26th June 2024
Abstract
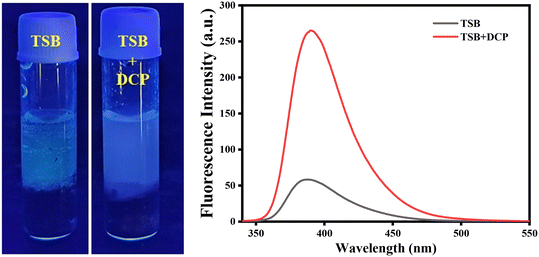
Among the various organophosphorus-based chemical warfare agents, nerve agents pose severe threats to national defense and public safety. Among them, sarin gas is a severe one that has been employed in various terrorist activities recently. The development of chromo-fluorogenic probes for their detection is still in its infancy. Aiming in this direction, the present article introduces a highly selective and specific chromo-fluorogenic probe, (E)-3-(((4-(benzo[d]oxazol-2-yl)phenyl)imino)methyl)-2-methoxy-2H-chromen-4-ol (TSB) embracing chromone and benzoxazole moieties, for the recognition of diethyl chlorophosphate (DCP), a sarin gas surrogate, in both gaseous and solution phases, respectively. Upon adding DCP to the TSB solution in pure DMSO and 50% v/v water–DMSO mixture, there is an observable change from very pale yellow to colorless. Additionally, there is a transition from no fluorescence to intense blue-violet photoluminescence enhancement under exposure to a 365 nm UV lamp. These optical signals are found to be due to the development of phosphorylated TSB–DCP products, inhibiting intramolecular charge transfer (ICT) and the excited state intramolecular proton transfer (ESIPT) mechanism involved in TSB. The developed sensor demonstrated the ability to detect DCP even in the presence of various other challenging guest analytes, achieving a recognition and quantification limit in the μM range. Furthermore, to achieve on-site detection of DCP and investigate the practical utility of the developed probe, we have demonstrated the use of a paper strip-based test kit, the “dip-stick” method, and, notably, conducted real sample analysis on spiked soil samples.
1. Introduction
Recognition of trace chemical warfare agents (CWAs) has gained increasing attention in recent years, driven by the rising frequency of terrorist incidents worldwide. Specifically, nerve agents such as sarin, soman, and tabun, which inhibit the enzyme acetylcholinesterase, pose significant threats to public security and can lead to deadly consequences.1–3 For example, in 1995 terrorists used the infamous colorless sarin gas on the Tokyo subway, resulting in over 5000 injuries and 13 people dying.4 While traditional detection methods like mass spectrometry,5 surface acoustic waves,6 enzyme-based biosensors,7 electrochemical methods,8–12 and ion mobility spectroscopy13 have been employed for sensing nerve agents, there is an urgent requirement for a detection method that is both rapid and reliable, with heightened sensitivity. Chromo-fluorogenic sensing emerges as an ideal recognition method for nerve agents, offering features such as visualization, quick response time, high sensitivity, and the convenience of a portable testing gadget.14
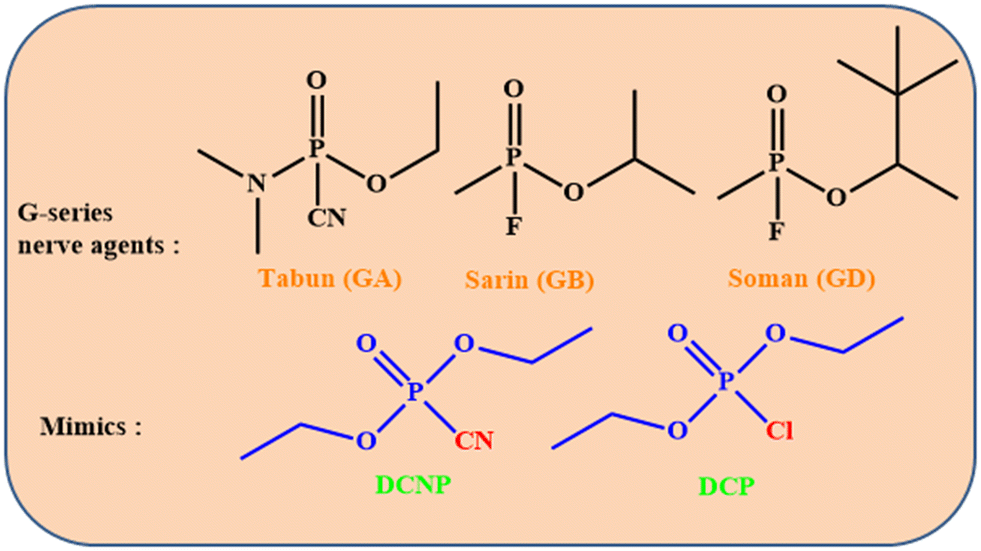
Due to their highly poisonous nature, strict control measures have been implemented for sarin and other nerve agents. The low toxicity and similar reactivity (Scheme 1) of diethylchlorophosphate (DCP) with nerve agents led to its widespread use in libraries as a sarin mimic.15,16 To date, a considerable number of smart fluorescent probes have been devised for the detection of DCP.17,18 Among these, several typical structures, including aliphatic hydroxyl,19–21 pyridine,22,23 and hydroxyl oxime,24,25 are commonly incorporated into developed sensing materials due to their effective nucleophilicity towards electrophilic phosphorus atoms. Nevertheless, developing an effective fluorescent probe for the detection of DCP still encounters the following challenges: (i) many current fluorescent probes exhibit intricate structures, necessitating multi-step and expensive synthesis; (ii) while many probes concentrate solely on recognition in solution, the detection of gaseous DCP is less addressed, yet it holds greater practical value in applications; (iii) the majority of these probes function in a “turn-off” mechanism, making them susceptible to disruptions caused by photobleaching or conventional fluorescent quenchers. Conversely, a fluorescent probe that operates in a “turn-on” mechanism with zero background is more appealing. A turn-on fluorescent chemosensor is a dedicated chemical sensor that reveals a significant increase in fluorescence intensity upon binding or interacting with a particular analyte. These chemosensors are designed to detect and quantify the presence of particular molecules, ions, or environmental conditions by converting the recognition event into a quantifiable fluorescent signal. Turn-on fluorescent chemosensors signify a powerful and multipurpose class of analytical tools that offer high sensitivity, specificity, and proficiency for real-time and quantitative analysis. Their ability to provide a clear and enhanced signal upon analyte detection makes them crucial in various scientific and practical uses. Based on these considerations, there is a strong desire for a straightforward “turn-on” probe designed for detecting DCP vapor. The Schiff base provides an excellent structural framework for constructing fluorescent probes, owing to its ease of synthesis and straightforward derivatization. To date, the majority of fluorescent probes utilizing Schiff bases have been employed for the recognition of metal ions26,27 and anions.28,29 They are infrequently employed for the detection of small molecules. This is mainly attributed to the absence of appropriate recognition groups for the analyte molecule. Torroba et al. previously documented several turn-on fluorescent probes inclusive of amine groups for selective detection of chemical warfare agents.30 Vinod Kumar and co-workers reported many chromogenic and turn-on fluorogenic probes for the selective recognition of toxic nerve agents and sulfur mustard simulants.31–35 They introduced multiple sensing approaches for highly sensitive and selective recognition of sarin, tabun, and VX nerve agents. Wang et al. developed a colorimetric and fluorescence “turn-on” sensor based on isophorone for selective detection of nerve agent mimic DCP.36 Subsequently, they also developed a colorimetric, ratiometric sensor for quick detection of DCP with large emission spectral shift.37 Sfrazzetto and co-workers introduced a photoluminescence sensor array for the recognition of toxic nerve agent mimics.38 Also, they reported the detection of nerve agent simulants based on supramolecular detection by a smartphone tool.39 Jiang et al. developed also a turn-on fluorogenic sensor for on-spot recognition of nerve agents mimicking DCP.40 While there are various chromo-fluorogenic sensors developed so far for the recognition of DCP, detecting sarin in real threatening situations is still challenging. The heightened volatility of sarin makes it less amenable to capture by chromo-fluorophore moieties. Thus it is quite challenging to develop high-performance chromo-fluorogenic sensors for sarin detection which necessitates a molecular-level designing strategy that focuses on the judicious selection of suitable recognition units and signaling motifs.
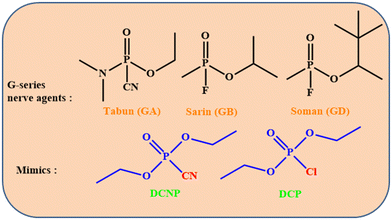 |
| | Scheme 1 Structural information of G-series nerve agents and mimics. | |
Based on the aforementioned discussion, we have introduced a chromo-fluorogenic sensor, (E)-3-(((4-(benzo[d]oxazol-2-yl)phenyl)imino)methyl)-2-methoxy-2H-chromen-4-ol denoted as TSB, designed for the discerning and precise recognition of the surrogate DCP, a potent stand-in for the lethal sarin gas based on intramolecular charge transfer (ICT) and excited state intramolecular proton transfer (ESIPT) mechanism. We synthesized the probe TSBvia a simple condensation procedure involving 2-(4-aminophenyl)benzoxazole and 3-formylchromone. Because of its fascinating photophysical characteristics, the parent benzoxazole moiety serves as a responsive unit component in the development of the present chemosensor, enabling the sensitive and focused identification and measurement of G-series nerve agent mimics, DCP.41 To find DCP vapor in an in situ setting, a paper strip-based test kit was fabricated and a “dip-stick” test was carried out. As a real-world application, on-spot soil investigation stands out as an effective and practical implementation of TSB, which has been effectively validated. In the current probe, a hydroxyl functional group is generated from a solvent-mediated in situ reaction which participates in an ESIPT process that is inhibited due to the phosphorylation process. As a consequence, a significant photoluminescence enhancement is observed in the presence of DCP. The present work will pave the way for how an –OH functional group could be generated within the core of probe threading with the signaling moiety from a non-functional one for fine-tuning the photophysical process. Hence, it is significant that the present article proposes a new approach utilizing a familiar fluorogenic probe to develop a highly active chromo-fluorogenic sensor proficient in identifying and quantifying these lethal agents while revealing its mechanistic features.
2. Experimental sections
2.1. Materials and instruments
Detailed information regarding the materials and instruments employed in the current study is available in the ESI.†
2.2. Synthesis procedure for TSB and characterization
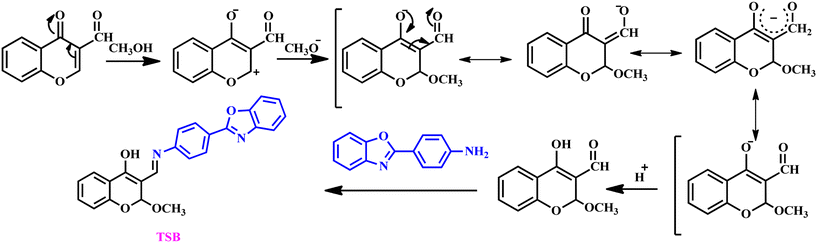
We employed 2-(4-aminophenyl)benzoxazole as the starting material for preparing our sensor TSB, which was synthesized (Scheme S1†) following a published procedure.41 Our sensor TSB was synthesized via a convenient and handy reaction between 2-(4-aminophenyl)benzoxazole and 3-formyl chromone, employing acetic acid in a catalytic quantity. First of all, 50 mg (0.2871 mmol) of 3-formyl chromone was taken in a round bottom (RB) flask, and dissolved in 3 mL of methanol. The reaction mixture was allowed to react for an hour with constant stirring. An in situ nucleophilic substitution reaction occurs via the solvent42 resulting in an –OH functional group in the starting material, which is also reflected in the current literature report. Then, 60.4 mg (0.2871 mmol) of 2-(4-aminophenyl)benzoxazole was added to the stirring solution. The solution of the reaction mixture was stirred at 30 °C for 6 hours (Scheme 2). A bright yellow-colored precipitate was observed and allowed to cool to room temperature. The precipitate was filtered and washed with hot methanol many times, dried at a 60 °C hot air oven, and the resulting product was collected into a glass vial. Yield = 85%. The collected product is characterized by various conventional analytical methods.
 |
| | Scheme 2 Synthetic path of our developed sensor TSB. | |
Characterization.
1H NMR (400 MHz, δ, ppm in DMSO-d6): 11.88 (d, 1H), 8.26 (d, 1H), 8.21 (d, 2H), 7.87 (d, 2H), 7.80 (d, 2H), 7.78 (d, 2H), 7.63 (d, 2H), 7.58 (m, 2H), 7.16 (d,1H), 5.87 (s, 1H), 3.40 (s, 3H) (Fig. S1†), IR spectra: 3425 cm−1 (–OH), 2923 cm−1 (–N![[double bond, length as m-dash]](https://www.rsc.org/images/entities/char_e001.gif) C–H), 2855 cm−1 (–O–CH3) (Fig. S2†) and from high-resolution mass spectral analysis m/z is established to be 399.135 (Fig. S3†) (TSB + H+, calculated 399.138) which confirms the formation of our probe TSB.
C–H), 2855 cm−1 (–O–CH3) (Fig. S2†) and from high-resolution mass spectral analysis m/z is established to be 399.135 (Fig. S3†) (TSB + H+, calculated 399.138) which confirms the formation of our probe TSB.
2.3. Estimation of quantum yield
We have determined the photoluminescence quantum yield of both the probe TSB and its phosphorylated TSB using the given equation employing quinine sulfate as a standard one in 1(N) H2SO4 (Φ = 0.546):
Here, x and s imply the unknown and standard solutions, respectively. Additionally, Φ denotes the quantum yield, F stands for the integrated area under the fluorescence spectra, A denotes absorbance and η signifies the refractive index of the solvent. Using the above-mentioned equation, the calculated quantum yields for TSB and TSB–DCP are found to be 0.2588 and 1.0636, respectively.
3. Results and discussion
3.1. UV-visible spectrophotometric investigation
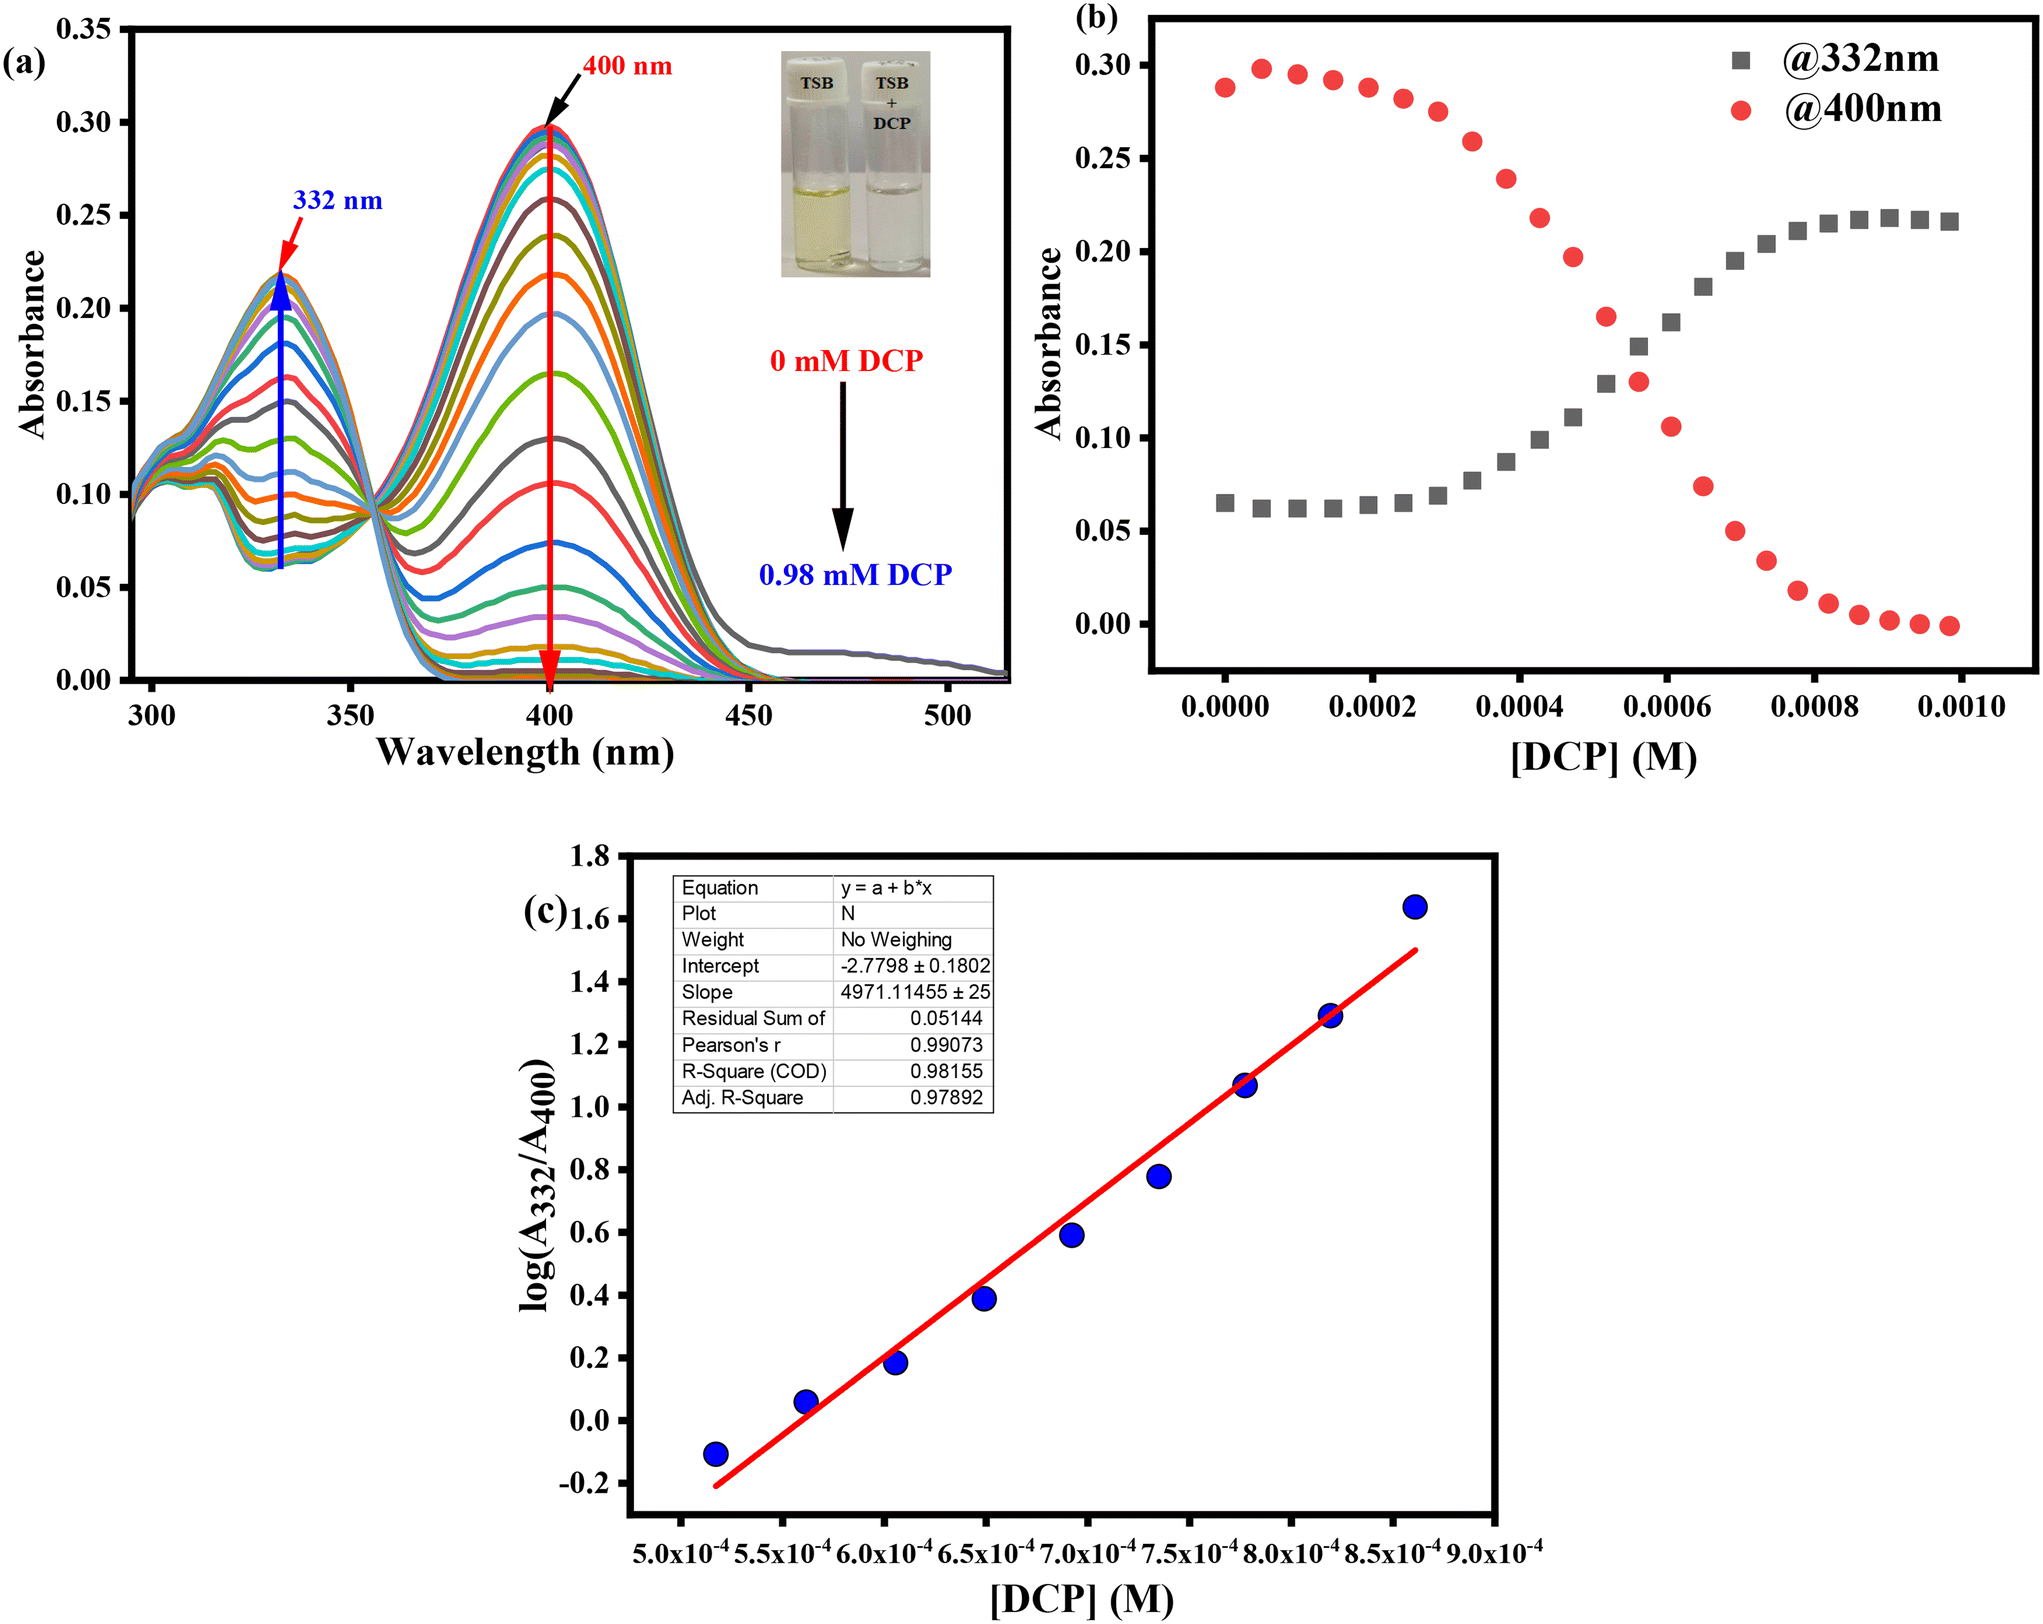
The UV-visible spectrophotometric experiment for TSB was performed in DMSO medium, with the presence of several organophosphates (OPs), inorganic phosphates (IPs), and other potentially harmful guest analytes. To achieve this, stock solutions of our developed probe TSB and all OPs, IPs, and other detrimental invitee analytes were prepared in DMSO medium. In every study, newly prepared TSB along with all OPs, IPs, and other harmful guest analytes was used to prevent any unpredicted errors. Among various OPs, IPs, and other analytes, only the sarin simulant DCP suggestively alters the TSB spectrum profile, resulting in a visible color alteration from pale yellow to colorless. In pure DMSO medium, the newly prepared TSB solution (1.01 × 10⁵ M) shows a spectral band spanning from 330 nm to 500 nm, accompanied by a pale yellow color noticeable to the bare eye in daylight, attributed to the intramolecular charge transfer (ICT) intrinsic to the TSB probe. As DCP is steadily introduced into the TSB solution at concentrations ranging from 0 to 0.98 mM, the peak absorbance at 400 nm reduces concurrently, while a new peak appears at 332 nm, and its intensity increases correspondingly with the increasing concentration of DCP (Fig. 1a). An evident isosbestic point around 356 nm signifies the formation of the TSB-DCP phosphorylation product, leading to a visible color change from light yellow to colorless, noticeable to the naked eye (inset Fig. 1a). This color variation is attributed to the inhibition of the ICT process associated with our probe, TSB. Throughout the accumulation of DCP, Fig. 1b demonstrates the change in absorption intensity at 400 and 332 nm, while a ratiometric linear calibration curve (Fig. 1c) has been constructed to accurately quantify the sarin mimic DCP, diminishing experimental error. Furthermore, a parallel investigation was conducted in an aqueous DMSO medium (50% water–DMSO mixture, v/v), as illustrated in Fig. S4a.† Following the addition of 0 to 77.9 mM DCP to the TSB solution, there was a notable change in absorbance intensity at 400 nm and 330 nm, alongside a distinct isosbestic point at 354 nm. The ratiometric linear calibration curve of log(A326/A390) vs. [DCP] for measuring DCP with negligible experimental error is depicted in Fig. S4b and c,† respectively.
 |
| | Fig. 1 (a) UV-visible spectrophotometric titration spectra of TSB (1.01 × 10⁻⁵ M) upon gradual introduction of DCP (0–0.98 mM) in pure DMSO medium, (b) the variation in absorbance values at wavelengths 332 nm and 400 nm was observed with increasing concentration of DCP, and (c) the ratiometric calibration curve of [DCP] vs. log(A332/A400) exactly quantifies the unknown [DCP] with minimum experimental error. | |
Furthermore, we have carried out selectivity studies with adding 0.98 mM of every competitor analyte such as tetraisopropylmethylenediphosphonate (TIMEP), benzyl bromide (BB), diethylcyanophosphonate (DCNP), trisodiumphosphate (Na3PO4), triethylphosphate (TEP), acetic acid (CH3COOH), disodiumphosphate (Na2HPO4), tris(2-chloroethyl)phosphate (T2CEP), triethyl amine (TEA), dimethyl methylphosphate (DMMP), 2-chloroethyl phenyl sulfide (2CEPS), thioacetic acid (TAA), benzyl acetone (BA), hydrochloric acid (HCl), trimethylphosphate (TMP), monosodiumphosphate (NaH2PO4), chloroethyl ethyl sulfide (2CEES), and mercaptoethanol (MCE) under comparable experimental conditions in pure DMSO medium. Interestingly, the presence of any harmful guest analyte does not disturb the UV-visible absorption spectral profile of the TSB probe solution except for Na3PO4 and Na2HPO4 (Fig. 2a); we can also see from the bar diagram of selectivity at 332 nm that any harmful guest analyte does not affect (Fig. 2b) the UV-visible absorption spectrum. Similarly, from the selectivity studies also performed in an aqueous DMSO mixture (50% v/v) we can observe the same result in which any harmful guest analyte does not disturb the UV-visible absorption spectrum profile (Fig. S5†). From this experiment, we can conclude that our developed sensor selectively detects sarin mimic DCP through the formation of phosphorylated product TSB-DCP following inhibition of the ICT mechanistic process of the sensor, resulting in color changes from pale yellow to colorless (Scheme S2†).
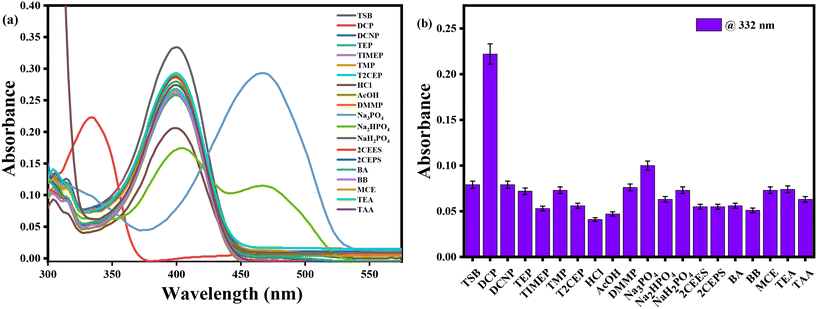 |
| | Fig. 2 (a) Selectivity spectrum profile of sensor TSB with various target analytes in pure DMSO, and (b) corresponding selectivity bar diagram at 332 nm. | |
3.2. Fluorometric investigation
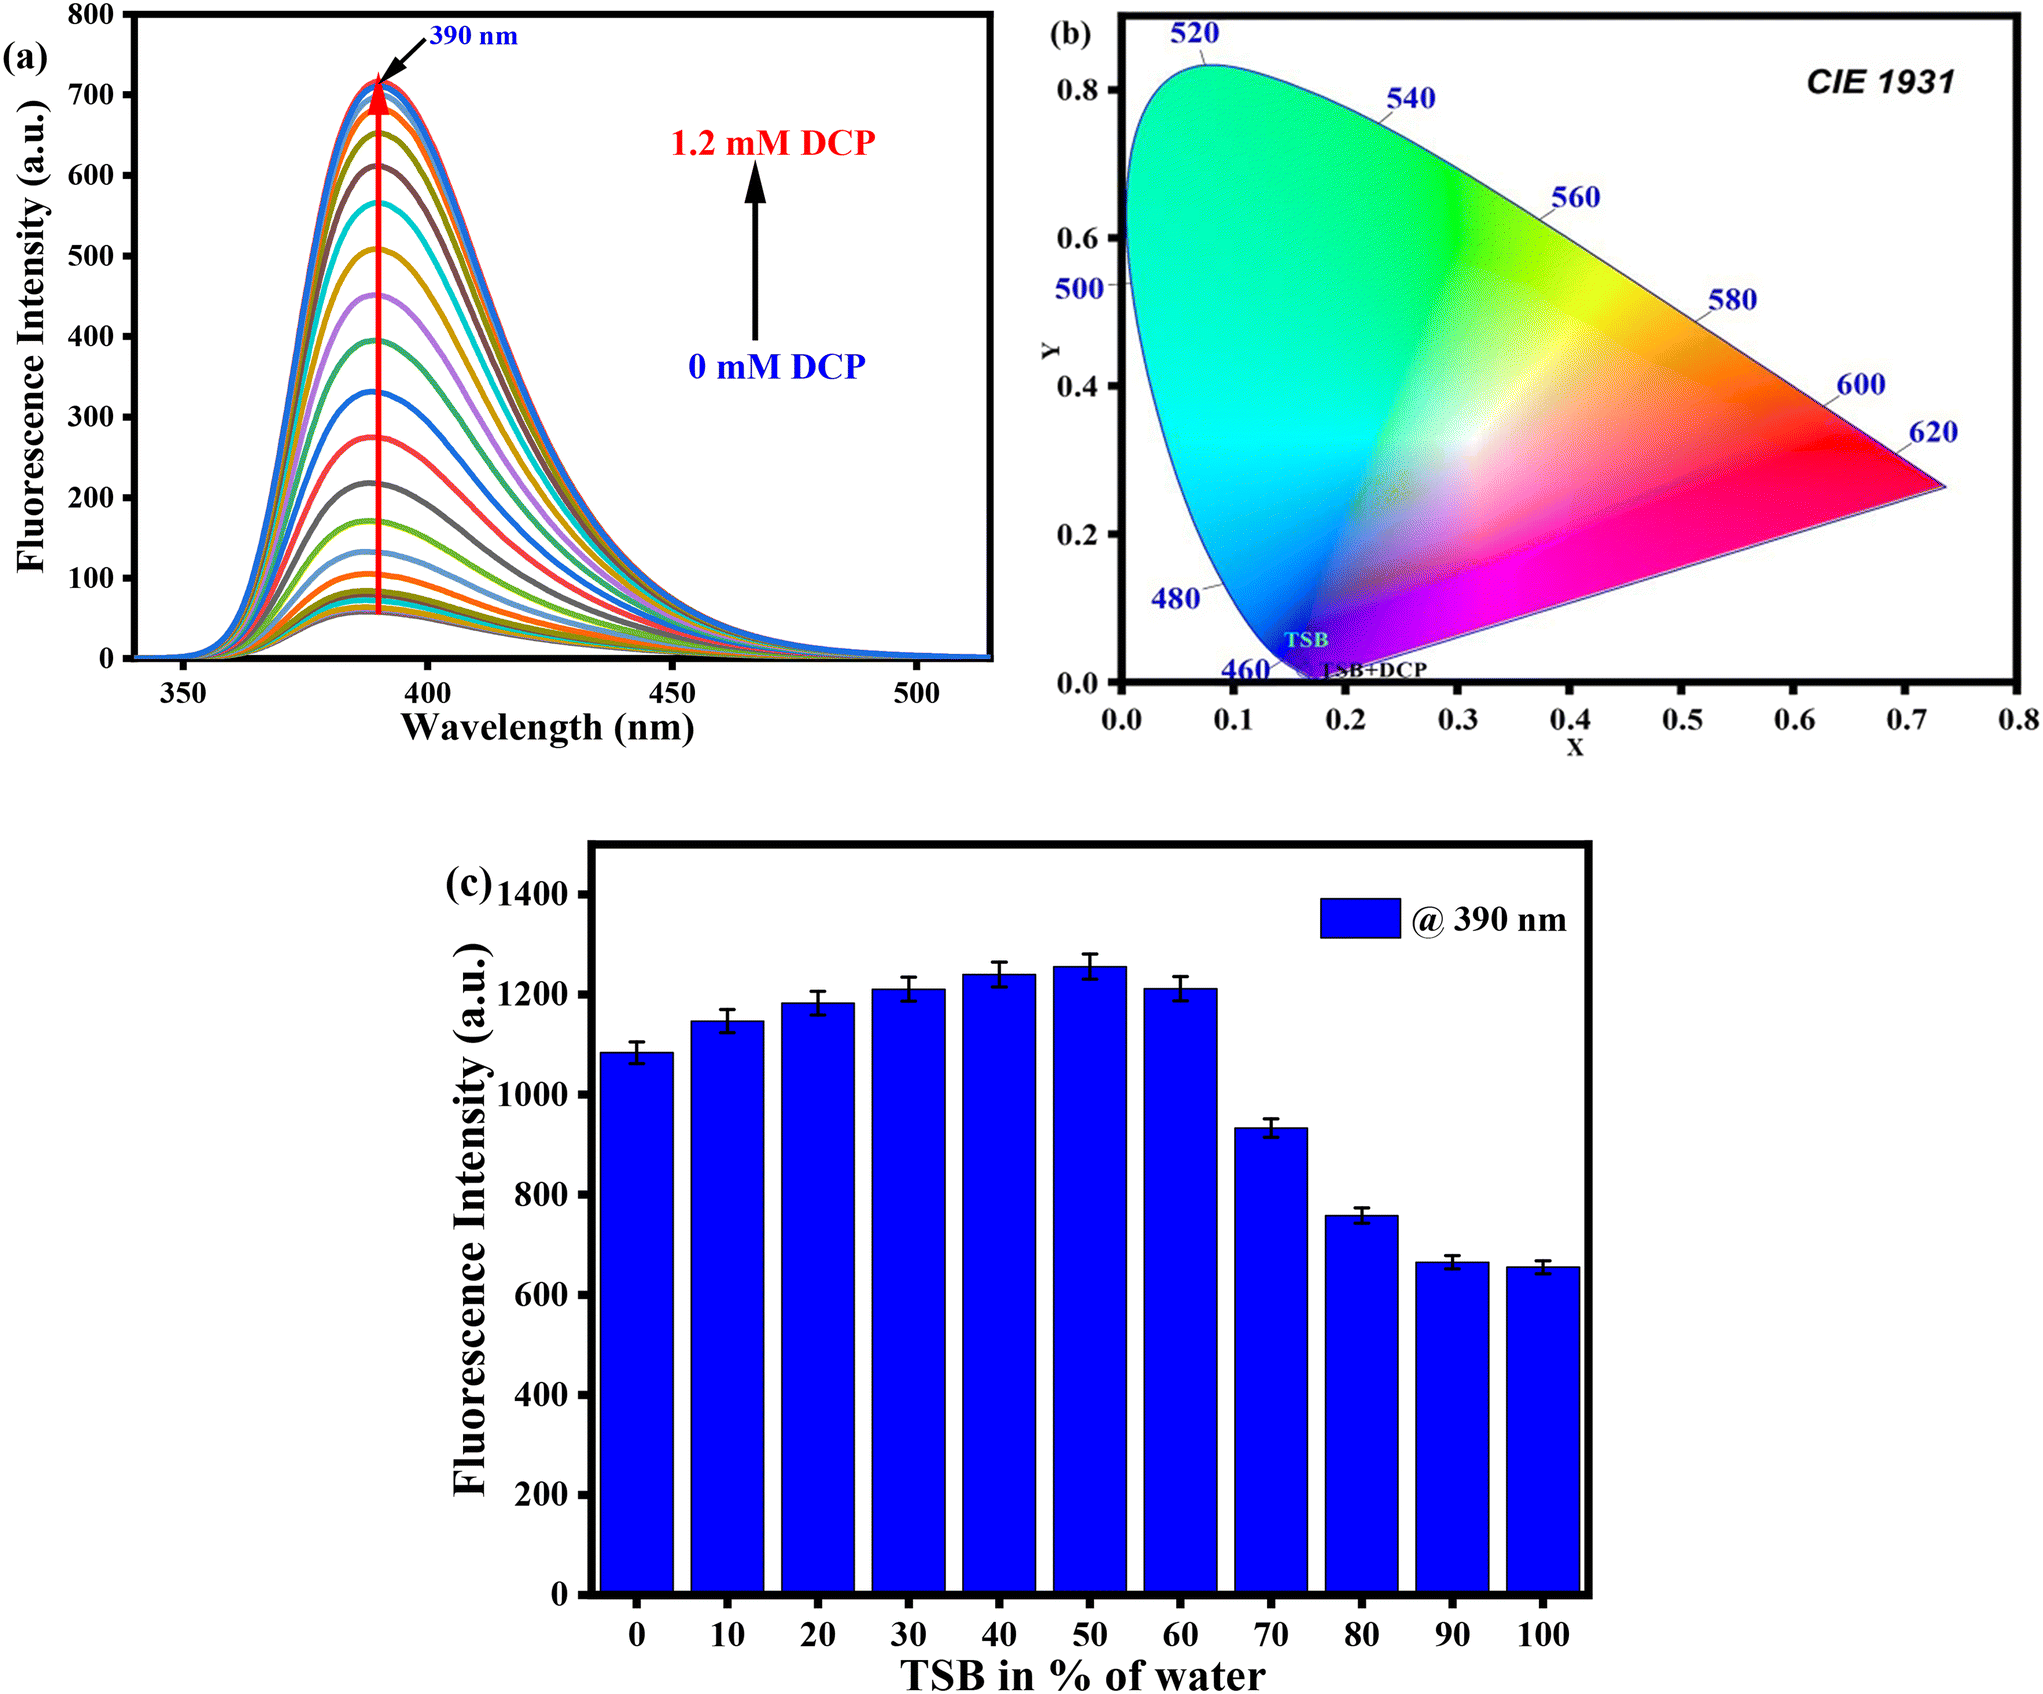
Recently, fluorogenic chemosensors have become suggestively more favored over other sensors because of their high sensitivity, portability, straightforward operational procedures, displayability, and rapid responsiveness to common harmful target analytes. Given the prominent benefits of this sensor type, we have conducted a fluorescence experiment using our developed TSB sensor with various analogous analytes in DMSO medium. In the absence of any toxic analyte, the probe solution showed a very weak intensity at λmax = 390 nm in pure DMSO medium. With the steady introduction of the sarin mimic DCP, a well-known toxic nerve agent, into the TSB solution, the initially weak-intensity band intensified by a factor of 12. Upon reaching a concentration of 1.2 mM of the target analyte DCP, the band became saturated, transitioning from a non-fluorescent state to a vibrant blue-violet fluorescence under the illumination of a 365 nm UV lamp (Fig. 3a). For a deeper exploration of its appropriateness in biological sample investigation, we conducted measurements of the photoluminescence intensity of TSB in the transition from a non-aqueous to an aqueous medium, in the presence of the sarin substitute DCP. Surprisingly, noticeable fluorescence enhancement was observed in aqueous medium up to 50%, attributable to the form of the protonated TSB–hydrochloride salt. Hence, we performed a parallel fluorescence titration experiment under ambient situations in an aqueous DMSO medium (50% water v/v). Upon the addition of 78 μM of DCP, the photoluminescence intensity exhibited 12-fold enhancement at λmax = 392 nm (Fig. S6a†). As a result, the CIE diagram exhibits the conversion in fluorescent color, shifting from non-fluorogenic to a vivid blue-violet in TSB solution after the introduction of sarin mimic DCP, initially observed in pure DMSO (Fig. 3b), and subsequently in aqueous medium (Fig. S6b†), respectively.
 |
| | Fig. 3 (a) Fluorimetric titration spectra of probe TSB solution by gradual addition of toxic analyte DCP (0 to 1.2 mM) in pure DMSO medium. (b) Corresponding CIE diagram of fluorometric color change. (c) Fluorescence intensity enhancement of TSB in various percentages of water at 390 nm. | |
Notably, there were no discernible significant alterations observed in the emission spectrum profile of the TSB solution when other competitive toxic guest analytes were introduced (Fig. 4 and S7†). The increased emission intensity observed upon the addition of DCP to the TSB solution is attributed to the formation of the potent phosphorylation product TSB–DCP. This enhancement is attributed to the suppression of ICT and ESIPT processes (Scheme S2†). We concluded from this investigation that our developed sensor TSB selectively identified sarin mimic DCP through the form of the phosphorylated TSB–DCP product following inhibition of the ESIPT mechanism of the sensor, as a result we observed a change from non-fluorescence to highly intense blue-violet fluorescence.
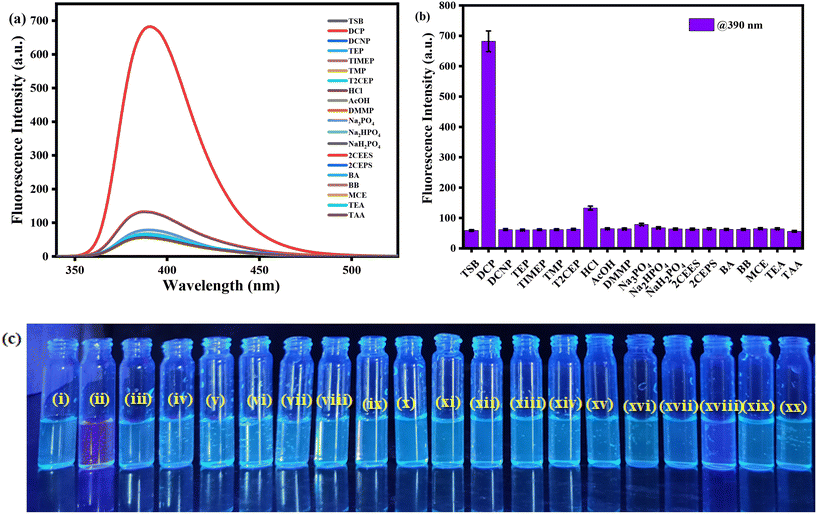 |
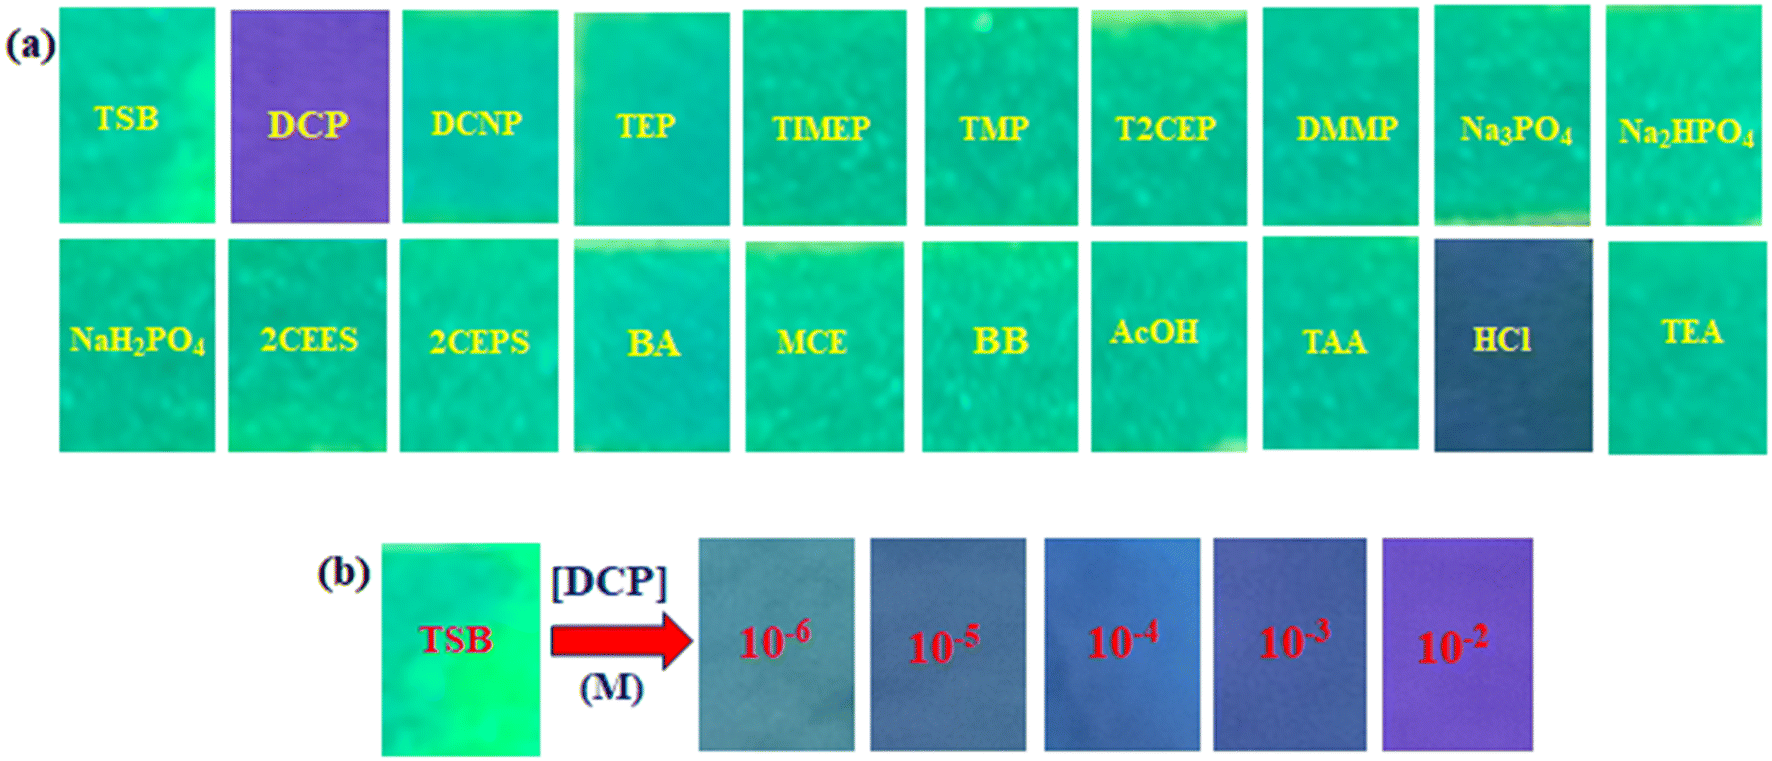
| | Fig. 4 (a) Selectivity emission spectra of our developed sensor TSB with various toxic analytes in pure DMSO. (b) Corresponding selectivity bar diagram at 390 nm. (c) The pictorial represents selectivity experiments of sensor TSB against several toxic analytes under UV light (365 nm) irradiation. (i) = TSB, (ii) = DCP, (iii) = TEP, (iv) = DCNP, (v) = TMP, (vi) = TIMEP, (vii) = T2CEP, (viii) = AcOH, (ix) = Na3PO4, (x) = DMMP, (xi) = Na2HPO4, (xii) = 2CEES, (xiii) = NaH2PO4, (xiv) = 2CEPS, (xv) = BA, (xvi) = MCE, (xvii) = BB, (xviii) = HCl, (xix) = TEA, (xx) = TAA. | |
3.3. Detection mechanism
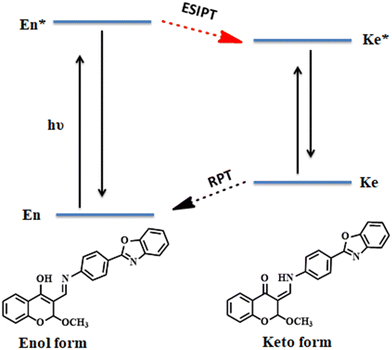
In our developed sensor TSB there are two active functional groups present, imine (–CHN–) and hydroxyl (–OH), and both are engaged in keto–enol tautomerism via transfer of proton. Upon excitation at 320 nm, the DMSO solution of TSB undergoes a rapid transformation of its excited-state enol form  to the excited-state keto form
  of TSB. The appearance of an emission band at 390 nm is attributed to the conversion of the excited-state keto form
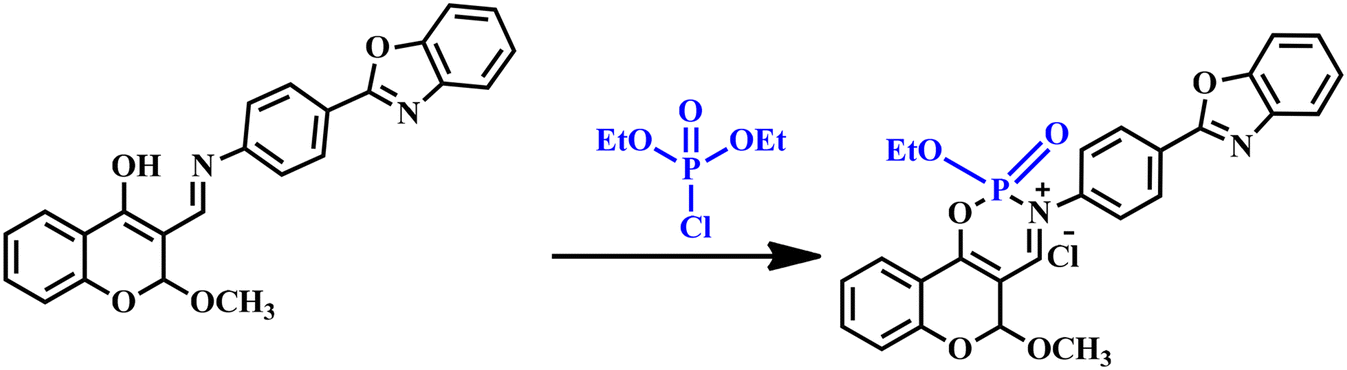
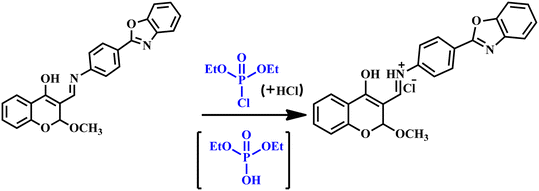
  to the ground-state keto form (Ke). While the enol form (En) exhibits superior stability at the ground state compared to Ke, the keto form reverts to Envia the reverse proton transfer (RPT) mechanism (Scheme 3). Sensor TSB demonstrates nucleophilic activities, while DCP features an electrophilic center at its phosphorus (P), which is enhanced by the presence of an excellent leaving –Cl group. Successively, the lone pair from the –OH functional group's oxygen atom and the lone pair from the –CHNH functional group's nitrogen atom in TSB both act as nucleophiles, attacking the electrophilic center phosphorous (P) of DCP. Consequently, the phosphorylated TSB–DCP product is produced via a 6-member ring-closing reaction, involving the elimination of –OEt and –Cl groups from DCP in a phosphorylation process (Scheme 4).
 |
| | Scheme 3 The graphical presentation of the ESIPT process involved in our developed TSB. | |
 |
| | Scheme 4 Plausible recognition mechanism of DCP sensing by developed TSB in pure DMSO medium. | |
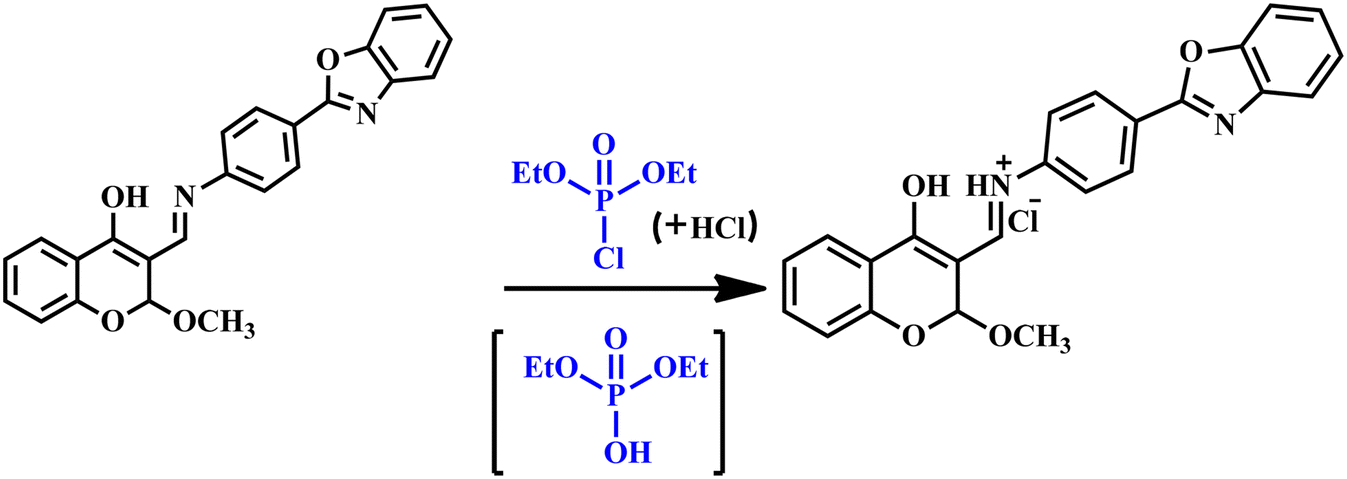
Contrastingly, when water is present, phosphorylated products tend to be relatively unstable, undergoing a catalytic hydrolysis process in its presence. This leads to their degradation into hydrosalt, with diethyl hydrogen phosphate (DHP) being left behind43,44 (Scheme 5). Hence, phosphorylation–protonation chemical reactions in the water result in the formation of protonated TSB-chloride salt. Intriguingly, the solubility of the product TSB increases as the protonated-TSB chloride salt forms within an aqueous–DMSO medium disrupting the ESIPT mechanism. Consequently, TSB promptly detects the sarin mimic DCP of G-series nerve agents in aqueous medium.
 |
| | Scheme 5 Plausible mechanism of DCP detection by developed TSB in 50% (v/v) water–DMSO medium. | |
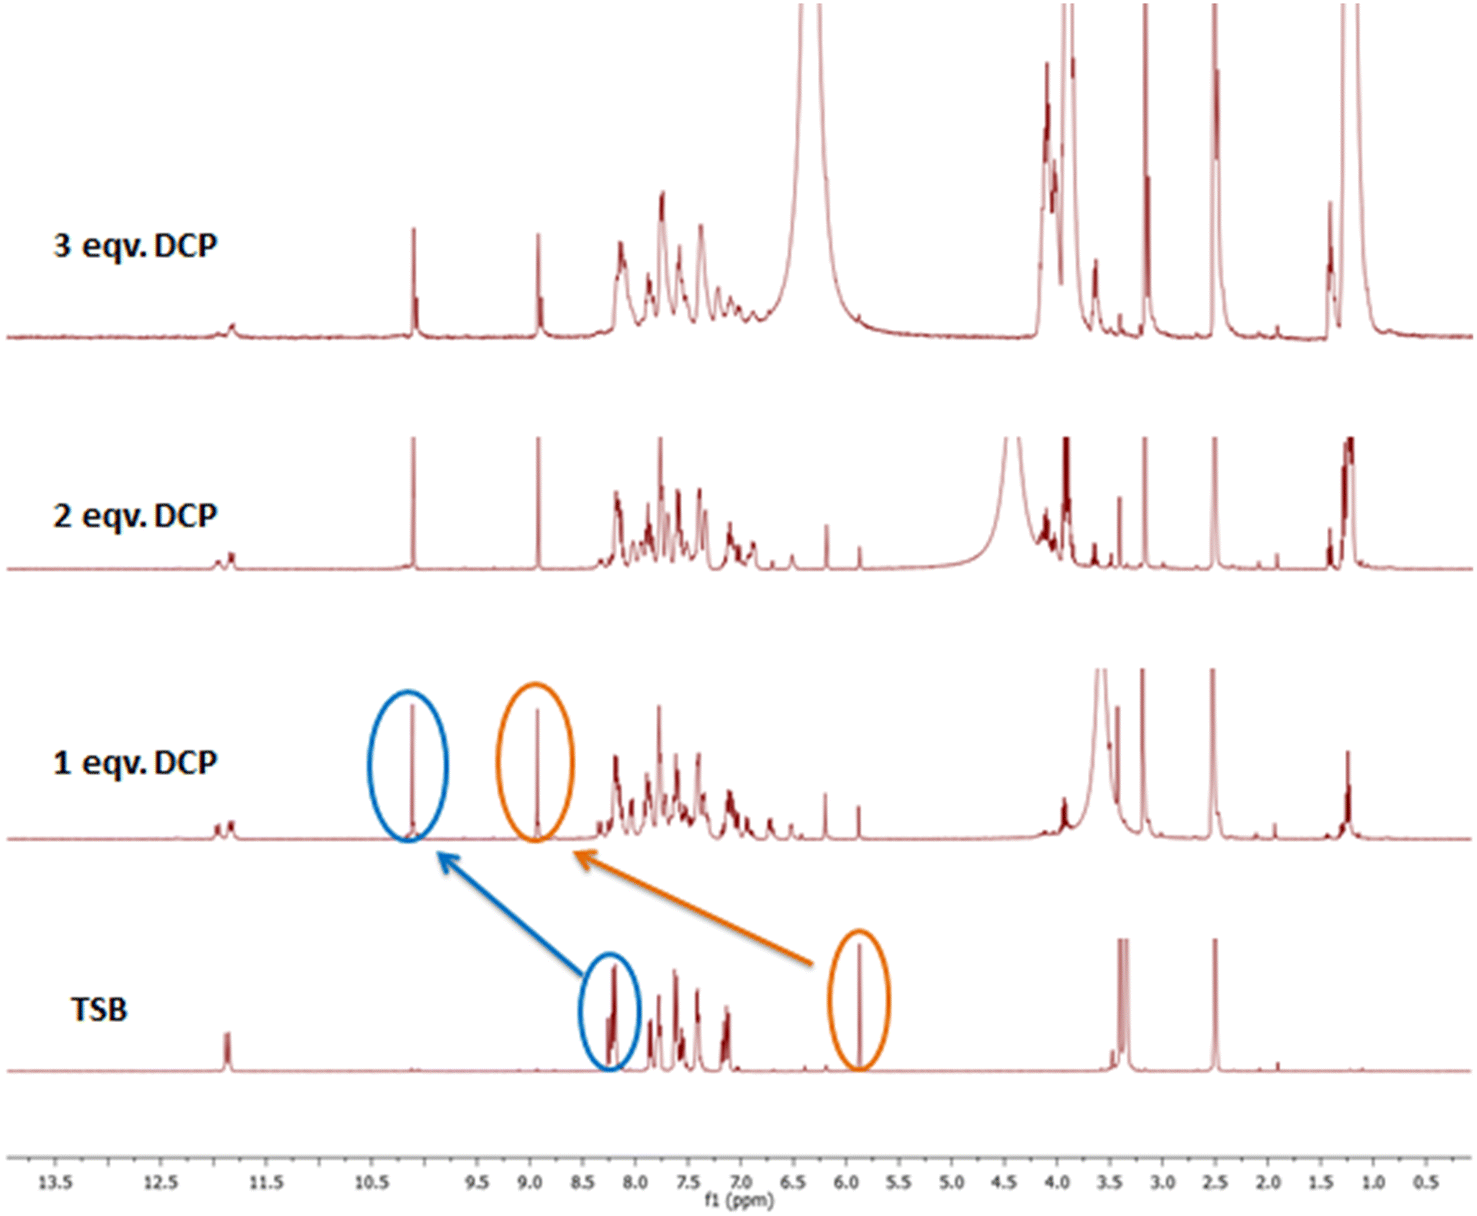
To elucidate the sensing mechanism, we additionally conducted the 1H NMR titration experiment of TSB pre and post-exposure to DCP (Fig. 5). In DMSO-d6 solvent, the 1H NMR spectrum of the non-phosphorylated TSB exhibits two peaks: one at 11.88 ppm for the –OH proton and another at 8.26 ppm for the imine (–CHN) functional group. Furthermore, a distinct sharp singlet peak at 5.87 ppm indicates the proton adjacent to the –OCH3 functional group. Remarkably, the peak at 11.88 ppm vanished due to the addition of 3 equivalents of DCP. As a result of the phosphorylation process, the peaks at 8.26 ppm and 5.87 ppm shifted further downfield, reaching around 10.25 ppm and 9 ppm, respectively. The experimental results obtained from the 1H NMR titration spectra specify the formation of phosphorylated products, specifically the development of six-membered TSB–DCP compounds. The formation of the TSB–DCP phosphorylated product has also been established by HRMS analysis (m/z = 525.0965) and 31P NMR spectroscopy which are provided in Fig. S8 and S9† respectively. From the 31P NMR spectrum we observed that DCP exhibits a singlet at −1.51 ppm, while a distinctive signal emerges at −1.40 ppm for the TSB–DCP product, indicating a chemical shift of −0.11 ppm and confirming the generation of the phosphorylated product mentioned earlier. ESIPT is entirely hindered by the lone pair on the imine (–CHN) functional group, which participates in a 6-member ring closure throughout the phosphorylation process. As a result, the fluorescence intensity of TSB significantly increases in the presence of DCP because of the disruption of the ESIPT process caused by the formation of phosphorylated TSB.
 |
| | Fig. 5
1H NMR titration of TSB with gradual addition of DCP. | |
3.4. Estimation of detection and quantification limits
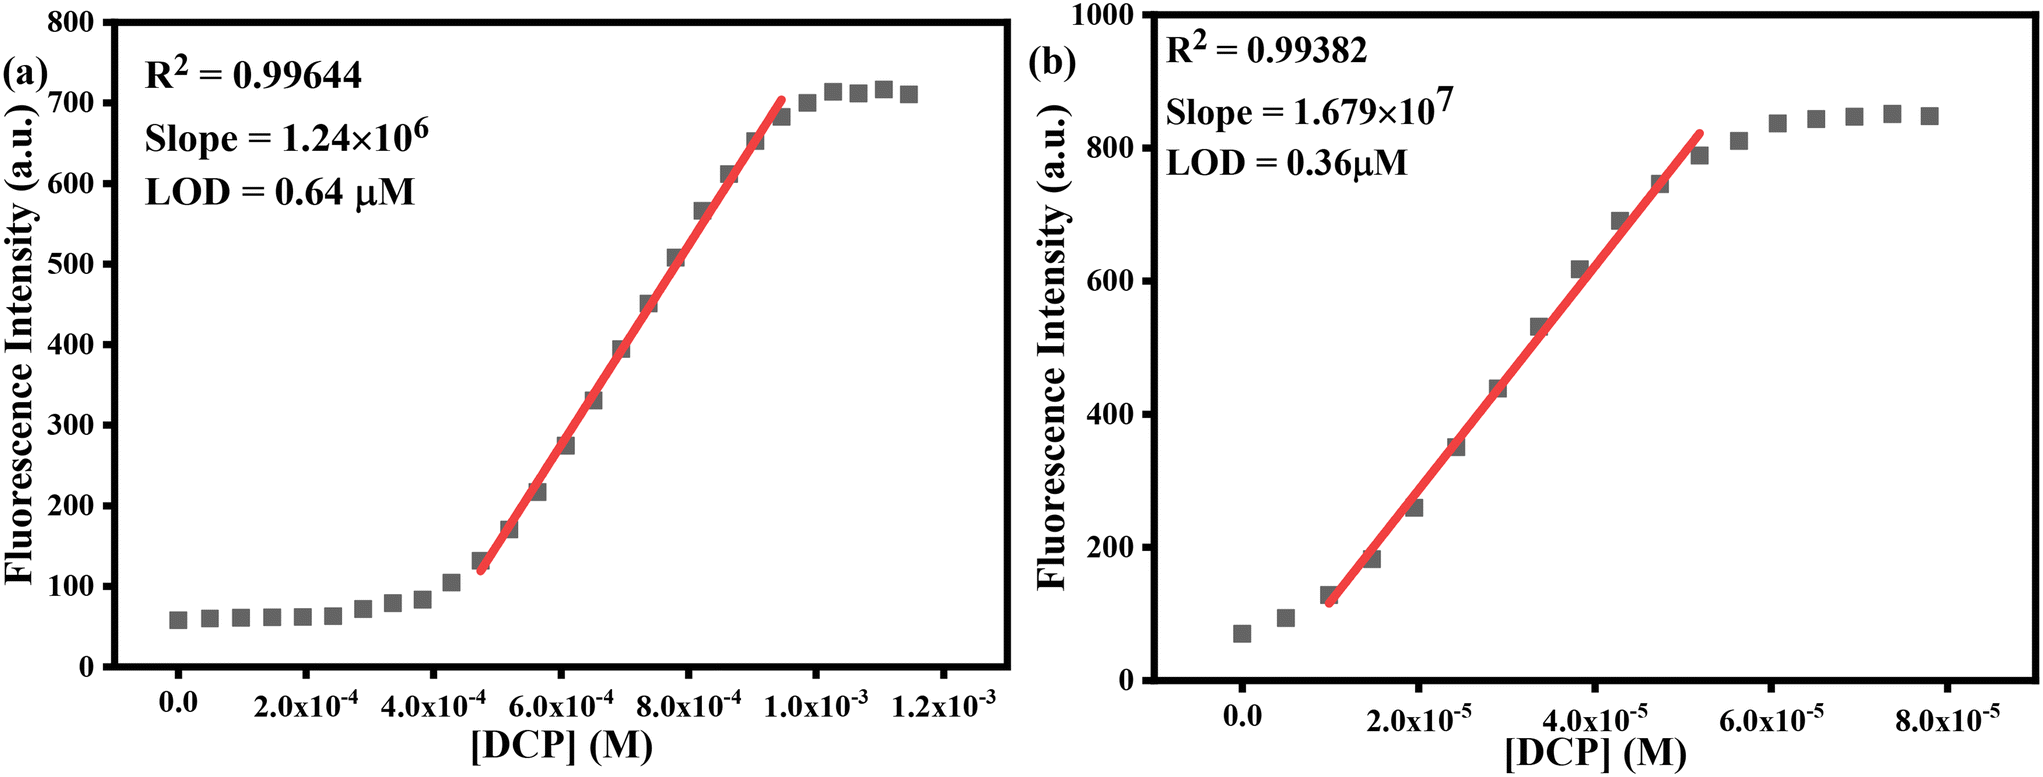
To ensure practical usability, chemosensors must possess high sensitivity for the selective recognition of target analytes. The detection limit (LOD) of any developed sensor holds significance in this context. To ascertain the LOD, we meticulously conducted fluorometric titration experiments involving TSB in pure DMSO and a parallel water mixture (50% (v/v) water–DMSO) in the presence of DCP. We have plotted the concentration of DCP against emission intensity at 390 nm for pure DMSO and 392 nm for aqueous medium resulting in a sigmoidal curve. Subsequently, we executed the linear fitting and obtained a standard linear calibration curve (Fig. 6) with a commendable R2 value of 0.9964 and 0.9938 for pure and aqueous mixtures, respectively. From this curve, the LOD was calculated employing the equation: LOD = 3σ/K, where σ is the standard deviation of the blank TSB solution, K represents the slope of [DCP] vs. fluorescence intensity plot and we got 1.24 × 10⁶ and 1.679 × 10⁷ for pure and aqueous medium, respectively. As a result, we've obtained the LOD values of 64 μM & 0.36 μM for pure DMSO and 50% DMSO–aqueous medium respectively, showcasing superior performance compared to several chemosensors documented in the previous literature (Table S1†). Further, the quantification limit (LOQ) is estimated employing the given equation, LOQ = 10σ/K, and the LOQ was found to be 2.13 μM and 1.20 μM respectively in pure DMSO and 50% DMSO–aqueous medium. Thus, our developed probe TSB successfully identified and quantified the nerve agent sarin gas simulant DCP within the micromolar (μM) concentration range.
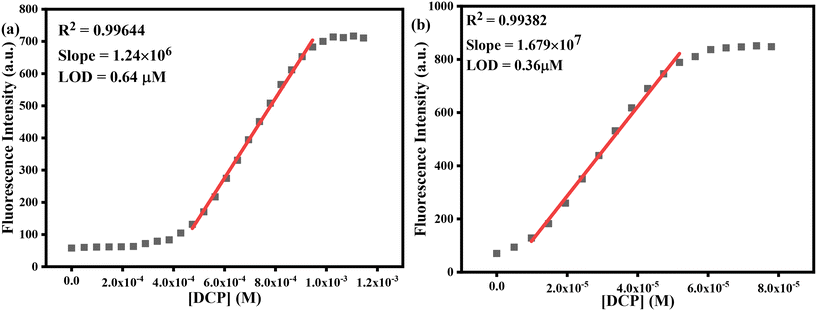 |
| | Fig. 6 Estimation of LOD and LOQ by plotting [DCP] vs. fluorescence intensity in (a) pure DMSO and (b) 50% (v/v) water–DMSO medium, respectively. | |
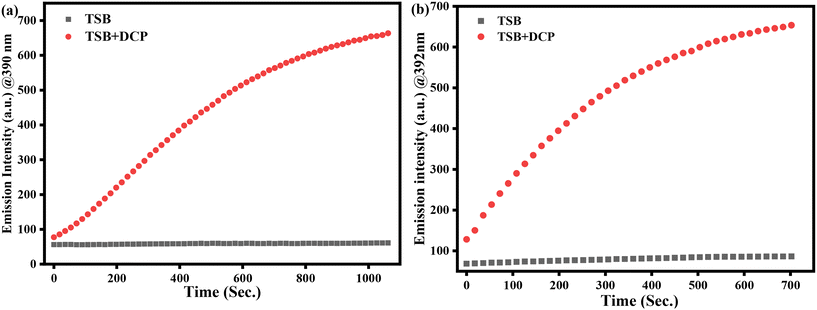
3.5. Response time investigation
Additionally, the swift fluorescence response of every chemosensor is mainly explicable by reaction time. In this instance, we have conducted fluorometric titration spectra profiling of TSB in DMSO and semi-aqueous media by incremental addition of 1.2 mM & 78 μM DCP at intervals of 0–18 and 0–12 minutes, respectively. The plot of emission intensity against time variation (Fig. 7) revealed that our sensor TSB swiftly detected the sarin simulant DCP, with the reaction completing within 9–12 minutes in pure DMSO and semi-aqueous medium, respectively. Following the accumulation of 1.2 mM & 78 μM DCP into the TSB solution, a visual observation with the bare eye indicated a transition from light-yellow to colorless over time, accompanied by the absence of fluorescence intensity to high-intensity blue-violet fluorescence under a 365 nm UV lamp. These findings recommend that the probe TSB is proficient in swiftly detecting the sarin mimic DCP, within the minimum time consumed, rendering it a highly proficient and promising tool for DCP detection.
 |
| | Fig. 7 Investigating the time-dependent enhancement of photoluminescence in (a) pure DMSO and (b) 50% (v/v) water–DMSO within a 0–18 minute timeframe for real-time monitoring of DCP. | |
The formation of the TSB–DCP product follows a pseudo-first-order kinetic rate. The rate constant (k′) has been calculated to be k′ = 0.0027 s−1 & 0.0043 s−1 for DMSO and water mixture respectively (Fig. S10†) employing the given equation:45
| ln[(Fmax − Ft)/Fmax] = −k′t |
Here,
Fmax and
Ft represent the emission intensity at 390 nm & 392 nm at time ‘
t’ and the maximum emission value achieved after the completion of the reaction.
k′ signifies the rate constant of the pseudo-first-order reaction.
3.6. Fabrication of paper strip for on-site detection
In recent times, the attractiveness of sensing research has surged due to the multipurpose applications of chemosensors, prompting the widespread implementation of cost-effective materials in the preparation of test kits. The need for sophisticated, expensive, deluxe equipment and time-consuming experimental protocols, which were the primary constraints on the usability of chemosensors, has been exterminated. The versatile application of colorimetric and fluorometric techniques as portable and displayable tools has driven the remarkable role currently fulfilled by superior paper strip-based test kits within the community of the sensing field. We have conducted a paper strip-based test kit experiment to assess the practical capability of our developed sensor, TSB, for real-time detection of sarin gas mimic DCP. Numerous identically-sized Whatman-41 filter papers are dipped in a 2 mM solution of TSB, left to dissolve in DMSO for a period, and then dried using an oven set at 60 °C temperature. The paper strips that have TSB coating exhibit a cyan-yellow color under a 365 nm UV lamp. However, upon exposure to a low concentration of sarin mimic DCP, the fabricated paper strip displays an intense blue-violet color under the irradiation of UV light (365 nm). It's noteworthy that, apart from the minor colorimetric swings observed with HCl, the cyan-yellow tint of the TSB-coated strips remains unaffected in the presence of other toxic guest analytes (Fig. 8a). This result suggests the remarkable sensitivity and selectivity of our sensor, TSB, in distinguishing DCP, even amidst minimal HCl interference. Further, we have explored the concentration-dependent fluorometric response of DCP to demonstrate the accurate quantification capability of our developed sensor TSB-coated paper strips. The experimentation is conducted across several DCP concentrations (10−6 to 10−2 M) to accomplish this goal. With increasing DCP concentration, the color of the TSB-coated paper strips shifted from light blue-violet to a deep, intense violet color (Fig. 8b) demonstrating its effectiveness in the quantification of DCP in the vapor state.
 |
| | Fig. 8 (a) Response of TSB-coated filter paper strips towards DCP and other analyte solutions was observed upon exposure to a 365 nm UV lamp. (b) Fluorimetric color change of TSB-coated test kits across numerous concentrations (10−6 M to 10−2 M) of DCP. | |
3.7. Detection of DCP in the vapor phase
The TSB probe exhibits an immediate chromo-fluorogenic reaction when exposed to the sarin mimic DCP, indicating its strong potential for distinguishing DCP solutions due to its excellent responsiveness. Identifying nerve agents like those of the G-series is within the capability of chemosensors in their liquid phase, but detecting them in vapor form poses greater complication and significance in real-world threat scenarios. It is vital because most DCP exposures stem from terrorist or inadvertent vapor releases. Utilizing a sarin simulator provides instant and conclusive proof of sarin gas presence, offering clear visual results without the need for expensive instrumental confirmation, thus providing a practical and uncomplicated method. We conducted a dip-stick analysis to assess the potential for developing a functional device proficient in detecting DCP fumes accurately. We have employed lengthy pieces of several filter papers (Whatman 41), immersed them in a 2 mM DMSO solution of TSB for our experimentation distinguishing gaseous phases. Subsequently, the TSB-coated paper strips were dried with the help of a heat gun at 60 °C temperature. Next, the dried filter papers are transferred to sealed glass vials, where they are exposed to the vapors of organophosphates and other potentially harmful analytes in parallel, as depicted in Fig. 9. Remarkably, sealed filter papers display a vibrant purple color in the presence of the lethal nerve agent sarin gas mimic DCP vapor, even at minimal concentrations, while other poisonous analytes retain their earlier color. Consequently, our developed TSB sensor could act as a specific DCP gas detector in the presence of various OPs, IPs, and other potentially hazardous guest analytes. We have performed experiments with DCP at varying concentrations, including 10−6 to 10−2 M, to detect mimics of sarin gas among nerve agents in the vapor phase. Upon contamination with DCP at concentrations ranging from low to high, the violet color of TSB-coated filter papers intensifies (Fig. 9b). Subsequently, dip vial conical flask experiments were conducted to recognize DCP in the gas phase, as this is essential for recognizing sarin gas in real-life threatening scenarios. To accomplish this, a glass vial has been positioned within a 50 ml conical flask, ensuring an airtight seal, and containing a solution of 2 mM TSB. The probe TSB displays cyan-yellowish color before the accumulation of DCP, as shown in Fig. 9c. However, due to the introduction of five drops of DCP into the vial, the probe solution undergoes a transformation from cyan-yellowish to blue-violet due to the vaporization of DCP (Fig. 9c).
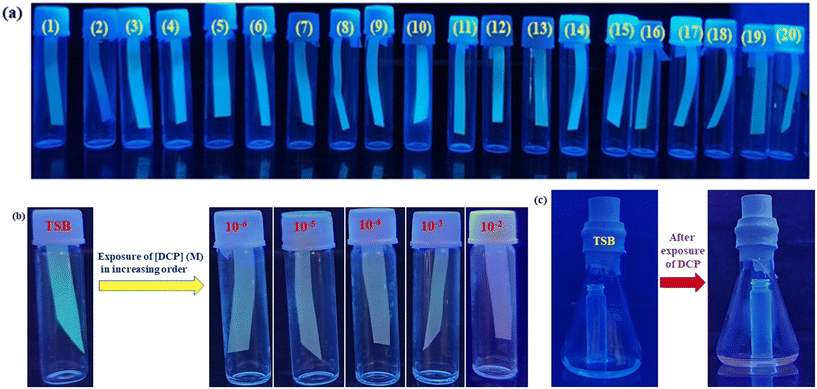 |
| | Fig. 9 (a) Vapour phase detection ability of our developed sensor TSB against various toxic analytes under UV light (365 nm) radiation. (1) = TSB, (2) = DCP, (3) = TEP, (4) = DCNP, (5) = TMP, (6) = TIMEP, (7) = T2CEP, (8) = AcOH, (9) = Na3PO4, (10) = DMMP, (11) = Na2HPO4, (12) = 2CEES, (13) = NaH2PO4, (14) = 2CEPS, (15) = BA, (16) = MCE, (17) = BB, (18) = TEA, (19) = HCl, (20) = TAA. (b) To check the lower level detection limit with various concentrations of DCP. (c) Dip-vial conical experiment for DCP vapor detection. | |
3.8. Detection application of TSB in many soil samples spiked with DCP
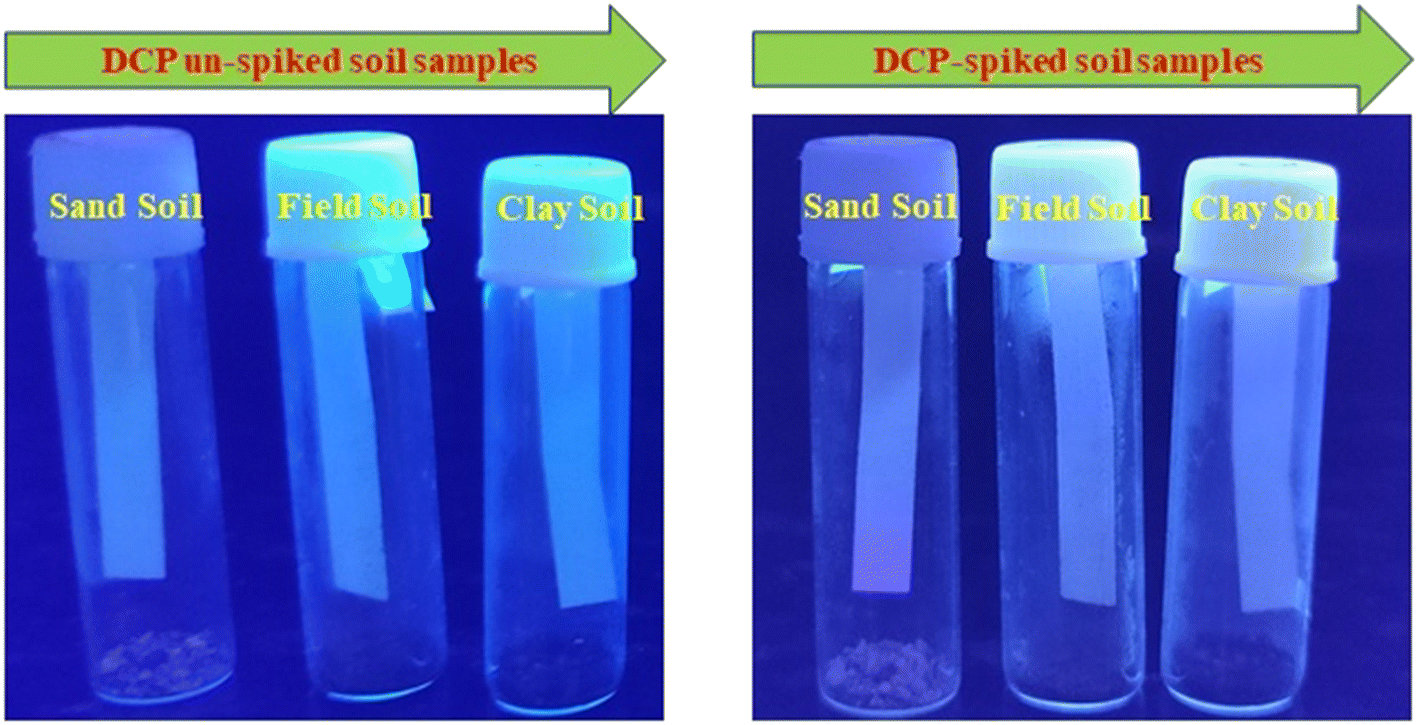
The sensor's significant sensitivity to DCP motivates us to advance toward potential practical applications of TSB, particularly in detecting the sarin gas simulant DCP in soil samples. For this purpose, we have utilized TSB across a range of soil samples (including field, clay, and sand soil) to sense effective chemical warfare (CW) nerve agent mimics like DCP. This is appropriate as chemical warfare nerve agents are often dispersed over fields during wartime or terrorist incidents. Hence, to ascertain the presence of this hazardous substance in diverse soil types such as clay, field, and sand soil, we followed the protocol: first of all, we placed 0.5 g of every soil sample in a glass vial. Then, every soil sample was treated with a toxic DCP solution. Then, the paper strip was coated with TSB solution (1 mM) and dried; 4th step, the dried strip was put in a sealed glass vial; 5th step, fluorescence enhancement was observed with DCP vapor exposure under a UV-lamp (365 nm) under ambient conditions (Fig. 10).
 |
| | Fig. 10 Pictorial representation of soil sample observation before and after exposure to DCP vapor under UV light irradiation. | |
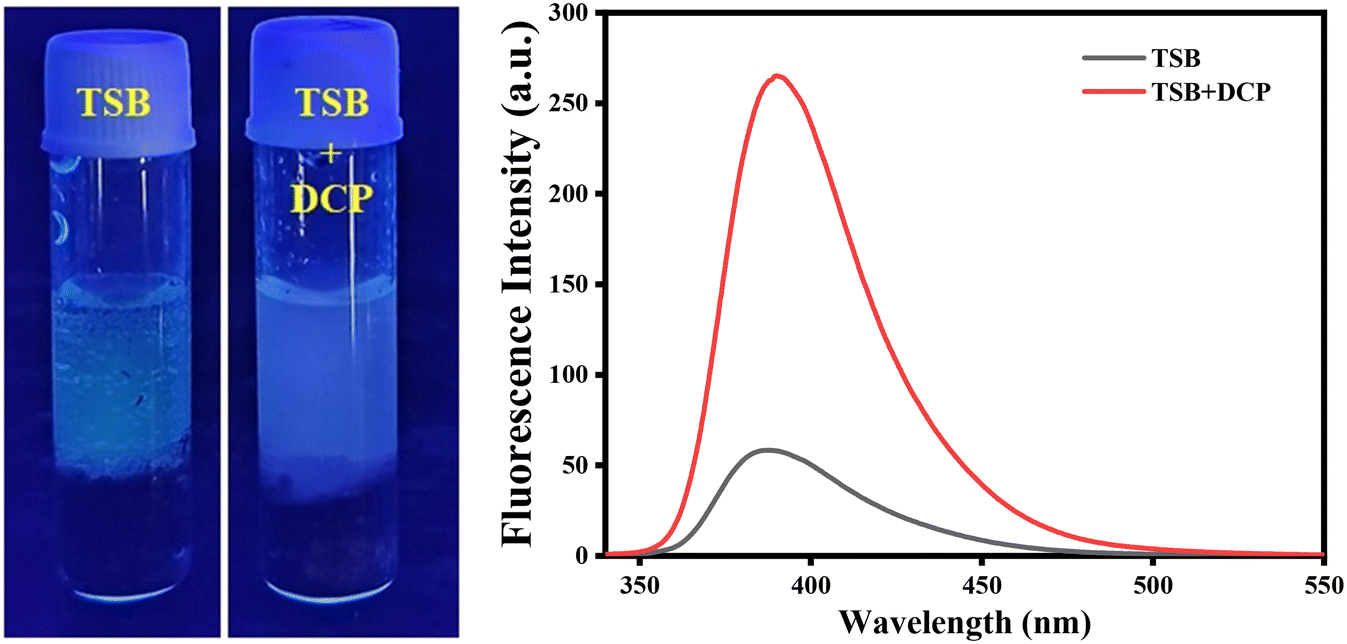
Furthermore, for detection in the liquid phase, we mixed the three soil samples in a glass vial and spiked them with DCP solution then the soil samples were transferred into the TSB solution. We observed after 15 to 20 minutes that the solution showed blue-violet fluorescence (Fig. 11). We recorded the photoluminescence spectra of DCP unspiked and DCP spiked solution and got around 5-fold enhancement from the DCP unspiked solution. From this surveillance, we can conclude that our prepared sensor can detect dangerous nerve agent, sarin gas simulant DCP in vapor and liquid phases during wartime or terrorist incidents.
 |
| | Fig. 11 Real-life detection of DCP in a mixture soil sample during unwanted circumstances with corresponding fluorescence spectra. | |
4. Conclusion
In conclusion, we have introduced a chromo-fluorogenic chemosensor, TSB, embracing chromone–benzoxazole, demonstrating remarkable selectivity and sensitivity to toxic nerve agent sarin surrogate DCP. This sensor efficiently detects DCP, transitioning from very weak yellow to colorless in solution phases and from very weak emission to extremely intense blue-violet emission under a UV lamp at room temperature, in solution and gaseous phases, respectively. We have also conducted time-dependent experiments to assess the real-time detection ability of our developed probe TSB for detecting DCP. The formation of phosphorylated TSB–DCP product accounts for the UV-visible spectral change and fluorescence enhancement, which was achieved through NMR and mass spectrometric analysis. The interruption of ICT and disturbance of ESIPT are found to be responsible for the observation of corresponding optical signaling of TSB upon exposure to DCP. A test kit experiment has been conducted for on-spot identification of DCP to assess the sensing capabilities of TSB in solid form. Also, dip vial conical flask experiments have been performed for the detection of DCP vapor. To execute real-life and on-spot detection of DCP, a soil sample analysis has been performed. The flexibility and rapidity of the current probe make it both fascinating and practical. We believe that the developed probe TSB can offer a broader perspective for tailoring ICT and ESIPT-based chromo-fluorogenic probes to accelerate their real-life application and advancement in areas such as forensic, national defense, and public safety.
Data availability
The data supporting this article have been included as part of the ESI.†
Author contributions
Tuhina Sultana: investigation, methodology, validation, data curation, visualization, writing – original draft; Manas Mahato: investigation, methodology, validation, data curation, visualization, writing – original draft; Sabbir Ahamed: data curation, visualization, validation, formal analysis; Najmin Tohora: investigation, methodology, validation, data curation, visualization, Jyoti Chourasia: data curation, formal analysis, visualization, validation; Shreya Ali: data curation, formal analysis; Sudhir Kumar Das: conceptualization, supervision, project administration, funding acquisition, and writing – reviewing and editing.
Conflicts of interest
There are no conflicts of interest to declare.
Acknowledgements
Financial support from SERB, New Delhi, Govt. of India (Fund no. EEQ/2023/000048) is highly acknowledged. MM, SA, and JC thank Govt. of West Bengal, India, for the Swami Vivekananda Merit-cum-Means Scholarship awarded to them. NT acknowledges the Ministry of Minority Affairs, Govt. of India, for awarding the Maulana Azad National Fellowship to her.
References
- F. R. Sidell and J. Borak, Ann. Emerg. Med., 1992, 21, 865–871 CrossRef CAS.
- T. C. Marrs, Pharmacol. Ther., 1993, 58, 51–66 CrossRef CAS PubMed.
- K. Tuovinen, Toxicology, 2004, 196, 31–39 CrossRef CAS.
- A. Vale, Przegl. Lek., 2005, 62, 528–532 Search PubMed.
- R. M. Black, R. J. Clarke, R. W. Read and M. T. J. Reid, J. Chromatogr. A, 1994, 662, 301–321 CrossRef CAS.
- J. Ngeh-Ngwainbi, P. H. Foley, G. G. Guilbault and S. S. Kuan, J. Am. Chem. Soc., 1986, 108, 5444–5447 CrossRef CAS.
- R. J. Russell, M. V. Pishko, A. L. Simonian and J. R. Wild, Anal. Chem., 1999, 71, 4909–4912 CrossRef CAS.
- M. A. K. Khan, K. Kerman, M. Petryk and H. B. Kraatz, Anal. Chem., 2008, 80, 2574–2582 CrossRef CAS.
- P. M. Diakowski, Y. Xiao, M. W. P. Petryk and H. B. Kraatz, Anal. Chem., 2010, 82, 3191–3197 CrossRef CAS.
- J. Wang, M. Pumera, G. E. Collins and A. Mulchandani, Anal. Chem., 2002, 74, 6121–6125 CrossRef CAS.
- T. E. Mlsna, S. Cemalovic, M. Warburton, S. T. Hobson, D. A. Mlsna and S. V. Patel, Sens. Actuators, B, 2006, 116, 192–201 CrossRef CAS.
- F. Wang, H. Gu and T. M. Swager, J. Am. Chem. Soc., 2008, 130, 5392–5393 CrossRef CAS.
- M. Utriainen, E. Kärpänoja and H. Paakkanen, Sens. Actuators, B, 2003, 93, 17–24 CrossRef CAS.
- M. Mahato, S. Ahamed, N. Tohora, T. Sultana, S. Ghanta and S. K. Das, Microchem. J., 2023, 185, 108240 CrossRef CAS.
- Y. X. Li and K. J. Klabunde, Langmuir, 1991, 7, 1388–1393 CrossRef CAS.
- N. U. Zhanpeisov, G. M. Zhidomirov, I. V. Yudanov and K. J. Klabunde, J. Phys. Chem., 1994, 98, 10032–10035 CrossRef CAS.
- T. Sultana, M. Mahato, N. Tohora, S. Ahamed, P. Pramanik, S. Ghanta and S. Kumar Das, J. Photochem. Photobiol., A, 2023, 439, 114584 CrossRef CAS.
- N. Tohora, M. Mahato, T. Sultana, S. Ahamed and S. K. Das, Anal. Chim. Acta, 2023, 1255, 341111 CrossRef CAS.
- A. M. Costero, S. Gil, M. Parra, P. M. E. Mancini, R. Martínez-Máñez, F. Sancenón and S. Royo, Chem. Commun., 2008, 6002–6004 RSC.
- T. J. Dale and J. Rebek, J. Am. Chem. Soc., 2006, 128, 4500–4501 CrossRef CAS PubMed.
- X. Wu, Z. Wu and S. Han, Chem. Commun., 2011, 47, 11468–11470 RSC.
- J. Yao, Y. Fu, W. Xu, T. Fan, Y. Gao, Q. He, D. Zhu, H. Cao and J. Cheng, Anal. Chem., 2016, 88, 2497–2501 CrossRef CAS.
- H. Jiang, P. Wu, Y. Zhang, Z. Jiao, W. Xu, X. Zhang, Y. Fu, Q. He, H. Cao and J. Cheng, Anal. Methods, 2017, 9, 1748–1754 RSC.
- H. Lee and H. J. Kim, Tetrahedron, 2014, 70, 2966–2970 CrossRef CAS.
- T. J. Dale and J. Rebek, Angew. Chem., Int. Ed., 2009, 48, 7850–7852 CrossRef CAS PubMed.
- Y. Liu, L. Zhang, L. Chen, Z. Liu, C. Liu and G. Che, Spectrochim. Acta, Part A, 2021, 248, 119269 CrossRef CAS PubMed.
- P. Torawane, S. K. Sahoo, A. Borse and A. Kuwar, Luminescence, 2017, 32, 1426–1430 CrossRef CAS.
- D. H. Joo, J. S. Mok, G. H. Bae, S. E. Oh, J. H. Kang and C. Kim, Ind. Eng. Chem. Res., 2017, 56, 8399–8407 CrossRef CAS.
- N. Tohora, M. Mahato, T. Sultana, S. Ahamed, S. Ghanta and S. Kumar Das, J. Photochem. Photobiol., A, 2023, 442, 114807 CrossRef CAS.
- B. Díaz De Greñu, D. Moreno, T. Torroba, A. Berg, J. Gunnars, T. Nilsson, R. Nyman, M. Persson, J. Pettersson, I. Eklind and P. Wästerby, J. Am. Chem. Soc., 2014, 136, 4125–4128 CrossRef.
- V. Kumar, G. Raviraju, H. Rana, V. K. Rao and A. K. Gupta, Chem. Commun., 2017, 53, 12954–12957 RSC.
- V. Kumar, H. Kim, B. Pandey, T. D. James, J. Yoon and E. V. Anslyn, Chem. Soc. Rev., 2023, 52, 663–704 RSC.
- V. Kumar, H. Rana, G. Raviraju and A. K. Gupta, Anal. Chem., 2018, 90, 1417–1422 CrossRef CAS.
- V. Kumar and H. Rana, Chem. Commun., 2015, 51, 16490–16493 RSC.
- V. Kumar and E. V. Anslyn, J. Am. Chem. Soc., 2013, 135, 6338–6344 CrossRef CAS PubMed.
- X. S. Yu, M. M. Zhu, R. Zuo, Y. Peng and Y. W. Wang, Molecules, 2023, 28, 3237 CrossRef CAS.
- X. S. Yu, R. Zuo, M. Y. Shuai, X. Feng, Y. Peng and Y. W. Wang, Org. Biomol. Chem., 2023, 21, 4667–4671 RSC.
- T. Corrales, R. Santonocito, M. Spina, R. Puglisi, A. Pappalardo, N. Tuccitto and G. T. Sfrazzetto, Chemosensors, 2023, 11, 503 CrossRef.
- R. Puglisi, R. Santonocito, E. Butera, G. L. Mendola, A. Pappalardo and G. Trusso Sfrazzetto, ACS Omega, 2023, 8, 38038–38044 CrossRef CAS PubMed.
- C. Chen, W. Zhang, Y. Ke, L. Jiang and X. Hu, Anal. Methods, 2024, 16, 515–523 RSC.
- E. Barni, P. Savarino, M. Marzona and M. Piva, J. Heterocyclic Chem., 1983, 20, 1517–1521 CrossRef CAS.
- S. Bhardwaj, N. Maurya and A. K. Singh, Sens. Actuators, B, 2018, 260, 753–762 CrossRef CAS.
- P. Zheng, A. Abdurahman, G. Liu, H. Liu, Y. Zhang and M. Zhang, Sens. Actuators, B, 2020, 322, 128611 CrossRef CAS.
- K. Aich, S. Das, S. Gharami, L. Patra and T. Kumar Mondal, New J. Chem., 2017, 41, 12562–12568 RSC.
- S. S. Ali, A. Gangopadhyay, A. K. Pramanik, U. N. Guria, S. K. Samanta and A. K. Mahapatra, Dyes Pigm., 2019, 170, 107585 CrossRef CAS.
|
| This journal is © The Royal Society of Chemistry 2024 |
Click here to see how this site uses Cookies. View our privacy policy here. 
 Open Access Article
 This Open Access Article is licensed under a Creative Commons Attribution-Non Commercial 3.0 Unported Licence
 *
*


 to the excited-state keto form
  of TSB. The appearance of an emission band at 390 nm is attributed to the conversion of the excited-state keto form
  to the ground-state keto form (Ke). While the enol form (En) exhibits superior stability at the ground state compared to Ke, the keto form reverts to Envia the reverse proton transfer (RPT) mechanism (Scheme 3). Sensor TSB demonstrates nucleophilic activities, while DCP features an electrophilic center at its phosphorus (P), which is enhanced by the presence of an excellent leaving –Cl group. Successively, the lone pair from the –OH functional group's oxygen atom and the lone pair from the –CH