 Open Access Article
Creative Commons Attribution 3.0 Unported Licence
A computational study of cell membrane damage and intracellular delivery in a cross-slot microchannel
Ruixin
Lu
 *ab,
Peng
Yu
 c and
Yi
Sui
 *b
*b
aSchool of Mechanical Engineering, University of Shanghai for Science and Technology, Shanghai 200093, China. E-mail: lurx@usst.edu.cn
bSchool of Engineering and Materials Science, Queen Mary University of London, London E1 4NS, UK. E-mail: y.sui@qmul.ac.uk
cDepartment of Mechanics and Aerospace Engineering, Southern University of Science and Technology, Shenzhen 518055, China
First published on 22nd March 2024
Abstract
We propose a three-dimensional computational framework to simulate the flow-induced cell membrane damage and the resulting enhanced intracellular mass transport in a cross-slot microchannel. We model the cell as a liquid droplet enclosed by a viscoelastic membrane and solve the cell deformation using a well-tested immersed-boundary lattice-Boltzmann method. The cell membrane damage, which is directly related to the membrane permeability, is considered using continuum damage mechanics. The transport of the diffusive solute into the cell is solved by a lattice-Boltzmann model. After validating the computational framework against several benchmark cases, we consider a cell flowing through a cross-slot microchannel, focusing on the effects of the flow strength, channel fluid viscosity and cell membrane viscosity on the membrane damage and enhanced intracellular transport. Interestingly, we find that under a comparable pressure drop across the device, for cells with low membrane viscosity, the inertial flow regime, which can be achieved by driving a low-viscosity liquid at a high speed, often leads to much larger membrane damage, compared with the high-viscosity low-speed viscous flow regime. However, the enhancement can be significantly reduced or even reversed by an increase of the cell membrane viscosity, which limits cell deformation, particularly in the inertial flow regime. Our computational framework and simulation results may guide the design and optimisation of microfluidic devices, which use cross-slot geometry to disrupt cell membranes to enhance intracellular delivery of solutes.
1. Introduction
Intracellular delivery, which refers to the process of introducing exogenous cargoes such as small-molecular drugs, nucleic acids or synthetic nanoparticles into living cells, has drawn increasing attention due to its ground-breaking applications ranging from mRNA vaccines, preparation of CAR-T cells for cancer treatment, to genetic engineering of plants.1–5 To enhance the internalisation of foreign cargoes in cells, various approaches have been proposed, which are commonly classified into carrier-mediated and membrane disruption-based methods.4 The former uses carriers, in various forms including viral vectors, liposomes or cell-penetrating peptides to deliver encapsulated cargoes into cells using their pathways such as infection or fusion.1,6,7 Membrane disruption-based methods often apply external energy, e.g., in an electrical, thermal or mechanical form, to cells to create structural damage including pores and ruptures in the cellular membrane, enabling foreign cargoes dispersed in a solution to enter the cells.8–10 While carrier-mediated delivery strategies are limited in the types of cargo–carrier combinations that can be used in specific applications, membrane disruption-based methods are nearly universal, allowing for the delivery of almost any cargo that can be dissolved in a solution.1Amongst the numerous membrane disruption-mediated intracellular delivery methods, microfluidic-based membrane disruption, such as cell squeezing through a narrow channel11–13 or cell stretching in a micro cross-slot,10,14 have been particularly promising, for their simplicity and superior capabilities in precisely controlling the flow condition and fluid stresses, high processing throughput rate, and potential for fully automated systems.1,4,15 In those systems, cells are flown through and deformed in well-defined flow geometries, where the cell membrane is disrupted largely via two mechanisms: mechanosensitive (MS) channel opening and membrane pore or rupture formation (i.e., membrane damage).
MS channels that form in the lipid bilayer of the cell membrane are mainly gated by membrane tension, introduced by cell deformation, and therefore their opening and closing can be controlled by the ambient flow strength.16 Exogenous cargoes can be transported through the membrane during the opening state of MS channels.11 When cells undergo significant deformation, the cell membrane can be damaged through the formation of nano/micro pores or ruptures,17–21 leading to enhanced membrane permeability to exogenous substances. Unlike MS channels, whose opening and closing are almost instantaneously determined by the transient membrane tension, membrane damage could last for seconds or minutes before the membrane reseals.11,22
Despite recent developments and the success of microfluidic-based techniques for membrane disruption-mediated intracellular delivery, numerical simulation of the problem at the single cell level, taking into account the flow-induced cell deformation, membrane damage and the associated mechanical weakening, as well as the solute transport inside and around the cell with spatial resolution, is still at a very early stage. Amongst the relevant pioneer studies, Liu and co-workers have built a comprehensive three-dimensional (3D) model which considers the cell deformation using an immersed boundary method.23–27 The cell membrane damage depends on the local strain and is predicted using molecular dynamics. The membrane damage leads to enhanced membrane porosity, and the cross-membrane mass transport is resolved using a 1D mathematical model. Specifically, the comprehensive model takes into account the recovery of the membrane damage, on a time scale of several minutes. With the model, the group considered the intracellular drug delivery by rapid squeezing in a constricted channel,26 and various other problems such as haemoglobin release from red blood cells.24,26 Luo and Bai28 considered the release of a diffusive solute from an elastic microcapsule flowing through a constricted channel. The mass transport was resolved by the convection–diffusion equation, and the diffusion coefficient at the membrane was assumed to depend on the membrane tension through an exponential equation. Misbah and co-workers pioneered the coupling of cell deformation and membrane MS channel opening for numerical simulation of cross-membrane solute transport.29–32 In their model, the membrane permeability depends on the local membrane stress and the temporal evolution of the membrane curvature. They employed a lattice Boltzmann model for the mass transport and developed a highly efficient approach to deal with the three different types of boundary conditions at the deforming cell membrane. The method has been used to study ATP release from RBCs flowing in microchannels29–31 and capillary networks.32
In the studies mentioned above, the effect of the cell membrane viscosity, which has been shown to play important roles in the transient cell deformation,33–38 has not been considered. Besides, the models often neglect the membrane mechanical degradation (i.e., reduction of strain energy density) as a result of the membrane damage. In the present study, we develop a comprehensive computational framework to take into account those important factors. We consider the cell using a recent mechanical model that has been verified against flow experiments conducted on human leukaemia cells in a constricted microchannel. The model takes into account both the cell membrane elasticity and viscosity. The fluid flow and cell deformation are simulated using a well-tested 3D immersed-boundary lattice-Boltzmann method (LBM). We employ continuum damage mechanics (CDM) to model the evolution of cell membrane damage, caused by flow-induced deformation, and its effect on membrane mechanical degradation. The CDM approach has been widely used for simulating the damage process of biological tissues and bioartificial microcapsules.39–42 The cell membrane permeability depends on the membrane damage, and the transport of the diffusive solute across the deforming cell membrane, inside and outside the cell, is solved using a lattice-Boltzmann model.
We consider the flow-induced cell deformation, membrane damage and associated transport of a diffusive solute into a cell flowing through a cross-slot microchannel. The channel geometry has been successfully applied to disrupt the cell membrane to enhance the intracellular delivery of agents including dextran, DNA and mRNA with high throughput (up to 106 cells per min),10,14 as it can generate a strong extensional flow with a stagnation point at the centre of the cross-slot region. At high flow speeds when the inertial effect becomes important, the extensional flow transits to a spiral flow.43,44 Despite the great success in practical applications, there are still a number of fundamental open questions. In the context of generating membrane damage to enhance intracellular delivery, experiments can be conducted in either the inertial or viscous flow regimes, with comparable pressure drop across the whole device. The inertial flow can be achieved by driving a low-viscosity suspension through the channel at a high speed, while the viscous flow regime features a high-viscosity medium flowing at a low speed. Which regime is more effective in mechanically disrupting the cell membrane and enhancing cross-membrane mass transport? What are the effects of cell membrane properties, in particular the membrane viscosity, in this process? The present study aims to address those open questions.
This paper is organised as follows: the flow geometry, the governing equations and the main dimensionless parameters are detailed in Section 2; the numerical methods and their validations are presented in Section 3. In Section 4, we present the findings of our study on cell deformation, membrane damage, and intracellular mass transport of a cell flowing through a cross-slot microchannel under various flow regimes. We then conclude the paper in Section 5.
2. Problem statement
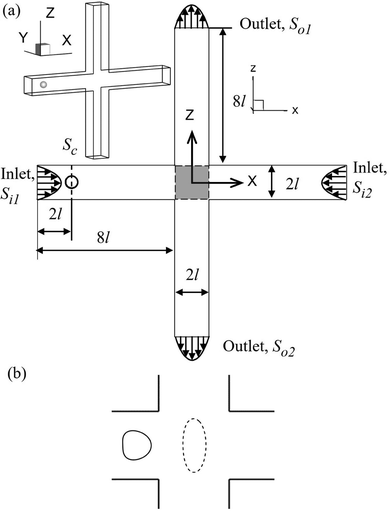
We consider the cell deformation, membrane damage, and intracellular mass transport as a cell flows through a cross-slot microchannel, which is illustrated in Fig. 1. The four branches of the inflow and outflow channels all have a constant square cross-section with a side length of 2l. A three-dimensional Cartesian coordinate is defined with the x-axis along the inflow channel branches, the z-axis along the outflow branches, and x = y = z = 0 at the centre of the channel cross-slot. The fluid flow is governed by the Navier–Stokes equations, and the inlets Si1, Si2 and outlets So1, So2 are set with fully developed laminar flow profiles and have the same flow rate Q. A no-slip boundary condition is imposed on the channel walls.The cell is initially spherical with radius a and is enclosed by a viscoelastic membrane. The fluids inside and outside the cell have identical density ρ, but different viscosities μin and μout, respectively. The centre of the cell is initially located within the cross-section Sc, which is 2l away from the inlet Si1. To mimic experiments where cells are often not perfectly aligned with the centreline of the feeding channel, a small off-centre distance of 0.02l is set along the z-direction.
2.1. Cell mechanical model
The cell is modelled as a liquid droplet enclosed by a viscoelastic membrane with a small bending stiffness. The total membrane stress τ is the sum of the elastic and viscous stresses:| τ = τe + τv. | (1) |
The membrane elasticity is governed by the two-dimensional Skalak (SK) law,45 with a strain energy function
 | (2) |
The elastic stress tensor τe can be calculated from
| τe = τe1e1 ⊗ e1 + τe2e2 ⊗ e2, | (3) |
 | (4) |
The membrane viscous stress τv has contributions from the shear viscosity μs and area dilatational viscosity  33:
33:
 | (5) |
 , so that the relaxation times corresponding to the shear and dilatational viscosities (μs/Gs and
  ) are equal.
The bending resistance of the membrane is modelled using Helfrich's formulation46
 | (6) |
2.2. Membrane damage model
Membrane damage in the form of pores or ruptures appears when cells are subjected to intense mechanical stresses from the surrounding flow. With the damage growing, the membrane mechanically degrades and has less strength to resist deformation. In the present study, we model this process by the CDM, that has been widely applied for the damage of biological tissues and biomaterials.39–42,47 In the CDM, the local average damage state is represented by a continuum damage variable. For a small patch of the cell membrane, the continuum damage variable can be defined as the ratio of the damaged area δSD to the total area δS of the membrane patch: | (7) |
![[S with combining tilde]](https://www.rsc.org/images/entities/i_char_0053_0303.gif) is the undamaged area. The damage variable d can range from 0 (undamaged state) to 1 (completely damaged).
is the undamaged area. The damage variable d can range from 0 (undamaged state) to 1 (completely damaged).
To account for the mechanical degradation due to damage, we adopt a strain energy function under the CDM:
 | (8) |
 | (9) |
| f(Y, d) = Y − κ(d), | (10) |
| κ(d) = Gs(YD + YCd), | (11) |
We assume that the damage evolution is irreversible and follows the Karush–Kuhn–Tucker (KKT) loading–unloading conditions:41,47,52
| f ≤ 0, ḋ ≥ 0, fḋ = 0. | (12) |
 | (13) |
2.3. Model for mass transport
When the cell membrane is damaged, solutes can be transported across the membrane through the damaged area into the cell. The cell membrane permeability P measures the passive diffusion rate of the solute molecules across the membrane, and is proportional to the porosity,53,54 which is equivalent to the damage variable d of the present model:| P = kpd. | (14) |
We assume that the transport of the solute follows the convection–diffusion equation
 | (15) |
 | (16) |
2.4. Dimensionless parameters
The present problem is governed by the following dimensionless parameters:• the flow Reynolds number Re = 2ρUl/μout, where U is the average flow speed in the inflow/outflow channels;
• the capillary number Ca = μoutU/Gs, which measures the relative importance of the fluid viscous and membrane elastic forces;
• the viscosity ratio between the fluids inside and outside the cell λμ = μin/μout;
• the dimensionless membrane viscosity η = μs/μina;
• the cell confinement ratio a/l, which compares the size of the cell relative to the channel; and
• the dimensionless permeability coefficient.
To quantify the cell deformation, we mainly use the Taylor deformation parameter
 | (17) |
3. Numerical methods and validations
3.1. Method for flow-induced cell deformation
The flow-induced cell deformation is resolved using a 3D immersed-boundary LBM, that has been extensively verified in our previous studies of the dynamics of microcapsules and cells in various flow geometries.38,58–64 Here we only give a brief introduction. The fluid flow is governed by the Navier–Stokes equations which are solved using a 3D nineteen-velocity LBM with a grid size of Δx = Δy = Δz = 2l/80. At the walls of the channel branches, a second-order bounce back scheme based on interpolation65 is used to maintain the no-slip boundary conditions. A second-order non-equilibrium extrapolation method66 is employed to impose the velocity boundary condition at the inlets and outlets.The fluid–cell interaction is addressed using an immersed-boundary method.67 The cell membrane is discretised into 8192 flat triangular elements, which are connected by 4098 nodes, following Ramanujan and Pozrikidis.68 The immersed-boundary method ensures that the cell membrane moves at the same velocity as the fluid surrounding it, thereby satisfying the no-slip boundary condition. We use the approach of Yazdani and Bagchi34 to calculate the viscoelastic force of the membrane. This involves a slightly modified mechanical system to approximate eqn (1). Further information on the implementation and validation can be found in Yazdani and Bagchi34 and Wang et al.64 The bending force density can be derived from the bending energy formulation (eqn (6)), and we follow the approaches of Garimella and Swartz69 and Yazdani and Bagchi.70
3.2. Numerical method for mass transport
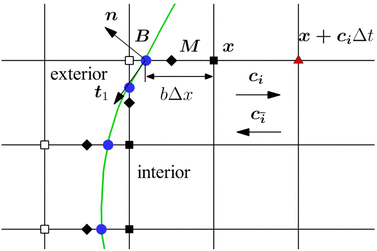
The mass transport is governed by the convection–diffusion equation, which we solve using a 3D seven-velocity D3Q7 LB model, with a hybrid regularisation (HR) collision scheme. Details can be found in the Appendix A. To deal with the Neumann boundary condition for the mass flux at the cell membrane, we extend the 2D LB model of Zhang and Misbah30 designed for ATP release from RBCs, to 3D simulations.We describe the implementation of the Neumann boundary conditions with the aid of Fig. 2, which illustrates the boundary lattice points in a 2D cross-section of the present problem. For lattice points close to the cell membrane, represented by the square symbols, the streaming process in the LB model is affected by the existence of the membrane. For example, in Fig. 2 at the interior boundary lattice x, its concentration distribution function along the direction of ci at time t + Δt, gi(x, t + Δt), cannot be determined by streaming of the post-collision distribution function  , due to the presence of the membrane. Therefore gi(x, t + Δt) needs to be constructed. Inspired by the half-way bounce-back scheme of Huang et al.71 and Zhang and Misbah30 proposed that the solute concentration gradient along the direction cī at the middle point M, αmid, can be used to determine gi(x, t + Δt), following
 | (18) |
 | (19) |
The concentration gradient αmid can be constructed as
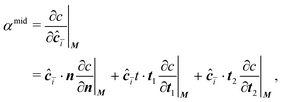 | (20) |
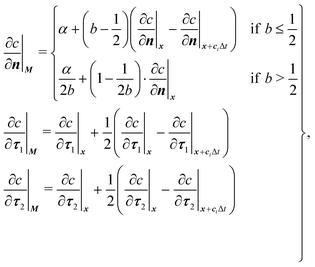 | (21) |
With the cell membrane moving, some lattice points of the fluid domain would shift from one side of the membrane to the other side. The concentration distribution functions of these points are constructed from those of the adjacent points on the same side of the membrane, using the linear interpolation scheme of Zhang and Misbah.30
3.3. Validation of the method for mass transport
We first validate our implementation of the numerical model for mass transport by considering the time-dependent diffusion of a solute across the membrane of a non-deformable spherical capsule in the absence of fluid flow, a problem that has been studied by Amiri and Zhang72 with a LBM. The computational domain has dimensions of L × W × H = 250 × 80 × 80, and the spherical capsule has a radius R = 10, placed at the centre of the domain. The diffusion coefficient D is set as 1/80 and 1/160, respectively, inside and outside the capsule. The membrane permeability P = 1/2400. The solute concentration at the top and bottom surfaces of the domain is fixed at zero, and periodic boundary conditions are applied on surfaces along the other two directions. At time t = 0, the initial solute concentration inside the capsule is c0, and is zero elsewhere in the computational domain. The solute will diffuse through the capsule membrane and eventually be absorbed by the top and bottom surfaces. In Fig. 3, we present the time evolution of the volume-averaged solute concentration![[c with combining macron]](https://www.rsc.org/images/entities/i_char_0063_0304.gif) inside the capsule, and compare the result with that of Amiri and Zhang.72 Very good agreement has been achieved.
inside the capsule, and compare the result with that of Amiri and Zhang.72 Very good agreement has been achieved.
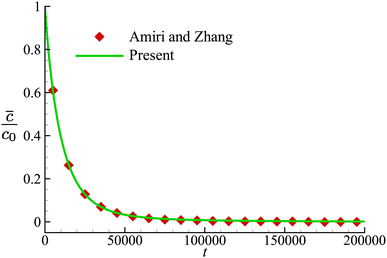 | ||
Fig. 3 Time evolution of the volume-averaged solute concentration ![[c with combining macron]](https://www.rsc.org/images/entities/i_char_0063_0304.gif) inside the capsule. Symbols are the results of Amiri and Zhang.72 inside the capsule. Symbols are the results of Amiri and Zhang.72 | ||
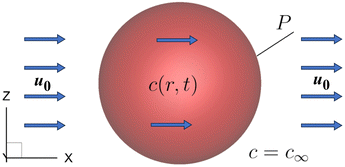
To further test the numerical method for mass transport for moving boundary problems, we consider the time-dependent diffusion of a solute into a non-deformable spherical capsule with a permeable membrane that is advected by a flow with a constant speed u0 = (U, 0, 0), as shown in Fig. 4. The solute concentration outside the capsule remains constant at c∞, and the capsule membrane permeability P = 3 × 10⁻⁴. Inside the capsule, the initial solute concentration is zero, and the solute diffusion coefficient is D = 0.000781. It can be deduced from the Galilean invariance that the solute concentration inside the capsule is independent of the advection velocity of the surrounding fluid.
The volume-averaged solute concentration inside the capsule can be obtained analytically:
 | (22) |
 | (23) |
 | (24) |
 | (25) |
In Fig. 5, we present the time evolutions of the volume-averaged solute concentration ![[c with combining macron]](https://www.rsc.org/images/entities/i_char_0063_0304.gif) within a stationary and a moving capsule. The results are visually identical, and both agree very well with the analytical solution.
within a stationary and a moving capsule. The results are visually identical, and both agree very well with the analytical solution.
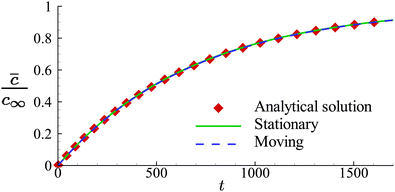 | ||
| Fig. 5 Comparison of the time evolutions of the volume-averaged solute concentration in a moving and a stationary capsule obtained from numerical simulations. Symbols are the analytical results. | ||
3.4. Verification of the method for membrane damage
In the present study, we have employed the model developed by Grandmaison et al.47 for the flow-induced membrane damage. To verify our numerical implementation of the model, we consider the membrane damage of an initial spherical capsule with a hyperelastic neo-Hookean membrane in simple shear flow in the Stokes regime, which was studied by Grandmaison et al.47 using a boundary integral method. The fluids inside and outside the capsule are assumed to have equal density and viscosity. The governing dimensionless parameter for the capsule deformation is the capillary number, defined as Ca = μoutKa/Gs, where K is the shear rate. In the membrane damage model, the damage threshold YD = 0.2 and the hardening modulus YC = 2. After being released into the simple shear flow, the capsule deforms into a steady ellipsoidal shape with a certain inclination with respect to the flow direction, and its membrane rotates around the fluid inside (i.e., tank-treading motion). As the capillary number increases, the capsule becomes more deformed. Membrane damage appears and the maximum damage variable d∞max increases almost linearly with Ca until Ca ≈ 0.6. A further increase of Ca results in that d∞max grows drastically, and at Ca ∼ 0.72, complete local membrane damage is onset, where d∞max = 1. In Fig. 6, we present d∞max of the capsule membrane as a function of Ca. Our results agree very well with those of Grandmaison et al.47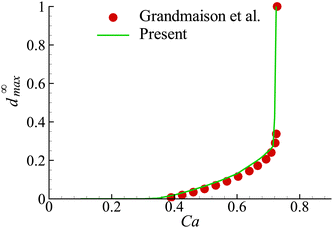 | ||
| Fig. 6 Maximum damage value at steady state, d∞max, as a function of Ca for YD = 0.2 and YC = 2. Symbols are the result of Grandmaison et al.47 | ||
4. A cell flows through a cross-slot microchannel
Using the comprehensive computational model proposed in the present study, in this section, we consider the flow-induced deformation, membrane damage and enhanced transport of a diffusive solute into a modelled 3D cell when it is flowing through a cross-slot microchannel. We attempt to address two open questions: firstly, under similar pressure drop across the device, is the viscous or inertial flow regime more effective in generating cell membrane damage and enhancing intracellular mass transport? Secondly, how are the membrane damage affected by the cell membrane viscosity? In experiments, cells have been flown through cross-slot microchannels at flow speeds up to metres per second,14,74,75 leading to shear rates well above 103 s−1, where the cell membrane viscosity is expected to play an important role in determining the cell transient deformation and the associated membrane damage.To elucidate the effect of flow regime, we conduct numerical simulations using three sets of parameters, corresponding to the same cell flowing in three distinctive flow regimes with increasing flow strength and inertial effect, under comparable pressure drop across the whole device:
• viscous flow regime: Re = 0.4, U = U0, μout = 2μin;
• moderate-inertia flow regime: Re = 40, U = 10U0, μout = μin/5; and
• spiral flow regime: Re = 80, U = 14U0, μout = μin/7.
Note that in practical flow experiments for cell stretching, the cross-slot region often only has a length of tens of micrometres, representing a very small faction of the entire flow path of the whole device, compared with the straight feeding and outlet channels that are usually much longer, in tens of millimetres.10,74 Therefore, the pressure drop across the whole device is primarily determined by the flow characteristics and lengths of the feeding and outlet channels. For the same device operating in the steady laminar flow regime, the total pressure drop is approximately proportional to the product of the fluid viscosity and average flow speed in straight channels ΔP ∝ μoutU.76 For the three sets of flow parameters considered in the present study, when increasing the average flow speed in the feeding channels, we reduce the fluid viscosity to ensure μoutU = constant.
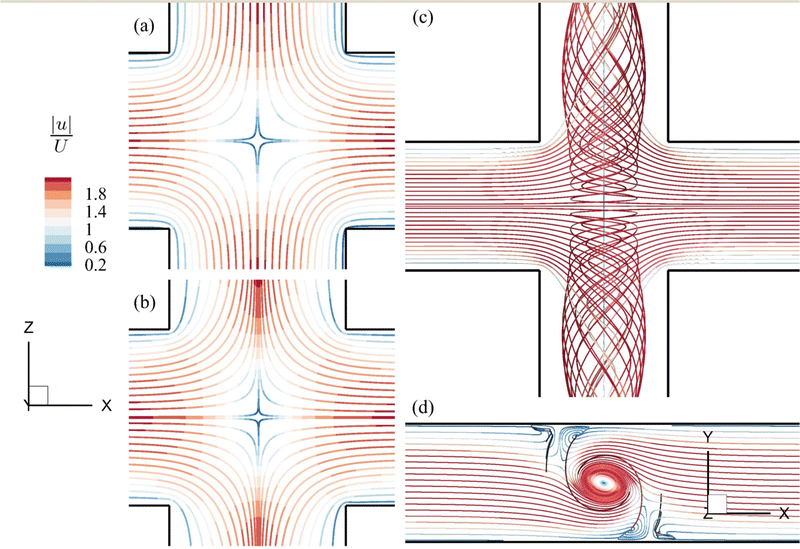
The streamlines of the background flow in the channel cross-slot region for the three distinctive flow regimes are presented in Fig. 7. From Fig. 7(a and b), one can see that the flow patterns for the viscous and moderate-inertia flow regimes are qualitatively similar, featuring extensional flows that are symmetric about the x = 0 and z = 0 planes, with a stagnation point at the centre of the cross-slot region. Our simulations suggest that when the flow Reynolds number exceeds 43, a spiral flow onsets due to a symmetry-breaking bifurcation.43Fig. 7(c and d) present the streamlines of the spiral flow at Re = 80. The spiral vortex rotates about the axis of the outlet channels. It is steady and symmetric with respect to the z = 0 plane. In the following sessions, we first consider the flow-induced cell membrane damage in the viscous and moderate-inertia flow regimes, focusing on the effects of inertia and cell membrane viscosity in Sections 4.1 and 4.2, respectively. We then consider the spiral flow regime in Section 4.3.
4.1. A cell with a hyperelastic membrane
We start from considering a simple cell where its membrane is purely hyperelastic that follows the SK law. We do so mainly for two reasons: firstly, the study serves as an important baseline reference for more realistic cells that have a viscoelastic membrane; secondly, the membrane damage and enhanced cross-membrane transport for a simple hyperelastic cell remains largely unknown. We conduct numerical simulations of a cell with a/l = 0.4, , under the viscous and moderate-inertia flow regimes at Re = 0.4 and 40, respectively.
Fig. 8(a) shows the time evolution of the Taylor shape parameter DXZ of a cell in the viscous and moderate-inertia flow regimes at Ca = 0.2. In this and other figures of the present study we set t = 0 as the time when a cell begins to enter the cross-slot region, i.e., any membrane element reaches the plane at x = −l. The time when the entire cell leaves the cross-slot region is marked with a circle symbol. To aid the understanding of the result, we also present the instantaneous shapes of the cell in Fig. 9 and 10 for the two flow regimes, respectively. In the viscous flow regime at Re = 0.4, the cell reaches a quasi-steady ellipsoidal shape with its long axis aligned with the direction of extension when it is approaching the stagnation point (see Fig. 9). The Taylor shape parameter remains a constant for a considerable time period. With a moderate inertial effect at Re = 40, after entering the cross-slot region, the cell quickly reaches its maximum elongation at t2 and then starts to retract, even when the cell is still approaching the stagnation point. This was termed an “overshoot–retract” motion and was analysed in detail in an earlier study by the present authors.38 In the present study, the viscosity of the fluid inside the cell is much higher than that of Lu et al.,38 and therefore only a mild overshoot–retract motion has been observed here. In Fig. 8(a), comparing the cell deformation in the two flow regimes, it is clear that the cell experiences much larger deformation under the effect of inertia.
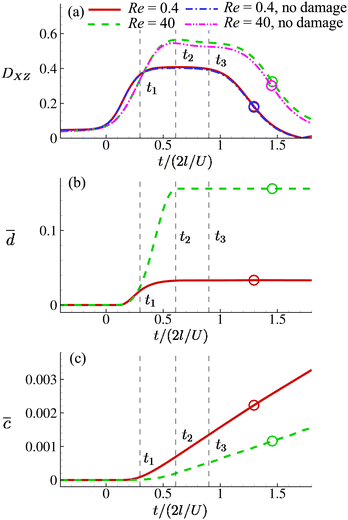 | ||
Fig. 8 Time evolutions of the (a) Taylor deformation parameter DXZ, (b) area-averaged membrane damage variable ![[d with combining macron]](https://www.rsc.org/images/entities/i_char_0064_0304.gif) and (c) volume-averaged solute concentration within the cell and (c) volume-averaged solute concentration within the cell ![[c with combining macron]](https://www.rsc.org/images/entities/i_char_0063_0304.gif) , when the cell is flowing through the channel cross-slot region in the viscous and moderate-inertia flow regimes, at Re = 0.4 and 40, respectively, with a/l = 0.4, , when the cell is flowing through the channel cross-slot region in the viscous and moderate-inertia flow regimes, at Re = 0.4 and 40, respectively, with a/l = 0.4,  , Ca = 0.2, YD = 0.02 and YC = 2. t1, t2, and t3 are three dimensionless times at 0.30, 0.61 and 0.90, respectively, when the instantaneous cell profiles will be shown in Fig. 9 and 10. At t = 0 the cell starts to enter the channel cross-slot; the circle symbols mark the moments when the cell completely leaves the region. The cell has a hyperelastic membrane. In (a), the temporal evolutions of DXZ of the same cell without taking into account the membrane damage are also presented as references. , Ca = 0.2, YD = 0.02 and YC = 2. t1, t2, and t3 are three dimensionless times at 0.30, 0.61 and 0.90, respectively, when the instantaneous cell profiles will be shown in Fig. 9 and 10. At t = 0 the cell starts to enter the channel cross-slot; the circle symbols mark the moments when the cell completely leaves the region. The cell has a hyperelastic membrane. In (a), the temporal evolutions of DXZ of the same cell without taking into account the membrane damage are also presented as references. | ||
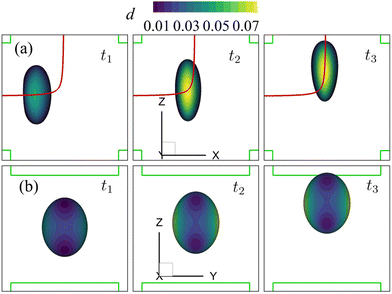 | ||
| Fig. 9 Instantaneous membrane damage profiles of the cell of Fig. 8 at Re = 0.4 as seen from (a) the y-axis and (b) the x-axis. The solid lines in (a) are the trajectories of the cell's mass centre. The time instances are provided in Fig. 8. | ||
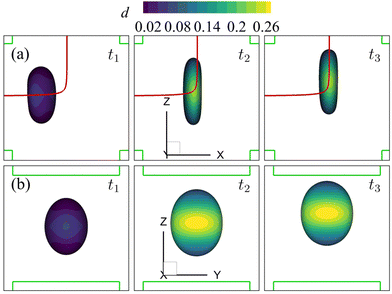 | ||
| Fig. 10 Instantaneous membrane damage profiles of the cell of Fig. 8 at Re = 40 as seen from (a) the y-axis and (b) the x-axis. The solid lines in (a) are the trajectories of the cell's mass centre. The time instances are provided in Fig. 8. | ||
We also present the distributions of the membrane damage variable of the cell in the viscous and moderate-inertia flow regimes in Fig. 9 and 10, respectively. In the viscous flow regime, the maximum membrane damage occurs at the membrane points that have the maximum y-axis values (see Fig. 9(a) at t2), due to the highest membrane tension there (not shown). Interestingly, when the inertial effect becomes significant, as can be seen from Fig. 10(b) at t2, the locations for maximum membrane damage have shifted to the central regions of the membrane faces that are perpendicular to the direction of the inflows (i.e., x-direction). The result is not surprising. In the inertial flow regime, the membrane elastic force is generated mainly to balance to the fluid inertial force, which is proportional to ρU2 and therefore has the maximum magnitude in the core of the inflow that has the highest velocity.
Fig. 8(b) shows the time evolutions of the area-averaged membrane damage variable ![[d with combining macron]](https://www.rsc.org/images/entities/i_char_0064_0304.gif) of the cell in the two flow regimes. After the cell enters the cross-slot region, the membrane damage increases to peak values, when the cell deformation is at the maximum, and then remains unchanged due to the condition of ḋ ≥ 0 in the present membrane damage model. Because of the greater cell deformation in the moderate-inertia flow regime compared with the viscous regime,
of the cell in the two flow regimes. After the cell enters the cross-slot region, the membrane damage increases to peak values, when the cell deformation is at the maximum, and then remains unchanged due to the condition of ḋ ≥ 0 in the present membrane damage model. Because of the greater cell deformation in the moderate-inertia flow regime compared with the viscous regime, ![[d with combining macron]](https://www.rsc.org/images/entities/i_char_0064_0304.gif) max at Re = 40 is almost four times larger than that of Re = 0.4, which is expected to result in much faster intracellular mass transport. We also consider the effect of the cell membrane damage on its transient deformation. In Fig. 8(a), one can compare the time evolutions of the Taylor shape parameter of the same cell with and without taking into account the membrane damage. It can be found that in the viscous regime, due to the relatively small membrane damage, there is visually no difference between the results. However, in the moderate-inertia region,
max at Re = 40 is almost four times larger than that of Re = 0.4, which is expected to result in much faster intracellular mass transport. We also consider the effect of the cell membrane damage on its transient deformation. In Fig. 8(a), one can compare the time evolutions of the Taylor shape parameter of the same cell with and without taking into account the membrane damage. It can be found that in the viscous regime, due to the relatively small membrane damage, there is visually no difference between the results. However, in the moderate-inertia region, ![[d with combining macron]](https://www.rsc.org/images/entities/i_char_0064_0304.gif) reaches the order of 0.1, which has led to a considerable increase of DXZ, compared with the cell whose membrane cannot be damaged by the fluid flow.
reaches the order of 0.1, which has led to a considerable increase of DXZ, compared with the cell whose membrane cannot be damaged by the fluid flow.
Note that the present computational model can predict the instantaneous field of the solute concentration inside the cell. Two examples are presented in Fig. 11 and 12, corresponding to the cell in Fig. 9 and 10, respectively. From the figures, it is seen that within the cell the regions with relatively high solute concentration are always close to membrane areas with a higher level of membrane damage. Fig. 8(c) presents the time evolutions of the volume-averaged solute concentration within the cell in the two flow regimes. Surprisingly, although the cell at Re = 40 has developed much greater membrane damage, leading to faster cross-membrane mass transport, its internal solute concentration at the exit of the cross-slot region is much lower than that of the cell at Re = 0.4. The intriguing result is mainly due to the difference of the residence time of the cell in the channel cross-slot in the two flow regimes. In the dimensional form, the cell residence time at Re = 40 is only about a tenth of that at Re = 0.4.
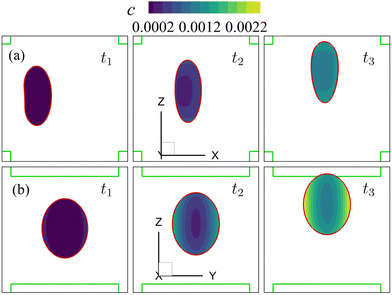 | ||
| Fig. 11 Instantaneous solute concentration inside the cell of Fig. 9 in the middle planes along (a) the y-axis and (b) the x-axis. | ||
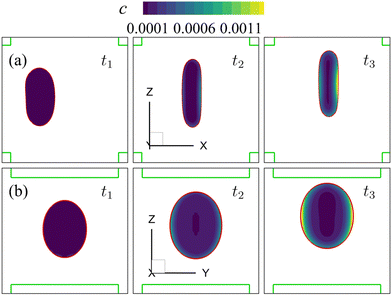 | ||
| Fig. 12 Instantaneous solute concentration inside the cell of Fig. 10 in the middle planes along (a) the y-axis and (b) the x-axis. | ||
With all other cell and flow parameters kept unchanged, we vary the cell membrane shear elasticity Gs and consider its effect on the maximum cell deformation and membrane damage in the channel cross-slot, as well as the volume-averaged solute concentration ![[c with combining macron]](https://www.rsc.org/images/entities/i_char_0063_0304.gif) l in the cell at the exit of the cross-slot region in the viscous and moderate-inertia flow regimes. The results are presented in Fig. 13.
l in the cell at the exit of the cross-slot region in the viscous and moderate-inertia flow regimes. The results are presented in Fig. 13.
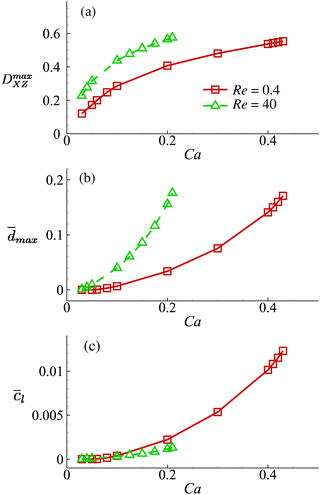 | ||
Fig. 13 Effect of the cell membrane shear elasticity on the (a) maximum Taylor deformation parameter DmaxXZ; (b) maximum area-averaged membrane damage variable ![[d with combining macron]](https://www.rsc.org/images/entities/i_char_0064_0304.gif) max and (c) volume-averaged solute concentration within the cell when it leaves the cross-slot region at Re = 0.4 and 40. Cell membrane shear elasticity is related to the capillary number by Gs = μoutU/Ca. Other parameters are the same as those of Fig. 8. For the cell at Re = 40, we only show results for Ca ≤ 0.21, since at even high Ca the cell will have complete local membrane damage with dmax = 1. From Fig. 13, we can find that the general conclusions drawn from Fig. 8 are robust with respect to the cell membrane shear elasticity. For all Gs values considered, the cell always has larger deformation and greater membrane damage when flowing through the channel cross-slot region in the inertial flow regime. However, this does not necessarily lead to increased intracellular solute transport due to the much shorter dimensional residence time in the channel cross-slot. max and (c) volume-averaged solute concentration within the cell when it leaves the cross-slot region at Re = 0.4 and 40. Cell membrane shear elasticity is related to the capillary number by Gs = μoutU/Ca. Other parameters are the same as those of Fig. 8. For the cell at Re = 40, we only show results for Ca ≤ 0.21, since at even high Ca the cell will have complete local membrane damage with dmax = 1. From Fig. 13, we can find that the general conclusions drawn from Fig. 8 are robust with respect to the cell membrane shear elasticity. For all Gs values considered, the cell always has larger deformation and greater membrane damage when flowing through the channel cross-slot region in the inertial flow regime. However, this does not necessarily lead to increased intracellular solute transport due to the much shorter dimensional residence time in the channel cross-slot. | ||
4.2. Effect of cell membrane viscosity
In this section, we consider a cell with a viscoelastic membrane, focusing on the effect of the membrane viscosity on the membrane damage and the associated intracellular solute transport. The membrane elasticity and its damage follow the same models with identical parameters that are used in Fig. 8 of Section 4.1, and we add the membrane viscosity using eqn (1). We conduct numerical simulations with increasing cell membrane viscosity η from 0 to 40. Note that in an earlier study, membrane viscosity on the order of η = 10 was reported for human leukaemia cells64 flowing through a constricted microchannel.
Fig. 14(a–c) respectively show the time evolutions of the Taylor deformation parameter DXZ, the area-averaged membrane damage variable ![[d with combining macron]](https://www.rsc.org/images/entities/i_char_0064_0304.gif) and the volume-averaged solute concentration inside the cell
and the volume-averaged solute concentration inside the cell ![[c with combining macron]](https://www.rsc.org/images/entities/i_char_0063_0304.gif) for the cell of Fig. 8 with increasing membrane viscosity in both flow regimes.
for the cell of Fig. 8 with increasing membrane viscosity in both flow regimes.
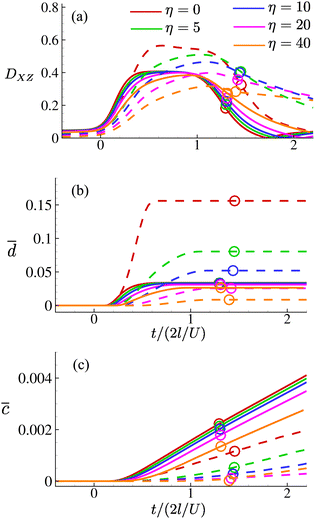 | ||
Fig. 14 Time evolutions of (a) the Taylor deformation parameter DXZ; (b) area-averaged membrane damage ![[d with combining macron]](https://www.rsc.org/images/entities/i_char_0064_0304.gif) ; and (c) volume-averaged concentration ; and (c) volume-averaged concentration ![[c with combining macron]](https://www.rsc.org/images/entities/i_char_0063_0304.gif) of the cell of Fig. 8 with increasing membrane viscosity η in the viscous (solid lines) and moderate-inertia (dashed lines) flow regimes, at Re = 0.4 and 40, respectively. of the cell of Fig. 8 with increasing membrane viscosity η in the viscous (solid lines) and moderate-inertia (dashed lines) flow regimes, at Re = 0.4 and 40, respectively. | ||
In general, the membrane viscosity slows down the cell deformation. This has much more significant effects when the cell is flowing in the moderate-inertia regime, where the flow speed is much higher and the residence time of the cell in the channel cross-slot is much shorter, compared with the viscous regime. The slow deformation and short residence time have led to the a cell with high membrane viscosity reaching a much lower maximum deformation in the channel cross-slot, as can be seen from Fig. 14(a). The results of the area-averaged membrane damage variable ![[d with combining macron]](https://www.rsc.org/images/entities/i_char_0064_0304.gif) follow a similar trend, showing that the membrane viscosity can significantly reduce the cell membrane damage in the inertial flow regime, leading to much less solute entering the cell in the channel cross-slot (see Fig. 14(c)). Interestingly, we find that with η ≥ 20 the maximum Taylor deformation parameter and area-averaged membrane damage variable of a cell at Re = 40 have both become lower than those of the same cell at Re = 0.4. This is in contrast to the results observed from hyperelastic cells of Section 4.1, for which the cell deformation and membrane damage are always larger in the inertial flow regime.
follow a similar trend, showing that the membrane viscosity can significantly reduce the cell membrane damage in the inertial flow regime, leading to much less solute entering the cell in the channel cross-slot (see Fig. 14(c)). Interestingly, we find that with η ≥ 20 the maximum Taylor deformation parameter and area-averaged membrane damage variable of a cell at Re = 40 have both become lower than those of the same cell at Re = 0.4. This is in contrast to the results observed from hyperelastic cells of Section 4.1, for which the cell deformation and membrane damage are always larger in the inertial flow regime.
4.3. Spiral flow regime
We also consider a cell with a viscoelastic membrane flowing through the channel cross-slot region under the spiral flow regime at Re = 80. The undisturbed background flow has been shown in Fig. 7(c and d). Fig. 15 presents the instantaneous shape deformation and membrane damage profiles of the cell of Fig. 14 with η = 10. In the figure, the trajectory of the cell's mass centre is marked by a solid line. Compared with the viscous and moderate-inertia flow regimes (see Fig. 9 and 10), a distinct feature of the cell motion in the spiral flow regime is that its trajectory is helical. Specifically, rather than directly flowing through the channel cross-slot region via the close proximity of the stagnation point at the centre region in the viscous and moderate-inertia flow regimes, the cell rotates around the z-axis for about 540° before leaving the cross-slot in the spiral flow at Re = 80. This helical trajectory, compared with a directly flow-through scenario, helps to increase the cell's residence time in the cross-slot, giving it more time to deform under the flow extension.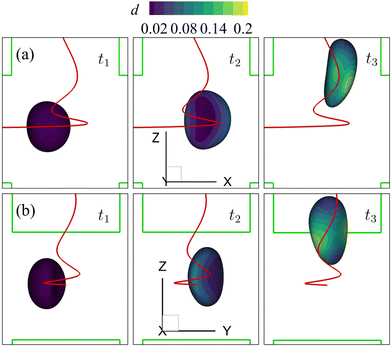 | ||
| Fig. 15 Instantaneous membrane damage profiles of the cell of Fig. 14 with η = 10 in the spiral flow regime at Re = 80, as seen from (a) the y-axis and (b) the x-axis. The solid lines are the trajectories of the cell's mass centre. t1, t2, and t3 are three dimensionless times at 0.30, 0.77 and 1.50, respectively. | ||
Fig. 16(a–c) present the time evolutions of a3/(2a), the area-averaged membrane damage variable ![[d with combining macron]](https://www.rsc.org/images/entities/i_char_0064_0304.gif) and the volume-averaged solute concentration inside the cell of Fig. 15 in all three flow regimes. Under the combined effects of the strongest inertial force and the increased residence time due to the helical flow trajectory, the cell flowing at Re = 80 has the maximum deformation and area-averaged membrane damage. These have also led to a slightly higher volume-averaged solute concentration inside the cell at the exit of the channel cross-slot, compared with the cell at Re = 40.
and the volume-averaged solute concentration inside the cell of Fig. 15 in all three flow regimes. Under the combined effects of the strongest inertial force and the increased residence time due to the helical flow trajectory, the cell flowing at Re = 80 has the maximum deformation and area-averaged membrane damage. These have also led to a slightly higher volume-averaged solute concentration inside the cell at the exit of the channel cross-slot, compared with the cell at Re = 40.
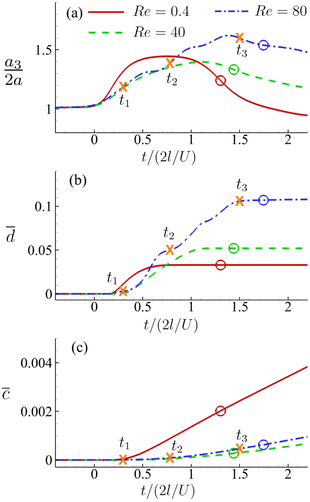 | ||
Fig. 16 Time evolutions of the (a) normalised cell height  , (b) area-averaged membrane damage variable , (b) area-averaged membrane damage variable ![[d with combining macron]](https://www.rsc.org/images/entities/i_char_0064_0304.gif) and (c) volume-averaged solute concentration and (c) volume-averaged solute concentration ![[c with combining macron]](https://www.rsc.org/images/entities/i_char_0063_0304.gif) inside the cell of Fig. 15 in the three flow regimes at Re = 0.4, 40 and 80, respectively. The three time instances t1, t2, and t3 are from Fig. 15 where the instantaneous cell profiles are shown. inside the cell of Fig. 15 in the three flow regimes at Re = 0.4, 40 and 80, respectively. The three time instances t1, t2, and t3 are from Fig. 15 where the instantaneous cell profiles are shown. | ||
For the cell of Fig. 16, we increase its membrane viscosity to η = 40, while keeping all other parameters the same, and present the results in Fig. 17. At Re = 80, despite the strongest inertial force and increased residence time, both the maximum cell deformation and area-averaged membrane damage have fallen below those of the cell flowing at Re = 0.4 in the viscous flow regime. The results therefore confirm our early conclusion that the cell membrane viscosity tends to protect the cell from large deformation and membrane damage when it is flowing through the channel cross-slot, in particular in the inertial flow regime.
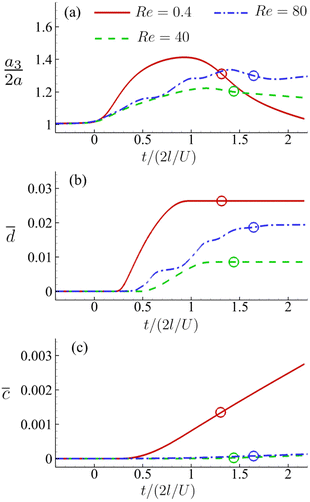 | ||
Fig. 17 Time evolutions of the (a) normalised cell height  , (b) area-averaged membrane damage variable , (b) area-averaged membrane damage variable ![[d with combining macron]](https://www.rsc.org/images/entities/i_char_0064_0304.gif) and (c) volume-averaged solute concentration and (c) volume-averaged solute concentration ![[c with combining macron]](https://www.rsc.org/images/entities/i_char_0063_0304.gif) inside the cell of Fig. 14 with a higher membrane viscosity η = 40 at Re = 0.4, 40 and 80. inside the cell of Fig. 14 with a higher membrane viscosity η = 40 at Re = 0.4, 40 and 80. | ||
In Fig. 18 we summarise the maximum area-averaged membrane damage of the cell considered in the present study with different cell membrane viscosity values in the three flow regimes that are driven by the same pressure drop across the whole device. The results reveal distinct membrane damage features that are strongly affected by the membrane viscosity.
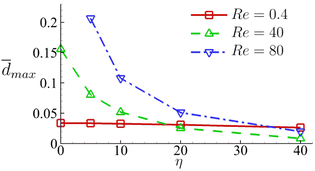 | ||
Fig. 18 Maximum area-averaged membrane damage ![[d with combining macron]](https://www.rsc.org/images/entities/i_char_0064_0304.gif) max as a function of membrane viscosity η in the three flow regimes at Re = 0.4, 40 and 80 respectively. max as a function of membrane viscosity η in the three flow regimes at Re = 0.4, 40 and 80 respectively. | ||
The results suggest that for cells with low membrane viscosity, e.g., η ≤ 10, driving low-viscosity suspension at a high speed in the inertial flow regime will lead to higher level of cell deformation and membrane damage. However, the enhancements can be significantly reduced or even reversed with an increase of the cell membrane viscosity. For cells with high membrane viscosity, e.g., η = 40, operating experiments with a high-viscosity suspension can be more effective in enhancing cell deformation and membrane damage.
5. Conclusions
A novel three-dimensional computational framework has been proposed in the present study, which can, for the first time, simultaneously take into account the transient flow-induced deformation of a viscoelastic biological cell, the deformation-induced cell membrane damage, as well as the damage-resulted membrane mechanical weakening and enhanced cross-membrane intracellular mass transport. With the computational framework, we have considered an initially spherical cell flowing through a cross-slot microchannel, focusing on the effects of the flow regimes, under comparable pressure drop across the whole device, and the cell membrane viscosity on the cell deformation, membrane damage and enhanced intracellular mass transport. Our numerical simulations have generated novel and interesting results, suggesting distinct cell dynamics and membrane damage features that strongly depend on the cell membrane viscosity. We find that for cells with relatively low membrane viscosity, e.g., η ≤ 10, operating experiments in the inertial flow regime, that can be achieved by driving a low-viscosity suspension at a high speed, often results in larger cell deformation and membrane damage, due to the effect of the flow inertia. Increasing the cell membrane viscosity slows down the cell deformation, and can lead to considerably smaller cell deformation and membrane damage, when a cell flows through the cross-slot region within a short time period and therefore does not have sufficient time to deform. Thus, for cells with high membrane viscosity, e.g., η = 40, in order to enhance the deformation-induced membrane damage, it could be advantageous to operate experiments in the viscous flow regime, where one drives a high-viscosity suspension at a low speed, offering sufficient residence time for the cell to develop its deformation in the channel cross-slot region. The present simulation results may provide useful guidelines to practical experiments, which flow cells through cross-slot microchannels to temporarily damage cell membranes to enhance intracellular drug delivery.As a general computational framework for modelling the flow-induced cell membrane damage and the resulted enhanced intracellular mass transport, the present model will need to be validated against carefully designed experiments in future. Such validations are presently not possible, due to the lack of quantitative experimental data, that record the time evolutions of the cell membrane damage and solute concentration inside and around a cell. Once validated, the computational framework may be used in a wide range of applications, ranging from designing microfluidic devices to physically disrupt the cell membrane for enhanced drug delivery, to optimising flow conditions to minimise cell damage in cell printers and other inertial microfluidics.
Author contributions
Y. S. and R. X. L. designed the computational model and the research problem. R. X. L. wrote the codes and conducted the numerical simulations. All authors analysed the results, prepared the figures, wrote and reviewed the manuscript.Conflicts of interest
There are no conflicts to declare.Appendix
A. LBM model for mass transport
We use the D3Q7 model (three-dimensional seven discrete micro velocities) to formulate a convection–diffusion LBM model for mass transport. The discrete micro velocities are defined as | (26) |
Similar to the LBM used in the fluid flow, fictive particles with velocity ci can propagate and collide on a discrete lattice mesh and form a concentration distribution function gi(x, t) at the position x and time t. The temporal evolution of the concentration distribution function can be divided into the collision and streaming processes:
• the collision process
 | (27) |
• and the streaming process
 | (28) |
 | (29) |
The LBM becomes unstable when the dimensionless relaxation time is close to 1/2 with the BGK collision. To avoid the numerical instability, we reconstruct the non-equilibrium distribution gneqi, following the method of Zhang et al.,77 by expanding the non-equilibrium distribution with the Hermite polynomial:
 | (30) |
 | (31) |
 | (32) |
 | (33) |
Acknowledgements
R. X. L. acknowledges the PhD studentship provided by the QMUL and the Chinese Scholarship Council. The simulations were performed using the high-performance computer clusters of QMUL (funded by the UK EPSRC grant EP/K000128/1, EP/P020194/1 and EP/T022213/1). Y. S. acknowledges financial support from the UK Royal Society (IES/R2/212075).Notes and references
- M. P. Stewart, R. Langer and K. F. Jensen, Chem. Rev., 2018, 118, 7409–7531 CrossRef CAS PubMed.
- F. J. Cunningham, N. S. Goh, G. S. Demirer, J. L. Matos and M. P. Landry, Trends Biotechnol., 2018, 36, 882–897 CrossRef CAS PubMed.
- A. Wadhwa, A. Aljabbari, A. Lokras, C. Foged and A. Thakur, Pharmaceutics, 2020, 12, 102 CrossRef CAS PubMed.
- J. Hur and A. J. Chung, Adv. Sci., 2021, 8, 2004595 CrossRef CAS PubMed.
- A.-R. Shokouhi, Y. Chen, H. Z. Yoh, J. Brenker, T. Alan, T. Murayama, K. Suu, Y. Morikawa, N. H. Voelcker and R. Elnathan, Adv. Mater., 2023, 2304122 CrossRef CAS PubMed.
- H. Li, T. Y. Tsui and W. Ma, Int. J. Mol. Sci., 2015, 16, 19518–19536 CrossRef CAS PubMed.
- J. Yang, A. Bahreman, G. Daudey, J. Bussmann, R. C. Olsthoorn and A. Kros, ACS Cent. Sci., 2016, 2, 621–630 CrossRef CAS PubMed.
- D. J. Stevenson, F. J. Gunn-Moore, P. Campbell and K. Dholakia, J. R. Soc., Interface, 2010, 7, 863–871 CrossRef CAS PubMed.
- Y. Cao, E. Ma, S. Cestellos-Blanco, B. Zhang, R. Qiu, Y. Su, J. A. Doudna and P. Yang, Proc. Natl. Acad. Sci. U. S. A., 2019, 116, 7899–7904 CrossRef CAS PubMed.
- M. E. Kizer, Y. Deng, G. Kang, P. E. Mikael, X. Wang and A. J. Chung, Lab Chip, 2019, 19, 1747–1754 RSC.
- A. Sharei, J. Zoldan, A. Adamo, W. Y. Sim, N. Cho, E. Jackson, S. Mao, S. Schneider, M.-J. Han and A. Lytton-Jean, et al. , Proc. Natl. Acad. Sci. U. S. A., 2013, 110, 2082–2087 CrossRef CAS PubMed.
- A. Uvizl, R. Goswami, S. D. Gandhi, M. Augsburg, F. Buchholz, J. Guck, J. Mansfeld and S. Girardo, Lab Chip, 2021, 21, 2437–2452 RSC.
- C. Kwon and A. J. Chung, Lab Chip, 2023, 23, 1758–1767 RSC.
- G. Kang, D. W. Carlson, T. H. Kang, S. Lee, S. J. Haward, I. Choi, A. Q. Shen and A. J. Chung, ACS Nano, 2020, 14, 3048–3058 CrossRef CAS PubMed.
- Y. Deng, S. P. Davis, F. Yang, K. S. Paulsen, M. Kumar, R. Sinnott DeVaux, X. Wang, D. S. Conklin, A. Oberai, J. I. Herschkowitz and A. J. Chung, Small, 2017, 13, 1700705 CrossRef PubMed.
- O. S. Pak, Y. N. Young, G. R. Marple, S. Veerapaneni and H. A. Stone, Proc. Natl. Acad. Sci. U. S. A., 2015, 112, 9822–9827 CrossRef CAS PubMed.
- E. A. Evans, R. Waugh and L. Melnik, Biophys. J., 1976, 16, 585–595 CrossRef CAS PubMed.
- M. Lokhandwalla and B. Sturtevant, Phys. Med. Biol., 2001, 46, 413 CrossRef CAS PubMed.
- S. T. Braakman, R. M. Pedrigi, A. T. Read, J. A. Smith, W. D. Stamer, C. R. Ethier and D. R. Overby, Exp. Eye Res., 2014, 127, 224–235 CrossRef CAS PubMed.
- J. M. Meacham, K. Durvasula, F. L. Degertekin and A. G. Fedorov, Sci. Rep., 2018, 8, 3727 CrossRef PubMed.
- M. Razizadeh, M. Nikfar, R. Paul and Y. Liu, Biophys. J., 2020, 119, 471–482 CrossRef CAS PubMed.
- P. L. McNeil and R. A. Steinhardt, Annu. Rev. Cell Dev. Biol., 2003, 19, 697 CrossRef CAS PubMed.
- S. Sohrabi and Y. Liu, Artif. Organs, 2017, 41, E80–E91 CrossRef CAS PubMed.
- M. Nikfar, M. Razizadeh, R. Paul and Y. Liu, Microfluid. Nanofluidics, 2020, 24, 1–13 CrossRef.
- M. Nikfar, M. Razizadeh, J. Zhang, R. Paul, Z. J. Wu and Y. Liu, Artif. Organs, 2020, 44, E348–E368 CrossRef CAS PubMed.
- M. Nikfar, M. Razizadeh, R. Paul, Y. Zhou and Y. Liu, Biomicrofluidics, 2021, 15, 044102 CrossRef CAS PubMed.
- K. Islam, M. Razizadeh and Y. Liu, Phys. Chem. Chem. Phys., 2023, 25, 12308–12321 RSC.
- Z. Y. Luo and B. F. Bai, Phys. Fluids, 2019, 31, 121902 CrossRef.
- H. Zhang, Z. Shen, B. Hogan, A. I. Barakat and C. Misbah, Biophys. J., 2018, 115, 2218–2229 CrossRef CAS PubMed.
- H. Zhang and C. Misbah, Comput. Fluids, 2019, 187, 46–59 CrossRef CAS.
- Z. Gou, H. Zhang, M. Abbasi and C. Misbah, Biophys. J., 2021, 120, 4819–4831 CrossRef CAS PubMed.
- Z. Gou, H. Zhang and C. Misbah, J. R. Soc., Interface, 2023, 20, 20230186 CrossRef CAS PubMed.
- D. Barthès-Biesel and H. Sgaier, J. Fluid Mech., 1985, 160, 119–135 CrossRef.
- A. Yazdani and P. Bagchi, J. Fluid Mech., 2013, 718, 569–595 CrossRef CAS.
- D. Cordasco and P. Bagchi, Phys. Fluids, 2017, 29, 041901 CrossRef.
- F. Guglietta, M. Behr, L. Biferale, G. Falcucci and M. Sbragaglia, Soft Matter, 2020, 16, 6191–6205 RSC.
- P. Li and J. Zhang, Cardiovasc. Eng. Technol., 2021, 12, 232–249 CrossRef PubMed.
- R. Lu, Z. Guo, P. Yu and Y. Sui, J. Fluid Mech., 2023, 962, A26 CrossRef CAS.
- J. Hokanson and S. Yazdani, Mech. Res. Commun., 1997, 24, 151–159 CrossRef.
- A. Natali, P. Pavan, E. L. Carniel, M. Lucisano and G. Taglialavoro, Med. Eng. Phys., 2005, 27, 209–214 CrossRef CAS PubMed.
- X. Deng, A. Korobenko, J. Yan and Y. Bazilevs, Comput. Methods Appl. Mech. Eng., 2015, 284, 349–372 CrossRef.
- G. A. Holzapfel and B. Fereidoonnezhad, Biomechanics of living organs, Elsevier, 2017, pp. 101–123 Search PubMed.
- S. J. Haward, R. J. Poole, M. A. Alves, P. J. Oliveira, N. Goldenfeld and A. Q. Shen, Phys. Rev. E, 2016, 93, 031101 CrossRef PubMed.
- K. Kechagidis, B. Owen, L. Guillou, H. Tse, D. Di Carlo and T. Krüger, Microsyst. Nanoeng., 2023, 9, 100 CrossRef CAS PubMed.
- R. Skalak, A. Tozeren, R. Zarda and S. Chien, Biophys. J., 1973, 13, 245–264 CrossRef CAS PubMed.
- O.-Y. Zhong-Can and W. Helfrich, Phys. Rev. A: At., Mol., Opt. Phys., 1989, 39, 5280 CrossRef PubMed.
- N. Grandmaison, D. Brancherie and A.-V. Salsac, J. Fluid Mech., 2021, 914, A25 CrossRef CAS PubMed.
- J.-J. Marigo, C. R. Acad. Sci. Paris, 1981, 292, 1309–1312 Search PubMed.
- J. C. Simo, Comput. Methods Appl. Mech. Eng., 1987, 60, 153–173 CrossRef.
- E. Peña, B. Calvo, M. Martnez and M. Doblaré, Int. J. Numer. Methods Eng., 2008, 74, 1198–1218 CrossRef.
- Y. Hamiel, Y. Liu, V. Lyakhovsky, Y. Ben-Zion and D. Lockner, Geophys. J. Int., 2004, 159, 1155–1165 CrossRef.
- S. Hosseini, J. J. Remmers and R. De Borst, Int. J. Numer. Methods Eng., 2014, 98, 391–398 CrossRef.
- K. M. Hämäläinen, K. Kontturi, S. Auriola, L. Murtomäki and A. Urtti, J. Controlled Release, 1997, 49, 97–104 CrossRef.
- O. Hosoya, S. Chono, Y. Saso, K. Juni, K. Morimoto and T. Seki, J. Pharm. Pharmacol., 2004, 56, 1501–1507 CrossRef CAS PubMed.
- E. M. Renkin, J. Gen. Physiol., 1954, 38, 225 CAS.
- X. Lin, Q. Yang, L. Ding and B. Su, ACS Nano, 2015, 9, 11266–11277 CrossRef CAS PubMed.
- J. T. Edward, J. Chem. Educ., 1970, 47, 261 CrossRef CAS.
- Y. Sui, Y. T. Chew, P. Roy, Y. P. Cheng and H. T. Low, Phys. Fluids, 2008, 20, 112106 CrossRef.
- Y. Sui, Y.-T. Chew, P. Roy and H.-T. Low, J. Comput. Phys., 2008, 227, 6351–6371 CrossRef.
- Y. Sui, X. Chen, Y. Chew, P. Roy and H. Low, Comput. Fluids, 2010, 39, 242–250 CrossRef.
- Z. Wang, Y. Sui, A.-V. Salsac, D. Barthès-Biesel and W. Wang, J. Fluid Mech., 2016, 806, 603–626 CrossRef CAS.
- Z. Wang, Y. Sui, A.-V. Salsac, D. Barthès-Biesel and W. Wang, J. Fluid Mech., 2018, 849, 136–162 CrossRef CAS.
- R. Lu, Z. Wang, A.-V. Salsac, D. Barthès-Biesel, W. Wang and Y. Sui, J. Fluid Mech., 2021, 923, A11 CrossRef CAS.
- Z. Wang, R. Lu, W. Wang, F. Tian, J. Feng and Y. Sui, Biomech. Model. Mechanobiol., 2023, 1–15 Search PubMed.
- M. Bouzidi, M. Firdaouss and P. Lallemand, Phys. Fluids, 2001, 13, 3452–3459 CrossRef CAS.
- Z. Guo, C. Zheng and B. Shi, Phys. Fluids, 2002, 14, 2007–2010 CrossRef CAS.
- C. S. Peskin, Acta Numer., 2002, 11, 479–517 CrossRef.
- S. Ramanujan and C. Pozrikidis, J. Fluid Mech., 1998, 361, 117–143 CrossRef CAS.
- R. V. Garimella and B. K. Swartz, Curvature estimation for unstructured triangulations of surfaces, Los Alamos National Laboratory Technical Report LA-UR-03-8240, 2003 Search PubMed.
- A. Yazdani and P. Bagchi, Phys. Rev. E: Stat., Nonlinear, Soft Matter Phys., 2012, 85, 056308 CrossRef PubMed.
- J. Huang, Z. Hu and W.-A. Yong, J. Comput. Phys., 2016, 310, 26–44 CrossRef.
- F. A. Amiri and J. Zhang, Int. Commun. Heat Mass Transf., 2021, 128, 105601 CrossRef.
- T. L. Bergman, A. S. Lavine, F. P. Incropera and D. P. DeWitt, Introduction to heat transfer, John Wiley & Sons, 2011, pp. 303–304 Search PubMed.
- D. R. Gossett, H. T. Tse, S. A. Lee, Y. Ying, A. G. Lindgren, O. O. Yang, J. Rao, A. T. Clark and D. Di Carlo, Proc. Natl. Acad. Sci. U. S. A., 2012, 109, 7630–7635 CrossRef CAS PubMed.
- F. J. Armistead, J. G. De Pablo, H. Gadêlha, S. A. Peyman and S. D. Evans, Biophys. J., 2019, 116, 1127–1135 CrossRef CAS PubMed.
- C. Pozrikidis, Introduction to theoretical and computational fluid dynamics, Oxford University Press, 2011 Search PubMed.
- Z. Zhang, Z. Li and Y. Wu, Front. Phys., 2022, 10, 875628 CrossRef.
| This journal is © The Royal Society of Chemistry 2024 |

