Achieving outstanding energy storage behaviors via combinatorial optimization design in BNT-based relaxor ferroelectric ceramics under medium–low electric fields
Jian
Yang
 a,
Xiaolong
Zhu
a,
Haotian
Wang
a,
Yixiao
Zhang
a,
Pengfei
Guan
a,
Shiguang
Yan
b and
Ming
Zheng
a,
Xiaolong
Zhu
a,
Haotian
Wang
a,
Yixiao
Zhang
a,
Pengfei
Guan
a,
Shiguang
Yan
b and
Ming
Zheng
 *ab
*ab
aSchool of Materials Science and Physics, China University of Mining and Technology, Xuzhou 221116, China. E-mail: zhengm@mail.ustc.edu.cn
bKey Laboratory of Inorganic Functional Materials and Devices, Shanghai Institute of Ceramics, Chinese Academy of Sciences, Shanghai 200050, China
First published on 5th April 2024
Abstract
As the development of electronic components has become highly integrated and diversified, dielectric ceramic energy storage capacitors have attracted wide attention due to their high-power density, low cost and ability to operate at high temperatures. In this work, we have designed (0.8 − x)Bi0.5Na0.5TiO3–0.2BaZr0.3Ti0.7O3–xNaNbO3 (abbreviated as (0.8 − x)BNT–0.2BZT–xNN) lead-free relaxor ferroelectric ceramics and successfully optimized the energy storage performance by synergistically modifying critical factors affecting energy storage properties. The 0.7BNT–0.2BZT–0.1NN ceramic achieved high maximum polarization (Pmax = 42.1 μC cm−2), extremely low remnant polarization, recoverable energy storage density (Wrec = 3.53 J cm−3), efficiency (η = 93.5%) and Wrec/E = 160.45 J (kV m−2) under a medium–low electric field (E = 220 kV cm−1). The simultaneous achievement of high energy storage density and efficiency under lower electric fields is due to the expansion of the octahedral framework facilitated by Ba2+ and Zr4+, which promotes ion displacement. NaNbO3 can further improve relaxor behaviors, compensating for polarization losses caused by relaxation and enhancing breakdown field strength. Furthermore, it also exhibits excellent electric field stability (30–220 kV cm−1, Δη < 0.7%), thermal stability (20–140 °C, ΔWrec < 7.2%), and frequency stability (1–100 Hz, ΔWrec < 5.3%). This work provides an option for the selection of dielectric capacitors under limited electric field conditions.
1. Introduction
Energy storage technologies have been an indispensable topic for social development and progress. With the trend of electronic devices moving towards portability, miniaturization, and stabilization, the development of energy storage devices with small volume, low cost, wide operating temperature, and excellent performance is crucial. Ceramic-based dielectric capacitors, characterized by high power density, a wide operating temperature range, controllable and coordinated performance, and long cycle life, have become ideal for future pulse power systems.1–4The energy storage density of dielectric capacitors remains relatively low, still exhibiting a certain gap compared to batteries and electrochemical capacitors. Therefore, enhancing the energy storage density of dielectric capacitors has become an important challenge. The energy storage properties of dielectric capacitors can be evaluated using the following formulas:5–7
where Wtot, Wrec, and η represent the total energy density, recoverable energy density, and efficiency, respectively. Pmax, Pr, and E represent the maximum polarization, remnant polarization, and electric field, respectively. From the above formulas, it can be inferred that achieving high energy storage density in dielectric ceramic materials requires high Pmax, low Pr, and high breakdown field strength (Eb). For instance, Chen et al.8 introduced CaTi0.5Zr0.5O3 into the Bi0.5Na0.5TiO3–NaNbO3 matrix, which significantly altered the grain size and conductivity, leading to an increase in the Eb. Ultimately, BNT–NN/xCZT composites with x
![[thin space (1/6-em)]](https://www.rsc.org/images/entities/char_2009.gif) =
= ![[thin space (1/6-em)]](https://www.rsc.org/images/entities/char_2009.gif) 7
7![[thin space (1/6-em)]](https://www.rsc.org/images/entities/char_2009.gif) wt% achieved optimal energy storage properties (Wrec = 4.93 J cm−3, η = 93.3%) at 410 kV cm−1. Zhang et al.9 induced defect dipoles and reduced oxygen vacancy concentrations in Sr2NaNb5O15 through the doping of CuO. A high Wrec of 4.17 J cm−3 and an η of 89.5% are achieved under a medium electric field (∼350 kV cm−1). Li et al.10 introduced La3+ and Ta5+ ions into the A/B sites of antiferroelectric AgNbO3, which shifted the electric field-induced antiferroelectric-ferroelectric phase transition to higher fields. The Ag0.94La0.02Nb0.8Ta0.2O3 ceramic achieved a Wrec of 6.73 J cm−3 and an η of 74.1% under an electric field of 540 kV cm−1. Although higher Wrec can be achieved at higher electric field strengths, the contribution of the electric field to polarization is low. It typically requires Pmax at 400 kV cm−1 to achieve 40 μC cm−2. This limitation not only increases the energy loss during the charging process of dielectric capacitors, but also raises the risk and breakdown probability when operating under high electric fields. Additional insulation protection devices and driving instruments need to be applied to the capacitors, anticipating higher working electric field strengths. Therefore, it is necessary to develop dielectric energy storage materials capable of simultaneously achieving high energy density and energy storage efficiency under moderate to low electric fields (< 250 kV cm−1).
wt% achieved optimal energy storage properties (Wrec = 4.93 J cm−3, η = 93.3%) at 410 kV cm−1. Zhang et al.9 induced defect dipoles and reduced oxygen vacancy concentrations in Sr2NaNb5O15 through the doping of CuO. A high Wrec of 4.17 J cm−3 and an η of 89.5% are achieved under a medium electric field (∼350 kV cm−1). Li et al.10 introduced La3+ and Ta5+ ions into the A/B sites of antiferroelectric AgNbO3, which shifted the electric field-induced antiferroelectric-ferroelectric phase transition to higher fields. The Ag0.94La0.02Nb0.8Ta0.2O3 ceramic achieved a Wrec of 6.73 J cm−3 and an η of 74.1% under an electric field of 540 kV cm−1. Although higher Wrec can be achieved at higher electric field strengths, the contribution of the electric field to polarization is low. It typically requires Pmax at 400 kV cm−1 to achieve 40 μC cm−2. This limitation not only increases the energy loss during the charging process of dielectric capacitors, but also raises the risk and breakdown probability when operating under high electric fields. Additional insulation protection devices and driving instruments need to be applied to the capacitors, anticipating higher working electric field strengths. Therefore, it is necessary to develop dielectric energy storage materials capable of simultaneously achieving high energy density and energy storage efficiency under moderate to low electric fields (< 250 kV cm−1).
In this work, we introduced NaNbO3 (NN) into the 0.8Bi0.5Na0.5TiO3–0.2BaZr0.3Ti0.7O3 (BNT–BZT) matrix to construct the (0.8 − x)BNT–0.2BZT–xNN relaxor ferroelectric ceramics for achieving excellent energy storage behaviors. The design ideas of this work are shown in Fig. 1. The roles of the ferroelectrically active ions Bi3+, Na+, and Ti4+ are to generate locally correlated electric dipoles. The presence of Ba2+ and Zr4+ with larger ionic radii can expand the [AO12] cube-octahedral and [BO6] octahedral main frameworks, providing space for ion displacement while partially disrupting the long-range ordered ferroelectric domains.11,12 The BNT–BZT ceramic exhibits high Pmax, but the energy storage efficiency is still low due to the large Pr. Upon the introduction of NN, the macroscopic ferroelectric domains will be further disrupted, leading to significant reductions in Pr and the coercive field (Ec). The lone electrons in the outer 5s orbitals of Nb5+ and Na+ can compensate for the polarization loss caused by relaxation.13 In addition, the large bandgap of NN (∼3.58 eV) can enhance the insulation performance of the system, thus improving the Eb.14 Based on the above composition design, the 0.7BNT–0.2BZT–0.1NN ceramic exhibits weak local correlation but highly extendable unit polarization vectors, demonstrating high Pmax, extremely low Pr and excellent energy storage performance. It achieves Wrec = 3.53 J cm−3, η = 93.5%, and W/E = 160.45 J (kV m−2) under medium–low electric fields (220 kV cm−1).
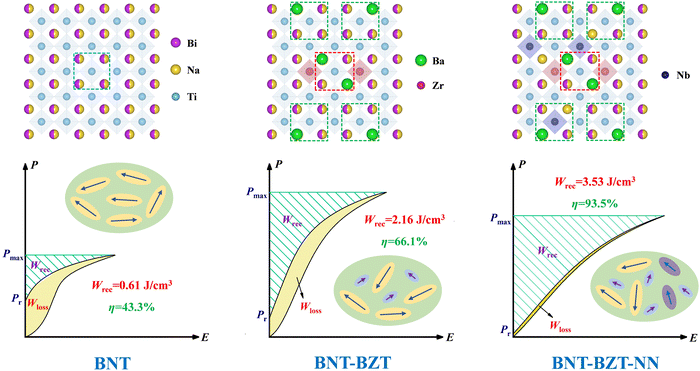 | ||
| Fig. 1 The design strategy for improving energy storage behaviors of (0.8 − x)BNT–0.2BZT–xNN ceramics. | ||
2. Experimental
Materials preparation: (0.8 − x)BNT–0.2BZT–xNN (x = 0, 0.1, 0.2, and 0.3) ceramics were prepared via the conventional solid-state reaction method using Bi2O3(99%), Na2CO3(99.8%), BaCO3(99%), TiO2(99%), ZrO2(99%), and Nb2O5(99.5%) as raw materials. The raw materials were first weighed according to the stoichiometric ratio. They were then milled in an attrition mill using anhydrous ethanol as the milling medium for 12 h in a planetary ball mill and dried. Subsequently, the mixed powders were sintered at 850 °C for 4 h, subjected to secondary milling for 12 hours, and dried again. After drying, the powders were thoroughly mixed and ground with a 5 wt% polyvinyl alcohol (PVA) solution. The resulting powder was pressed into discs with a diameter of 8 mm and a thickness of 0.5 mm, followed by sintering. The sintering process involved two steps: 1. Holding at 650 °C for 2 h to remove PVA with a heating rate of 4 °C min−1. 2. Upon completion of removing PVA, ramping up to 1090 °C and holding for 2 h for the final sintering, with a heating rate of 5 °C min−1.Characterization: The crystal structure and phase composition information of (0.8 − x)BNT–0.2BZT–xNN ceramics were obtained through X-ray diffraction (XRD, D8 Advanced, Bruker, Germany). The surface morphology images of the samples were photographed using a field emission scanning electron microscope (FESEM, SU8220, Japan). The dielectric properties of the ceramics were measured at different temperatures and frequencies using a Wayne Kerr 6500B system. The room temperature ferroelectric properties (1 Hz, 20 °C), thermal stability (1 Hz, 20–140 °C) and frequency stability (1 Hz–100 Hz, 20 °C) were recorded with a ferroelectric analyzer (TF Analyzer 3000E, Germany).
3. Results and discussion
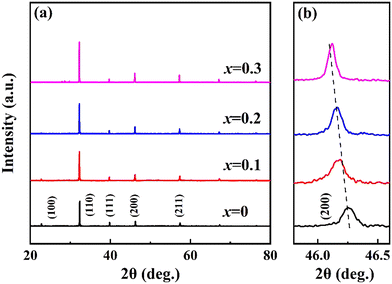
Fig. 2(a) shows the XRD patterns of (0.8 − x)BNT–0.2BZT–xNN ceramics. All ceramic compositions exhibit a single perovskite structure without observable secondary phases, indicating that NN enters the BNT–BZT matrix to form a stable solid solution. As shown in Fig. 2(b), the peak position of the (200) diffraction peak gradually shifts to lower angles with increasing NN content. It is due to the lattice expansion caused by the substitution of Ti4+ (0.605 Å, CN = 6) with Nb5+ (0.64 Å, CN = 6) with a larger ionic radius.15,16 The tolerance factor, which measures the stability of the perovskite system, can be calculated using the following equation: , where RA, RB and RO represent ionic radii of the A-site, B-site, and oxygen ions, respectively.17 The tolerance factors of (0.8 − x)BNT–0.2BZT–xNN ceramics are 0.9848, 0.9845, 0.9842, and 0.9839, respectively. A decrease in the tolerance factor will cause a change in the direction of close-packed crystal planes for t < 1. The larger interstitial sites in the lattice facilitate the occurrence of ion displacement, relaxation behaviors and antiferroelectric distortion.
The surface microstructure images of (0.8 − x)BNT–BZT–xNN ceramics are shown in Fig. 3(a)–(d). The grain boundaries of all samples are clear, and the grains are regular and compact with almost no visible pores. Approximately 100 grains are selected for the statistical analysis of the mean grain size, determined using the intercept method, as shown in Fig. 3(e). Initially, with the increase in x, the grain size decreased from 1.09 μm at x = 0 to 0.79 μm at x = 0.1. It is explained that the substitution of larger ionic radius and atomic weight Nb5+ for Ti4+ increases the lattice strain energy, and the diffusion coefficient of Nb5+ is low, which inhibits crystal growth.18,19 However, as the NN content further increases, the average grain size increases from 0.79 μm at x = 0.1 to 1.23 μm at x = 0.3. This phenomenon is closely associated with the defect structure within the ceramic material. The volatilization of Na+ and Bi3+ introduces oxygen vacancies. During the high temperature sintering process, these vacancies facilitate mass transport within the ceramic, resulting in an enlargement of the grain size.20 High density and low porosity are beneficial for improving the breakdown field strength of the ceramics.
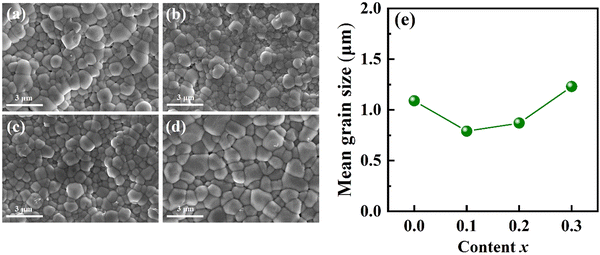 | ||
| Fig. 3 (a)–(d) SEM images and (e) mean grain size with the increase of content x of (0.8 − x)BNT–BZT–xNN ceramics. | ||
Fig. 4(a)–(d) show the temperature-dependent behaviors of the dielectric constants (εr) and dielectric losses (tan![[thin space (1/6-em)]](https://www.rsc.org/images/entities/char_2009.gif) δ) of (0.8 − x)BNT–BZT–xNN ceramics in the frequency range of 1 kHz to 1 MHz. All samples exhibit characteristics of relaxor behaviors, including diffuse phase transitions and frequency dispersion. In undoped NN samples, two distinct dielectric peaks (Ts) and (Tm) are observed. Ts corresponds to the thermal evolution of discrete polar nanoregions, while Tm corresponds to the phase transition from rhombohedral to tetragonal phases.21 With the addition of NN, the Ts peaks significantly shift towards lower temperatures, corresponding to approximately 87.6 °C, 51.5 °C, and 20 °C, while the Tm peaks disappear. This phenomenon can be attributed to the stabilization of the P4bm polar nanoregions (PNRs) at high temperatures, leading to the observation of only low-temperature Ts anomaly transition peaks in the εr-T curves.22 Similar features were also observed in other BNT-based ceramics modified with NaNbO3, CaZrO3, and NbTaO3.23–25 It is noteworthy that the weak peaks (Tc) appear in the high-temperature region [Fig. 4(b)–(d)], which is attributed to the contribution of the NN antiferroelectric phase.26 The εr gradually decreases with the increase in NN content. It can be explained by the increased compositional disorder, diffusion of polar nanoregions, and reorientation of ferroelectric domains, resulting in a dilution effect.27 Furthermore, all samples exhibit relatively low dielectric losses (<0.15) from 20 °C to 450 °C, indicating their strong insulation capability over a wide temperature range.
δ) of (0.8 − x)BNT–BZT–xNN ceramics in the frequency range of 1 kHz to 1 MHz. All samples exhibit characteristics of relaxor behaviors, including diffuse phase transitions and frequency dispersion. In undoped NN samples, two distinct dielectric peaks (Ts) and (Tm) are observed. Ts corresponds to the thermal evolution of discrete polar nanoregions, while Tm corresponds to the phase transition from rhombohedral to tetragonal phases.21 With the addition of NN, the Ts peaks significantly shift towards lower temperatures, corresponding to approximately 87.6 °C, 51.5 °C, and 20 °C, while the Tm peaks disappear. This phenomenon can be attributed to the stabilization of the P4bm polar nanoregions (PNRs) at high temperatures, leading to the observation of only low-temperature Ts anomaly transition peaks in the εr-T curves.22 Similar features were also observed in other BNT-based ceramics modified with NaNbO3, CaZrO3, and NbTaO3.23–25 It is noteworthy that the weak peaks (Tc) appear in the high-temperature region [Fig. 4(b)–(d)], which is attributed to the contribution of the NN antiferroelectric phase.26 The εr gradually decreases with the increase in NN content. It can be explained by the increased compositional disorder, diffusion of polar nanoregions, and reorientation of ferroelectric domains, resulting in a dilution effect.27 Furthermore, all samples exhibit relatively low dielectric losses (<0.15) from 20 °C to 450 °C, indicating their strong insulation capability over a wide temperature range.
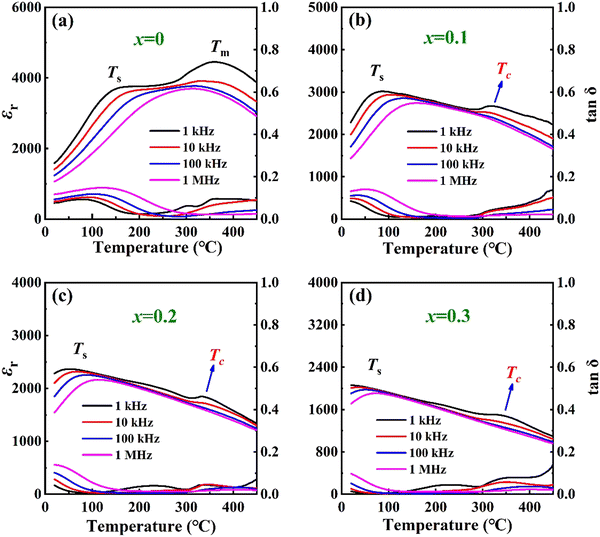 | ||
Fig. 4 (a)–(d) Temperature dependence of εr and tan![[thin space (1/6-em)]](https://www.rsc.org/images/entities/char_2009.gif) δ of (0.8 − x)BNT–BZT–xNN ceramics at different frequencies. δ of (0.8 − x)BNT–BZT–xNN ceramics at different frequencies. | ||
In order to evaluate the ferroelectric properties of (0.8 − x)BNT–BZT–xNN ceramics, Fig. 5(a) and (b) illustrate the biaxial P–E loops and variations of important parameters at 100 kV cm−1. The sample with x = 0 exhibits the highest Pmax and ΔP. However, this composition exhibits strong hysteresis and saturation polarization tendencies, which are not suitable for energy storage. After the introduction of NN, the P–E loops exhibit a more elongated and linear shape. These elongated P–E loops can reduce polarization losses during charging and discharging processes, thereby increasing energy storage density. Both Pmax and ΔP (Pmax–Pr) gradually decrease with increasing x content, while Pr decreases initially and then stabilizes. These results are consistent with the observations from the εr–T curves, attributed to the disruption of partial long-range order in the system by A-site Na+ and B-site Nb5+, thereby increasing the relaxor behaviors of ceramics. The formation of polar nanoregions is facilitated by the presence of local disorder, and the recovery of ferroelectric domains to their initial orientations upon the removal of external electric fields is made easier by the existence of local random electric fields. Furthermore, the gradual increase in the content of the weakly polar P4bm phase, along with these factors, collectively contributes to the decrease in both Pmax and Pr.
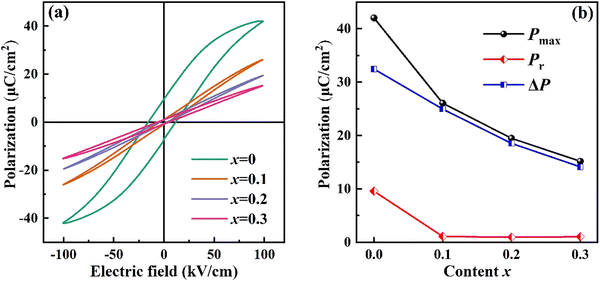 | ||
| Fig. 5 (a) The bipolar P–E loops at 100 kV cm−1 of (0.8 − x)BNT–BZT–xNN ceramics and (b) Pmax, Pr and ΔP (Pmax–Pr) as a function of x content. | ||
Fig. 6(a) displays the unipolar P–E loops of (0.8 − x)BNT–BZT–xNN ceramic samples under critical electric fields, in order to comprehensively evaluate their energy storage performance. It is obvious that the curvature of the P–E loops decreases with an increase in the NN content due to the delayed saturation of polarization saturation. For samples with NN content ranging from 0 to 0.3, the Eb is measured to be 170, 220, 230 and 250 kV cm−1, respectively. As expected, NN widened the bandgap of the system and improved its insulating properties, resulting in an enhanced Eb. The values for Wrec and η of (0.8 − x)BNT–BZT–xNN ceramics were calculated from the unipolar P–E loops and are presented in Fig. 6(b). The Wrec and η increased from 2.16 J cm−3 and 66.1% for x = 0 to 3.53 J cm−3 and 93.5% for x = 0.1, respectively, resulting in a percentage change of 63.4% and 41.5%, respectively. However, Wrec and η slightly decreased with the further increase in x. This decrease is primarily attributed to the enhancement of relaxor behaviors and the merging of domain switching caused by the reinforcement of antiferroelectric phases. The delay of polarization saturation, the improvement of relaxation and the increase in Eb significantly enhance the energy storage capability of (0.8 − x)BNT–BZT–xNN ceramics.
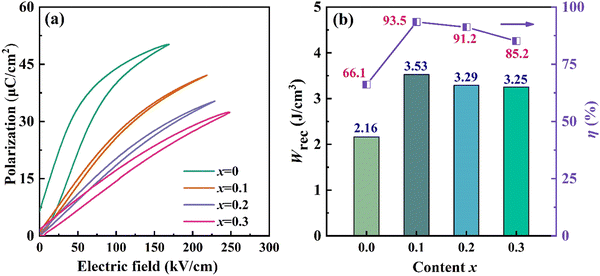 | ||
| Fig. 6 (a) Unipolar P–E loops at critical electric fields of (0.8 − x)BNT–BZT–xNN ceramics and (b) Wrec and η are calculated from (a). | ||
Fig. 7(a)–(f) show the unipolar P–E loops, Wrec, and η of (1 − x)BNT–BZT–xNN ceramics (x = 0–0.2) under different electric fields. The overall shape of the P–E loops for all samples remained unchanged as the electric field increased, while Wrec almost linearly increased with the electric field. In the sample with x = 0, Pmax increased from 11.6 μC cm−2 at 30 kV cm−1 to 50.2 μC cm−2 at 170 kV cm−1. Owing to the presence of Ba2+ and Zr4+ with large ionic radii, the octahedral framework is expanded and sufficient space is provided for ion displacement, thus enabling a significant Pmax to be achieved even at lower electric field. Although moderate Wrec (∼2.16 J cm−3) was achieved in the 0.8BNT–0.2BZT ceramic, due to the low η (∼66.1%), it is still not suitable for energy storage in dielectric capacitors. Consistent with the intended design of this work, the incorporation of NN has enhanced relaxation and compensated for polarization losses, while exhibiting high local polarity. Thus, the sample with x = 0.1 exhibits a large Pmax (∼42.1 μC cm−2) at 220 kV cm−1, a small Pr (∼1.1 μC cm−2), high Wrec (∼3.53 J cm−3), η (∼93.5%), and Wrec/E (∼160.45 J (kV m−2)). Interestingly, η shows almost no dependence on the electric field, with a variation rate of less than 0.7%. It indicates that the η of 0.7BNT–0.2BZT–0.1NN ceramic has outstanding electric field stability. In the sample with x = 0.2, due to the enhancement of relaxation and antiferroelectricity, polar domains grow and merge under higher electric fields, leading to slightly lower Wrec and η compared to the sample with x = 0.1. Furthermore, a comparison with recent reported work on lead-free ceramic energy storage properties is presented in Table 1.8,23,27–37 Our work is very significant as it not only maintains higher Wrec and η, but also has a leading Wrec/E under a low electric field. (1 − x)BNT–BZT–xNN ceramics will shine in future energy storage components of power systems.
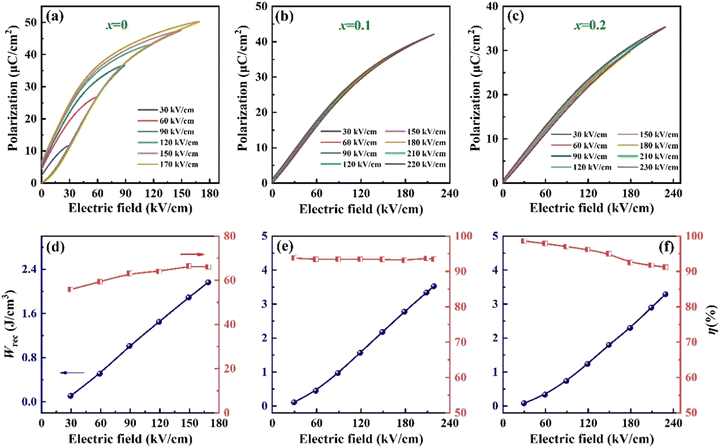 | ||
| Fig. 7 (a)–(c) Unipolar P–E loops under different electric fields, and (d)–(f) electric-field dependence of Wrec and η. | ||
| Composition | W rec (J cm−3) | η (%) | E (kV cm−1) | W rec/E J (kV m−2) | Ref. |
|---|---|---|---|---|---|
0.7Na0.5Bi0.5TiO3–0.3NaNbO3![[thin space (1/6-em)]](https://www.rsc.org/images/entities/char_2009.gif) : :![[thin space (1/6-em)]](https://www.rsc.org/images/entities/char_2009.gif) 7%CaZr0.5Ti0.5O3 7%CaZr0.5Ti0.5O3 |
4.93 | 93.3 | 410 | 120.24 | 8 |
| 0.8(0.94Na0.5Bi0.5TiO3–0.06BaTiO3)–0.2Bi(Mg2/3Nb1/3)O3 | 1.88 | 82.15 | 150 | 125.33 | 27 |
| Bi0.395Na0.325Sr0.245TiO3–Ca0.7La0.2TiO3 | 8.30 | 80 | 660 | 125.76 | 28 |
| 0.94(Na0.88Sm0.04NbO3)–0.06(BiFeO3) | 4.00 | 80 | 460 | 86.96 | 29 |
| 0.875K0.5Na0.5NbO3–0.125Bi(Sr0.5Zr0.5)O3 | 2.95 | 84 | 245 | 120.41 | 23 |
| 0.925(K0.5Na0.5)NbO3–0.075Bi(Zn2/3(Ta0.5Nb0.5)1/3O3) | 4.05 | 87.4 | 307 | 131.92 | 30 |
| Mn-0.97AgNbO3–0.03Bi0.5Na0.5TiO3 | 3.40 | 62 | 220 | 154.55 | 31 |
| 0.85K0.5Na0.5NbO3–0.15Bi(Zn2/3Ta1/3)O3 | 6.70 | 92 | 600 | 111.67 | 32 |
| 0.925Ba0.85Ca0.15Zr0.1Ti0.9O3–0.025BiMg2/3Nb1/3O3 | 3.81 | 90.5 | 405 | 94.07 | 33 |
| 0.7(Bi0.47La0.03Na0.5)0.94Ba0.06TiO3–0.3SrTi0.875Nb0.1O3 | 4.2 | 89.3 | 380 | 110.53 | 34 |
| 0.82NaNbO3–0.18Ba(Fe0.5Nb0.5)O3 | 3.55 | 84.1 | 450 | 78.89 | 35 |
| 0.8Na0.5Bi0.5TiO3–0.2Sm1/3Sr1/2(Mg1/3Nb2/3)O3 | 7.3 | 78.2 | 480 | 152.08 | 36 |
| 0.9(0.6Bi0.5Na0.5TiO3–0.4Sr0.7Bi0.2TiO3)–0.1SmFeO3 | 7.2 | 86 | 430 | 167.44 | 37 |
| 0.7Bi0.5Na0.5TiO3–0.2BaZr0.3Ti0.7O3–0.1NaNbO3 | 3.53 | 93.5 | 220 | 160.45 | This work |
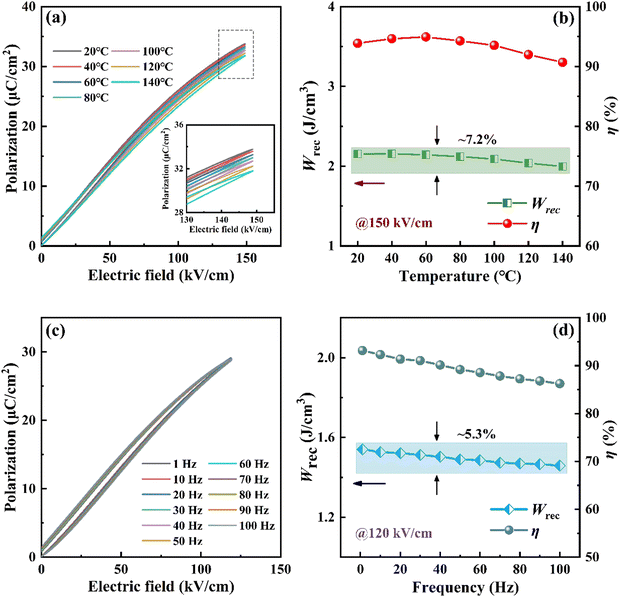
Components used for pulse energy storage inevitably generate heat during operation and need to work in some harsh environments. Therefore, the temperature and frequency stability of dielectric energy storage ceramics are crucial in practical applications. Fig. 8(a) shows the P–E loops of the 0.7BNT–0.2BZT–0.1NN ceramic at different temperatures at 150 kV cm−1. Fig. 8(b) summarizes the changes in energy storage parameters. As the temperature increases, Wrec and η initially increase slightly and then decrease. It can be attributed to the increase in weakly polar phases, which leads to a slight increase in Wrec and η due to the decrease in Pmax and Pr. As the temperature continues to rise, Pmax further decreases along with an increase in Pr and leakage current, causing Wrec and η to decrease (see the inset of Fig. 8(a)). Within the range of 20–140 °C, Wrec only decreases by 7.2%, and η remains above 90%. The energy storage performance of 0.7BNT–0.2BZT–0.1NN ceramics at different frequencies under 120 kV cm−1 is shown in Fig. 8(c) and (d). The shape of the P–E loops remains unchanged at different frequencies. With increasing test frequency, the ferroelectric domains cannot respond in time, so Wrec and η gradually decrease. The sample only experiences a 5.3% decrease in Wrec and maintains η of over 85% at frequencies ranging from 1 to 100 Hz. In conclusion, 0.7BNT–0.2BZT–0.1NN ceramics exhibit excellent thermal/frequency stability, making them an ideal candidate material for high-performance ceramic capacitors.
4. Conclusions
In summary, we have successfully synthesized (0.8 − x)BNT–0.2BZT–xNN relaxor ferroelectric ceramics with desirable energy storage behaviors using a solid-state reaction method. The regulation of key factors influencing energy storage properties, such as the dielectric relaxation behaviors and Eb of ceramics, has been significantly improved based on component design. The addition of NN to BNT–BZT results in an unordered polarization local structure with alternating weak and strong polar clusters, resulting in high Pmax and low Pr at the macroscopic level. The 0.7BNT–0.2BZT–NN ceramic exhibits excellent Wrec (∼3.53 J cm−3), ultra-high η (∼93.5%) and leading Wrec/E (∼160.45 J (kV m−2)) at 220 kV cm−1. In addition, this ceramic shows outstanding electric field stability (30–220 kV cm−1, Δη < 0.7%), thermal stability (20–140 °C, ΔWrec < 7.2%), and frequency stability (1–100 Hz, ΔWrec < 5.3%). These results suggest that the 0.7BNT–0.2BZT–NN ceramic has great potential for application in advanced pulsed power systems.Author contributions
Jian Yang: writing – original draft preparation, data curation, methodology, conceptualization and supervision. Xiaolong Zhu: investigation, methodology, and writing – reviewing and editing. Haotian Wang: formal analysis and writing – reviewing and editing. Yixiao Zhang: writing – reviewing and editing. Pengfei Guan: methodology validation and writing – review and editing. Shiguang Yan: resources. Ming Zheng: formal analysis, methodology, funding acquisition, and writing – reviewing and editing.Data availability
The data that support the findings of this study are available from the corresponding author upon reasonable request.Conflicts of interest
There are no conflicts to declare.Acknowledgements
This work was supported by the National Natural Science Foundation of China (grant no. 12004423), the Opening Project of Key Laboratory of Inorganic Functional Materials and Devices, Chinese Academy of Sciences (grant no. KLIFMD202303), and the Materials Science and Engineering Discipline Guidance Fund of China University of Mining and Technology (grant no. CUMTMS202201).References
- L. T. Yang, X. Kong, F. Li, H. Hao, Z. X. Cheng, H. X. Liu, J. F. Li and S. J. Zhang, Prog. Mater. Sci., 2019, 102, 72–108 CrossRef CAS.
- G. Wang, Z. L. Lu, Y. Li, L. H. Li, H. F. Ji, A. Feteira, D. Zhou, D. W. Wang, S. J. Zhang and I. M. Reaney, Chem. Rev., 2021, 121, 6124–6172 CrossRef CAS PubMed.
- C. W. Sun, J. A. Alonso and J. J. Bian, Adv. Energy Mater., 2021, 11, 2000459 CrossRef CAS.
- X. H. Fan, J. Wang, H. Yuan, Z. H. Zheng, J. Zhang and K. J. Zhu, J. Adv. Ceram., 2023, 12, 649–680 CrossRef CAS.
- H. Pan, F. Li, Y. Liu, Q. H. Zhang, M. Wang, S. Lan, Y. P. Zheng, J. Ma, L. Gu, Y. Shen, P. Yu, S. J. Zhang, L. Q. Chen, Y. H. Lin and C. W. Nan, Science, 2019, 365, 578–582 CrossRef CAS PubMed.
- X. P. Zhu, Y. F. Gao, P. Shi, R. R. Kang, F. Kang, W. J. Qiao, J. Y. Zhao, Z. Wang, Y. Yuan and X. J. Lou, Nano Energy, 2022, 98, 107276 CrossRef CAS.
- Z. Y. Che, L. Ma, G. G. Luo, C. Xu, Z. Y. Cen, Q. Feng, X. Y. Chen, K. L. Ren and N. N. Luo, Nano Energy, 2022, 100, 107484 CrossRef CAS.
- Y. Chen, Y. Huang, Y. D. Zuo, H. S. Wang, K. Liu, B. Y. Fan, Q. F. Zhang, G. Z. Zhang, S. L. Jiang and M. Shen, J. Eur. Ceram. Soc., 2022, 42, 6985–6996 CrossRef.
- X. Z. Zhang, P. Zheng, L. L. Li, F. Wen, W. F. Bai, J. J. Zhang, L. Zheng and Y. Zhang, Scr. Mater., 2022, 211, 114514 CrossRef CAS.
- B. Y. Li, Z. N. Yan, X. F. Zhou, H. Qi, V. Koval, X. G. Luo, H. Luo, H. X. Yan and D. Zhang, ACS Appl. Mater. Interfaces, 2023, 15, 4246–4256 CrossRef CAS PubMed.
- H. Liu, Z. Sun, J. Zhang, H. Luo, Y. Zhang, A. Sanson, M. Hinterstein, L. Liu, J. C. Neuefeind and J. Chen, J. Am. Chem. Soc., 2024, 146, 3498–3507 CrossRef CAS PubMed.
- I. Levin, W. J. Laws, D. Wang and I. M. Reaney, Appl. Phys. Lett., 2017, 111, 212902 CrossRef.
- W. J. Shi, Y. L. Yang, L. Y. Zhang, R. Y. Jing, Q. Y. Hu, D. O. Alikin, V. Y. Shur, J. H. Gao, X. Y. Wei and L. Jin, Ceram. Int., 2022, 48, 6512–6519 CrossRef CAS.
- Y. Ning, Y. Pu, C. Wu, S. Zhou, L. Zhang, J. Zhang, X. Zhang and Y. Shang, J. Mater. Sci. Technol., 2023, 145, 66–73 CrossRef CAS.
- Y. Zhang, A. W. Xie, J. Fu, X. W. Jiang, T. Y. Li, C. Zhou and R. Z. Zuo, ACS Appl. Mater. Interfaces, 2022, 14, 40043–40051 CrossRef CAS PubMed.
- Z. C. Liu, P. R. Ren, C. B. Long, X. Wang, Y. H. Wan and G. Y. Zhao, J. Alloys Compd., 2017, 721, 538–544 CrossRef CAS.
- Y. Yin, J. R. Yu, Y. C. Tang, A. Z. Song, H. Liu, D. Yang, J. F. Li, L. Zhao and B. P. Zhang, J. Materiomics, 2022, 8, 611–617 CrossRef.
- K. Y. Wang, W. H. Li, R. K. Zhao, X. G. Tang, S. Y. Zhang, Y. S. Zhang, J. Hu, Z. H. Shen, Y. P. Jiang and X. B. Guo, Ceram. Int., 2024, 50, 5276–5284 CrossRef CAS.
- X. Qiao, D. Wu, F. Zhang, M. Niu, B. Chen, X. Zhao, P. Liang, L. Wei, X. Chao and Z. Yang, J. Eur. Ceram. Soc., 2019, 39, 4778–4784 CrossRef CAS.
- X. B. Zhang, G. S. Chen, Z. X. Liu, X. L. Miao, Z. H. Zhang, D. Y. Chen, K. H. Lam, M. Zeng, X. S. Gao and J. M. Liu, Chem. Eng. J., 2024, 480, 147973 CrossRef CAS.
- C. B. Long, Z. Q. Su, H. M. Song, A. W. Xu, L. J. Liu, Y. Li, K. Zheng, W. Ren, H. J. Wu and X. D. Ding, Energy Storage Mater., 2024, 65, 103055 CrossRef.
- W. X. Jia, Y. D. Hou, M. P. Zheng and M. K. Zhu, J. Alloys Compd., 2017, 724, 306–315 CrossRef CAS.
- W. X. Luo, M. X. Wu, Y. F. Han, X. Zhou, L. J. Liu, Q. W. He, P. R. Ren, H. M. Yang, H. Yang, Q. Wang, Z. H. Chen, X. H. Liang and Z. F. Chen, J. Am. Ceram. Soc., 2023, 106, 4723–4731 CrossRef CAS.
- M. Acosta, J. D. Zang, W. Jo and J. Rödel, J. Eur. Ceram. Soc., 2012, 32, 4327–4334 CrossRef CAS.
- Q. Xu, H. X. Liu, L. Zhang, J. Xie, H. Hao, M. H. Cao, Z. H. Yao and M. T. Lanagan, RSC Adv., 2016, 6, 59280–59291 RSC.
- Z. Y. Liu, H. Q. Fan, J. S. Lu, Y. Q. Mao and Y. Zhao, J. Eur. Ceram. Soc., 2018, 38, 2871–2878 CrossRef CAS.
- Z. Li, J. Y. Zhang, C. B. Wang, Z. X. Wang, N. N. Lei, L. F. Zheng, D. J. Long, X. T. Wei, J. Zhang, Z. Wang, X. Yan, T. Ai, D. W. Wang and Y. H. Niu, Ceram. Int., 2023, 49, 38735–38742 CrossRef CAS.
- L. M. Tang, Z. Y. Yu, Z. B. Pan, J. H. Zhao, Z. Q. Fu, X. Q. Chen, H. H. Li, P. Li, J. J. Liu and J. W. Zhai, Small, 2023, 19, 2302346 CrossRef CAS PubMed.
- X. J. Meng, Z. Y. Yang, Y. Yuan, B. Tang and S. R. Zhang, Chem. Eng. J., 2023, 477, 147097 CrossRef CAS.
- X. Z. Wang, Y. Huan, P. Y. Zhao, X. M. Liu, T. Wei, Q. W. Zhang and X. H. Wang, J. Materiomics, 2021, 7, 780–789 CrossRef.
- Y. H. Xu, Y. Guo, Q. Liu, G. D. Wang, J. L. Bai, J. J. Tian, L. Lin and Y. Tian, J. Eur. Ceram. Soc., 2020, 40, 56–62 CrossRef CAS.
- D. Li, D. Zhou, D. Wang, W. C. Zhao, Y. Guo and Z. Q. Shi, Adv. Funct. Mater., 2022, 32, 2111776 CrossRef CAS.
- Z. H. Dai, J. L. Xie, Z. B. Chen, S. Zhou, J. J. Liu, W. G. Liu, Z. Z. Xi and X. B. Ren, Chem. Eng. J., 2021, 410, 128341 CrossRef CAS.
- L. K. Wu, L. M. Tang, Y. Z. Zhai, Y. L. Zhang, J. J. Sun, D. Hu, Z. B. Pan, Z. Su, Y. Zhang and J. J. Liu, J. Materiomics, 2022, 8, 537–544 CrossRef.
- G. F. Liu, L. Chen, H. F. Yu, Z. F. Zhang, J. Wu, C. Zhou, H. Qi and J. Chen, Chem. Eng. J., 2023, 474, 145705 CrossRef CAS.
- Q. Zheng, B. Xie, Y. Tian, Q. Wang, H. Luo, Z. Liu and H. Zhang, J. Materiomics, 2023 DOI:10.1016/j.jmat.2023.10.005.
- Q. Zheng, B. Xie, Q. Wang, F. Xue, K. Guo, Z. Liu, P. Mao, W. Cao, H. Luo and H. Zhang, Chem. Eng. J., 2024, 483, 149154 CrossRef CAS.
| This journal is © The Royal Society of Chemistry 2024 |


