A simple SERS sensor based on antibody-modified Fe3O4@Au MNPs for the detection of CA19-9 in CRC patients†
Miaowen
Xu‡
a,
Gaoyang
Chen‡
b,
Yong
Huang
c,
Hangyu
Song
c,
Zheng
Wu
c,
Fengjuan
Jiang
d,
Lei
Fu
c,
Caili
Bi
a,
Xiaowei
Cao
 *a and
Wei
Wei
 *c
*c
aInstitute of Translational Medicine, Medical College, Yangzhou University, Yangzhou, Yangzhou, PR China. E-mail: cxw19861121@163.com
bDepartment of Oncology, The Second People's Hospital of Taizhou City, Taizhou, PR China
cDepartment of Gastrointestinal Surgery, Jiangdu People's Hospital Affiliated to Yangzhou University, Yangzhou, PR China. E-mail: jd.k.kenny@163.com
dDepartment of Gastroenterology, Jiangdu People's Hospital Affiliated to Yangzhou University, Yangzhou, PR China
First published on 1st November 2024
Abstract
This paper presents functionalized magnetic nanoparticles (Fe3O4@Au MNPs) combined with the surface-enhanced Raman spectroscopy (SERS) technique for sensitive detection of colorectal cancer (CRC) protein biomarker carbohydrate antigen 19-9 (CA19-9). Fe3O4@Au MNPs were constructed by the PEI-mediated seed growth method. Then, the signal molecule 5-5′-dithiobis (succinimidyl-2-nitrobenzoic acid) was used as a bridging agent to link CA19-9 antibody, and the SERS sensor was prepared. Using this sensor, detection of CA19-9 can be realized with only a one step sampling reaction. Fe3O4@Au MNPs combine the advantages of magnetic materials and noble metal nanoparticles, effectively amplifying the signal by creating numerous “hot spots” within the Au particle gaps and enhancing magnetic enrichment. Consequently, this approach lowers the detection limit (LOD) and enhances detection sensitivity. The ratio of characteristic peak intensities I1392/I1069 was selected for calculation, and a linear equation was constructed with a LOD as low as 0.27 U mL−1 by quantitative detections of the standard antigen. Finally, the sensor was used to analyze the clinical serum samples from CRC patients and healthy individuals, and the detection results were consistent with the actual results. This method exhibits notable advantages, including simplicity, high sensitivity, specificity, stability and reproducibility. It is expected to provide a new promising analytical method for clinical CA19-9 immunoassay.
1 Introduction
Colorectal cancer (CRC) is among the most frequently occurring malignant neoplasms of the digestive system.1,2 Owing to changes in lifestyle and dietary habits, population growth and ageing, the incidences and mortalities of CRC have been increasing globally in recent years.3 The 5-year survival rate of patients with early CRC can be as high as 90% after surgery. However, for patients with advanced CRC, the survival rate is only 17%.4 It can be seen that the early diagnosis and treatment of CRC are very important for the prognosis of CRC. Common methods of CRC screening are sigmoidoscopy, fiberoptic colonoscopy,5,6 barium enema,7 the fecal occult blood test8 and so on. Colonoscopy, the universally recognized gold standard, may cause panic and discomfort to patients due to its invasive nature, and expensive equipment and a cumbersome procedure have hindered its widespread use in prompt onset testing (POCT).9 The fecal occult blood test is non-invasive and easy to perform, but is subject to many external influences.10 Thus, it is important to develop a screening method that is convenient, rapid, and noninvasive.Protein biomarker tests play an important role in screening for early CRC, and can greatly improve the therapeutic effects and survival rates of patients.11 It has been suggested that changes in the levels of the serum protein biomarker carbohydrate antigen 19-9 (CA19-9) are closely related to the development of CRC.12,13 CA19-9 is derived from adenocarcinoma cells and enters the body's bloodstream in the thoracic duct. It is found to be abnormally elevated in the blood of CRC patients. Normal levels of CA19-9 in the human body are usually in the range of 0–37 U mL−1.14 The detection of CA19-9 in human serum can increase the positive detection rate, which is more conducive to the further screening and diagnosis of CRC.
Currently, researchers have developed a series of detection methods for protein biomarkers, including enzyme-linked immunosorbent assay (ELISA),15 chemiluminescence immunoassay,16 and fluorescence immunoassay.17 However, these methods are cumbersome and time-consuming, and the high requirements for the samples make it difficult for them to achieve sensitive detection. Surface-enhanced Raman spectroscopy (SERS) has gradually become a research hotspot due to its advantages of large dynamic range, no damage in sample detection, fast detection speed and little external influence.18–20 SERS combines Raman spectroscopy with surface material techniques to significantly enhance the SERS signal using localized surface plasmon resonance (LSPR) and chemisorption.21,22 With the help of SERS enhancement of the role of the substrate,23–25 it can realize the highly sensitive detection of trace substances, and successfully solve the problem of weak signal intensity of Raman spectroscopy.
In recent years, Fe3O4@Au MNPs have attracted a lot of attention due to their good SERS enhancement effect and magnetic enrichment, showing great advantages in SERS analysis. Fe3O4 nanoparticles have many advantages such as good electrical and optical properties and biocompatibility. Owing to the magnetic properties of magnetic materials, the separation and enrichment of the substances to be measured can be achieved without the need for excessive pre-treatment processes, which is very important in medical applications.26,27 However, uncoated iron oxide suffers from the disadvantages of low stability, easy agglomeration and oxidation.28 Au as a shell layer material can effectively protect the inner core and avoid agglomeration, while its surface can be easily biomodified.29 Core–shell structure Fe3O4@Au MNPs constructed with Au nanoparticles and Fe3O4 nanoparticles, combining the advantages of magnetic materials and noble metal nanoparticles, effectively amplify the signal by creating numerous “hot spots” within the Au particle gaps. Under the double signal amplification strategy of the applied magnetic field, Fe3O4@Au MNPs are gathered into an ideal SERS substrate with abundant “hot spots”, which can further improve the detection sensitivity.30–32 In the reported literature, SERS detections of protein biomarkers often introduced a sandwich immune complex with a substrate/sample/SERS tag. The whole process requires the preparation of substrates and tags separately, followed by the linkage of antibodies or aptamers as the SERS probes and capture probes, respectively.33–35 Although the method is specific, it requires two incubations, which is complicated and easily affected by human operation factors. Therefore, it is urgent to develop a simpler method for SERS detection while ensuring high sensitivity.
In this paper, Fe3O4@Au MNPs were constructed using a modified PEI-mediated seed growth strategy first. The preparation process is shown in Fig. 1a. Then, a SERS sensor with high sensitivity was constructed by attaching CA19-9 antibody to gold nanoparticles using 5-5′-dithiobis (succinimidyl-2-nitrobenzoic acid) (DSNB) as a protein coupling agent. Capture of CA19-9 using the dehydration condensation reaction between antigen and antibody leads to the increase in SERS intensity at the characteristic peak at 1392 cm−1 after magnetic separation. Fig. 1b shows the flow chart of SERS sensor preparation and detection. The peak at 1069 cm−1 exhibiting consistent peak intensity was chosen as the reference peak for internal standardization. According to the change in the characteristic peak ratio I1392/I1069, the sensitive protein quantitative analysis was realized. This method completes the detection only by one-step combination of antigen and antibody, and shows great application potential in the early diagnosis of CRC.
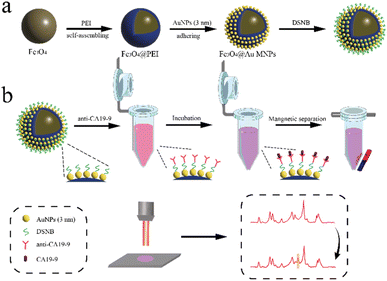 | ||
| Fig. 1 (a) Preparation of Fe3O4@Au MNPs; (b) SERS sensor preparation for the detection of protein biomarker CA19-9. | ||
2 Experimental section
2.1. Materials and reagents
Chloroauric acid tetrahydrate (HAuCl4·4H2O, 98%), poly-ethylenimine (PEI), and phosphate-buffered saline solution (PBS; pH = 7.4), were obtained from Shanghai Aladdin Reagent Company. CA19-9 antibody was purchased from Nanjing Oukai Biological Company. CEA and CA125 were purchased from Shanghai Linc-Bio Science Company. Sodium borohydride (NaBH4), sodium citrate, anhydrous sodium acetate and anhydrous ethanol were from Sigma Company. Ferric chloride hexahydrate (FeCl3·6H2O) and 5,5′-dithiobis (succinimidyl-2-nitrobenzoate) (DSNB) were obtained from Beijing Dingguo Changsheng Biotechnology Company. All laboratory water was ultrapure water (resistivity of 18.2 MΩ cm) and all reagents used were of analytical grade. The beakers were all submerged in freshly prepared aqua regia, completely cleaned with ultrapure water and then dried for use.2.2. Instrumentation
A Tecnai G2 F30 field emission transmission electron microscope (TEM, FEI, USA), InVia Laser confocal Raman Spectrometer (Raman, Renishaw, UK), and DXR3xi Raman Imaging Microscope (SRS, Thermo Fisher Scientific Inc., USA) were utilized in this study. The UV-visible spectra were recorded via a Cary 5000 UV-visible spectrophotometer. High-resolution TEM (HRTEM) images were obtained with an FEI field-emission transmission electron microscope operating at 300 kV.2.3. Preparation of Fe3O4
2 g of FeCl3·6H2O and 3 g anhydrous sodium acetate were dissolved in 40 mL glycol, and then 0.4 g sodium citrate was added and stirred at 700 rpm for 1 h. This mixture was added to the reactor and allowed to react in an incubator at 250 °C for 24 h. The reactor was removed and cooled to room temperature, washed with ethanol 3 times to obtain Fe3O4 nanoparticles, which were dried for later use. The Fe3O4 nanoparticles were evenly dispersed by adding 50 mg of Fe3O4 nanoparticles to 5 mL of pure water and ultrasonicated for 10 min.2.4. Preparation of 3 nm AuNPs
We synthesized 3 nm colloidal Au nanoparticles (AuNPs) using NaBH4 reduction. First, prepare 300 mL of HAuCl4 solution (0.25 mM) and 3 mL of sodium citrate solution (1%). Next, the two were thoroughly mixed and 4.5 mL of NaBH4 bath solution (0.2 M) was added. The mixed solution was magnetically stirred at 700 rpm at room temperature. Following continuous stirring for a duration of 4 h, the preparation of AuNPs with an average particle size of 3 nm was successfully achieved.2.5. Preparation of Fe3O4@Au MNPs
Fe3O4@Au MNPs were prepared in the laboratory using a modified “PEI-mediated seed growth method” as follows:1 mL of Fe3O4 solution (10 mg mL−1) was added to 100 mL of pure water and vigorously sonicated for 10 min to disperse it evenly. Next, 10 mL of PEI aqueous solution (0.5 mg mL−1) was incorporated into the above solution, and continuous vigorous sonication was performed to make PEI rapidly self-assemble on the surface of Fe3O4 nanoparticles. After 30 min of reaction, the product was recovered by magnetic enrichment and the excess PEI was removed by washing the product with deionized water. Finally, the prepared Fe3O4@PEI nanoparticles were resuspended in 10 mL of pure water and set aside.
1 mL Fe3O4@PEI solution was added to 60 mL 3 nm AuNP solution. After 30 min of vigorous sonication, the 3 nm AuNPs were firmly bound to the Fe3O4@PEI surface. The recovery product (Fe3O4@Au MNPs) was enriched with a magnet and resuspended in 5 mL of pure water.
2.6. Construction of the SERS sensor
Fe3O4@Au MNPs were soaked in 400 μL DSNB (10−3 mol L−1) acetonitrile to attach the DSNB to the Fe3O4@Au MNPs via Au–S bond. After 12 h, this mixture was centrifuged (6000 rpm) for 10 min and rinsed thoroughly with ethanol to remove excess DSNB. Subsequently, 5 mL DSNB-labeled Fe3O4@Au MNPs (0.2 mg mL−1) was immersed in 100 μL CA19-9 standard antibody solution at 37 °C, and stirred continuously for 2 h. Finally, this was centrifuged (6000 rpm) for 10 min and then resuspended in PBS (PH = 7.4) solution.2.7. SERS detection
1 mL CA19-9 antigen (2000 U mL−1) was added to 1 mL normal human serum. Therefore, 1000 U mL−1 CA19-9 antigen solution was obtained. Gradient dilution was used to obtain different concentrations of CA19-9 solutions. Different concentrations of CA19-9 antigen (0.01, 0.1, 1, 10, 100 and 1000 U mL−1) solution were added to a centrifuge tube equipped with a SERS sensor and incubated in an incubator at 37 °C for 60 min. After magnetic separation, it was washed several times with PBS buffer and resuspended in 10 μL PBS buffer. Finally, the SERS detection was conducted at room temperature. The Raman spectrometer used in the experiment has an excitation wavelength of 785 nm, a laser intensity of 50 mW, and an exposure time of 10 s.2.8. Clinical sample preparations
Clinical serum samples were obtained from Jiangdu People's Hospital affiliated to Yangzhou University, and all the sample providers provided informed consent. The experiments followed the Helsinki Declaration of Principles and were approved by the Medical Ethics Committee of Jiangdu People's Hospital Affiliated to Yangzhou University (YJRY-2024-K-005). Thirty serum samples were collected from healthy people (14 males and 16 females). Fifty serum samples were collected from CRC patients (15 males and 15 females). The samples were stored in a −20 °C refrigerator for testing.3 Results and discussion
3.1. Material characterization of the Fe3O4@Au MNPs
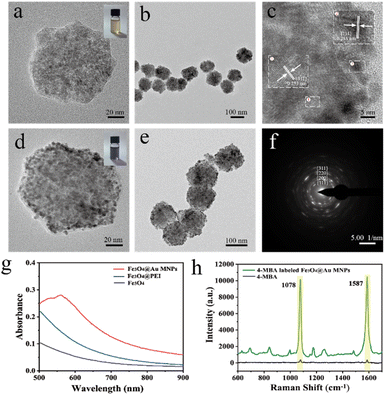
The morphology, structure and other physical properties of the prepared Fe3O4@Au MNPs were analyzed using TEM. Fig. 2a and b show that the resulting Fe3O4 nanoparticles have an excellent spherical morphology with a diameter of about 100 nm, which is the basis for the subsequent preparation of morphologically stable and uniformly sized Fe3O4@Au MNPs. As shown in Fig. 2d and e, the TEM images clearly demonstrated the appearances of Fe3O4@Au MNPs. Au nanoparticles with a diameter of 3 nm were uniformly and densely distributed on the surface of Fe3O4. This rough and nano-gapped gold shell layer could significantly improve SERS performance. The high-resolution TEM (HRTEM) image in Fig. 2c exhibited the crystal structure of Fe3O4@Au MNPs. Fe3O4@Au MNPs had clear lattice stripes with 0.236 nm spacing, corresponding to the {111} plane of Au. Lattice stripes with 0.253 nm spacing matched the {311} plane of Fe3O4. The diffraction rings in Fig. 2f corresponded to the {111}, {200}, {220}, and {311} planes, further indicating the structure of Fe3O4@Au MNPs. The UV-vis absorption spectra of Fe3O4, Fe3O4@PEI, and Fe3O4@Au MNPs are shown in Fig. 2g. The absorption spectra of Fe3O4@Au MNPs had an LSPR absorption peak at 557 nm. 1 mL Fe3O4@Au MNPs (0.2 mg mL−1) reacted with 400 μL 4-MBA (1 × 10⁻⁷ M) solution. After centrifugation (8000 rpm) for 1 h, and 4-MBA-labeled Fe3O4@Au MNPs were obtained. The product was dispersed in 1 mL deionized water. Finally, SERS detection was carried out. As shown in Fig. 2h, SERS spectra of 4-MBA (1 × 10⁻¹ M) and 4-MBA (1 × 10⁻⁷ M) labeled Fe3O4@Au MNPs are recorded. It is clearly observed that even high concentrations of 4-MBA in the absence of Fe3O4@Au MNPs showed only weak Raman signals, while the SERS signals of 4-MBA-labeled Fe3O4@Au MNPs was significantly enhanced. This result indicated that Fe3O4@Au MNPs exhibited a remarkable SERS enhancement effect. The SERS spectra showed a very strong characteristic peak at 1078 cm−1 and 1587 cm−1 respectively, which belonged to the characteristic vibration modes of the benzene ring v8a and v12.36The quantitative assessment of its SERS enhancement effect could be achieved by comparing it with the Raman enhancement factor (EF), which was determined using the following formula: EF = (ISERS/CSERS)/(IRS/CRS). Here, the I and C in the formula represented the signal intensity and the concentration of the analyte, respectively. The intensity of the characteristic SERS peak (formed by symmetric nitro stretching) of 4-MBA at 1078 cm−1 was taken for calculation. When CSERS = 1 × 10⁻⁷ M, CRS = 1 × 10⁻¹ M, ISERS = 10![[thin space (1/6-em)]](https://www.rsc.org/images/entities/char_2009.gif) 077.661 a.u. and IRS = 364.561 a.u. according to the equation, the EF value for Fe3O4@Au MNPs was calculated to be 2.76 × 10⁷ without magnetic enrichment.
077.661 a.u. and IRS = 364.561 a.u. according to the equation, the EF value for Fe3O4@Au MNPs was calculated to be 2.76 × 10⁷ without magnetic enrichment.
3.2. Elemental analysis of Fe3O4@Au MNPs
The elemental distribution of Fe3O4@Au MNPs was visualized by high-angle annular dark-field scanning transmission electron microscopy (HAADF-STEM) and elemental mapping analysis. The spatial distribution of Fe, Au and O and their EDS images are shown in Fig. 3. The orange color referred to the element Fe, the green color referred to the element Au, and the red color referred to the element O. It can be seen that Au nanoparticles uniformly adhered to the surface of Fe3O4 nanoparticles to construct the core–shell structure Fe3O4@Au MNPs. This typical core–shell nanocomposite has the ability to enhance the SERS signal significantly. Fe, Au and O peaks could be seen clearly in Fig. 3e and the peaks of Fe were higher than those of Au, suggesting that elemental Fe dominates over elemental Au in terms of proportion, where the peaks of Cu and C were caused by the Cu grid carrying the samples.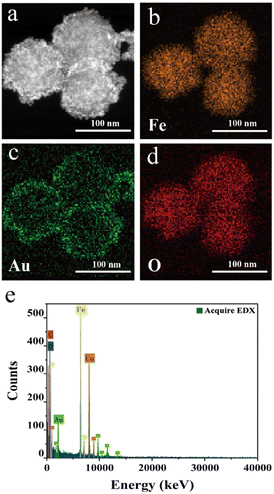 | ||
| Fig. 3 (a–d) HAADF-STEM images and elemental mapping images of Fe3O4@Au MNPs; (e) EDX spectra of Fe3O4@Au MNPs. | ||
3.3. Detection principle
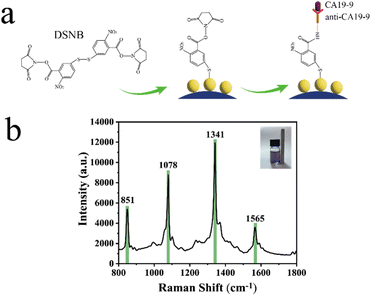
Fig. 4a shows the detection principle. DSNB adsorption on the substrate is through the newly formed Au–S bond between it and Au. This covalent bonding reduces the detachment of beacon molecules DSNB and thus improves the reproducibility of SERS tests. During dehydration condensation, the amine group (–NH2) of the CA19-9 antibody forms a peptide bond (–CO–NH–) with the carboxyl group (–COOH) of the DSNB molecule. The consequence of this process is the binding of DSNB to the CA19-9 biomarker. CA19-9 is captured using an immune recognition reaction between antigen and antibody. The DSNB spectra are reported in Fig. 4b. The characteristic peaks of DSNB were attributed by combining theoretical Raman spectra and actual SERS spectra and referring to previous literature. The band at 1078 cm−1 is a succinimide N–C–O stretch overlapping with aromatic ring modes. The characteristic peak at 1341 cm−1 in this spectrum is mainly attributed to symmetric nitro stretching, and the band at 1565 cm−1 is due to an aromatic ring mode.With the addition of CA19-9 antigen, the peak intensity at 1370 cm−1 gradually decreases. At the same time, a new peak at 1392 cm−1 appears due to dehydration condensation. The peak located at 1370 cm−1 corresponds to the stretching mode of the COO– group, which disappears due to the attachment of biomolecules such as antibodies. The increase in the 1392 cm−1 peak is attributed to the NH–CO pattern.37 Therefore, we can construct a correlation linear equation by using the changes in the strength of SERS signal generation, and then realize the sensitive quantitative analysis of CA19-9 antigen.
3.4. Experimental optimization
The performance of the SERS sensor was improved by optimizing CA19-9 antibody incubation time, detection time and other experimental conditions. DSNB-labeled Fe3O4@Au MNPs were immersed in 100 μL CA19-9 standard antibody solution to prepare the SERS sensor and conduct SERS detection. Fig. 5a and b show that the ratio of the characteristic peak I1392/I1069 increases with the augmentation of CA19-9 antibody incubation time. The enhancement trend disappears after 120 min, indicating that the antibody attached to the DSNB-labeled Fe3O4@Au MNPs has reached a saturated state. CA19-9 antigen (1000 U mL−1) was added to a centrifuge tube equipped with a SERS sensor and incubated in an incubator at 37 °C. As shown in Fig. 5c and d the ratio of the characteristic peak I1392/I1069 gradually increases with the extension of incubation time, and the ratio remains basically unchanged after 60 min. This is because the CA19-9 antibody attached to the SERS sensor reacts completely with the antigen. Therefore, 60 min was selected as the best incubation time.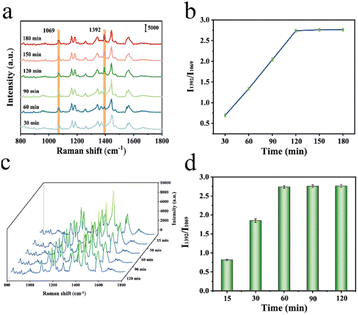 | ||
| Fig. 5 Optimization of (a) and (b) CA19-9 antibody incubation time; (c) and (d) CA19-9 incubation time. | ||
3.5. Specificity, stability and reproducibility testing
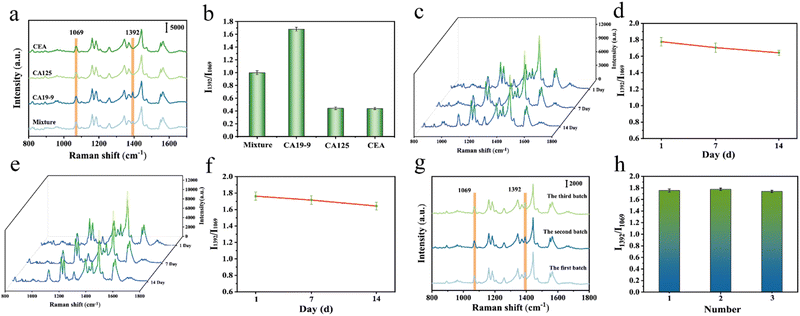
The specificity, stability and reproducibility of the sensor are crucial for subsequent SERS detection. The above properties of the CA19-9 antibody-modified Fe3O4@Au MNP sensor are analyzed and evaluated as shown below.Currently, CRC is generally diagnosed by positive expression of carcinoembryonic antigen (CEA), carbohydrate antigen 125 (CA125), and CA19-9 in a patient's serum. To evaluate the specificity of the SERS sensor prepared herein for CA19-9 detection, we introduced several other antigens (CEA and CA125) into our experiments and performed SERS measurements on these protein biomarkers and their mixtures (all at a concentration of 10 U mL−1). The obtained SERS spectra are presented in Fig. 6a. It can be seen that the CA19-9 antibody-modified Fe3O4@Au MNP sensor reacted only with CA19-9. None of the other antigens were able to produce a recognizable characteristic peak at 1392 cm−1, as expected. Fig. 6b shows the corresponding I1392/I1069 histograms. The I1392/I1069 of all other antigens was much lower than the I1392/I1069 of CA19-9. The specificity of the CA19-9 antibody-modified Fe3O4@Au MNP sensor for CA19-9 detection was further demonstrated.
Fig. 6c and e show the average SERS spectra of CA19-9 solution (10 U mL−1) after the CA19-9 antibody-modified Fe3O4@Au MNP sensors were kept at room temperature and 4 °C for different times (1 day, 7 days, and 14 days). The intensity and shape of the spectra did not change significantly, which indicated that the sensor has good stability. As can be seen from Fig. 6d and f, the sensor's stability was not significantly impacted at either room temperature or 4 °C. Compared with the freshly prepared sensor, the SERS enhanced effect was only reduced to 95.93% and 95.08% after 14 days respectively, which further verified the stability of the sensor.
Finally, the SERS sensors prepared from three different batches were examined. As shown in Fig. 6g and h, there was no significant difference in the waveform and intensity of SERS spectra, which indicated that the sensor is reproducible with a relative standard deviation (RSD) = 3.7%.
In summary, the CA19-9 antibody-modified Fe3O4@Au MNP sensor has the above advantages, and can meet the subsequent demands for sensitive detection of CA19-9 antigen.
3.6. Quantitative detection of CA19-9 antigen
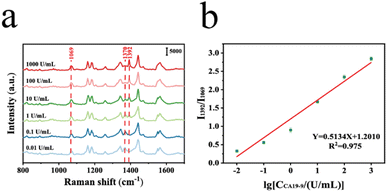
Under optimal experimental conditions, different concentrations of CA19-9 antigen were quantified using the prepared SERS sensor. The sensor was incubated at 37 °C with different concentrations of CA19-9 antigen (0.01, 0.1, 1, 10, 100 and 1000 U mL−1) for 60 min. Then, we collected SERS spectra. Fig. 7a shows the results of SERS characterization after using different concentrations (0.01, 0.1, 1, 10, 100 and 1000 U mL−1) of CA19-9 antigen. In order to investigate the relationship between CA19-9 concentrations and SERS properties, the peak at 1069 cm−1 exhibiting consistent peak intensity, was chosen as the reference peak for internal standardization. As shown in Fig. 7b, we constructed the ratio I1392/I1069 of the intensity of the characteristic peaks at 1392 cm−1 and 1069 cm−1, demonstrating a reliable linear association. The fitting equation Y = 0.5134X + 1.2010 and correlation coefficient (R2) = 0.975 are obtained by analyzing the calibration curve, when the SERS intensity ratio of peaks is Y and the logarithm of CA19-9 antigen concentration is X. According to the detection formula (LOD = 10((C_blank + 3SD) − a)/b), the detection limit (LOD) is 0.27 U mL−1, which is lower than that in the other articles (Table 1).3.7. Clinical diagnosis of colorectal cancer
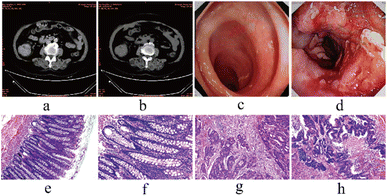
All enrolled subjects were selected by imaging, colonoscopy, and pathology. Fig. 8a and b show CT images of a CRC patient taken at Jiangdu People's Hospital. CT images showed thickening of the bowel wall of the proximal ascending colon and narrowing of the bowel lumen. The enhancement was obvious after strengthening. Fig. 8c shows the colonoscopy image of a healthy individual. Fig. 8d shows the colonoscopy image of a CRC patient. This image showed the proximal ileocecal part of the ascending colon with irregular eminence, surface roughness, and a narrow lumen. Fig. 8e–h show the comparison of HE staining between CRC patients and healthy individuals. HE staining of the patient's surgically resected sample suggested glandular differentiation in the sent tumor tissue, with some glands being sieve-shaped and some fused. Proliferation and necrosis of tumor fibrous tissue were observed in the interstitium. HE staining confirmed CRC.3.8. Clinical sample analysis
To validate the feasibility of the proposed immunoassay utilizing the SERS technique for practical applications, we employed the SERS sensor against CA19-9 in human serum samples. Fig. 9a shows the mean SERS spectra of serum derived from 30 healthy individuals and 30 CRC patients. Serum SERS spectra of CRC patients showed a significant peak at 1392 cm−1. Fig. 9b shows the histogram of the SERS intensity ratio I1392/I1069. After obtaining the SERS intensity ratio I1392/I1069 of CA19-9 in the serum of the subjects, the CA19-9 concentration of all subjects was calculated by introducing the linear equation. The mean concentrations of CA19-9 calculated for healthy individuals and CRC patients were 12.36 U mL−1 and 57.21 U mL−1 respectively, which were consistent with the hospital results (12.94 U mL−1 and 58.39 U mL−1). SERS was used to validate its high sensitivity and practical application potential in the early diagnosis of CRC.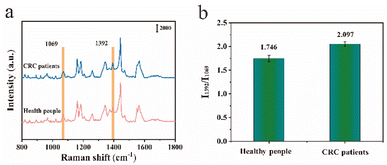 | ||
| Fig. 9 (a) Mean SERS spectra of CA19-9 concentrations in the serum of healthy individuals and CRC patients; (b) and their corresponding I1392/I1069 histograms. | ||
4 Conclusions
In summary, we successfully constructed a simple and highly sensitive SERS sensor for the detection of CA19-9 in human serum. The morphology and size of Fe3O4@Au MNPs synthesized by the seed growth strategy are uniform. Meanwhile, the rough gold shell layer with nanogaps can significantly improve the SERS performance, EF = 2.76 × 10⁷ without magnetic enrichment. The SERS sensor prepared by using antibody-modified Fe3O4@Au MNPs has the characteristic of sensitive antigen recognition. The specificity, stability and reproducibility of this SERS sensor were also evaluated, and the results were satisfactory. By testing different concentrations (0.01, 0.1, 1, 10, 100 and 1000 U mL−1) of the CA19-9 antigen, a strong linear correlation was observed between the concentrations of the antigen and the ratio of I1392 to I1069, with R2 = 0.975. The LOD of this method is as low as 0.27 U mL−1, which is lower than the current LOD of some other methods for CA19-9, which can achieve high sensitivity detection of CA19-9. In the actual sample testing, the level of CA19-9 in the serum of CRC patients is much higher than that in healthy individuals. The SERS sensor has the ability to accurately discriminate both types of individuals. There is no significant difference between this method and the hospital tests, which proves that it has a good application prospect.Data availability
Data will be made available on request.Author contributions
Conceptualization, Wei Wei, Xiaowei Cao and Miaowen Xu; investigation, Miaowen Xu, Yong Huang and Hangyu Song; writing the original draft, Miaowen Xu and Gaoyang Chen; writing, review and editing, Miaowen Xu and Gaoyang Chen; formal analysis, Zheng Wu and Fengjuan Jiang; validation, Lei Fu and Caili Bi; supervision, Wei Wei and Xiaowei Cao.Conflicts of interest
There are no conflicts to declare.Acknowledgements
This work was supported by the Yangzhou Social Development fund (YZ2022089), Yangzhou Social Development fund (YZ2023094), and Key Medical Research Projects of Yangzhou Health Commission (2023-1-04).Notes and references
- J. Lee, M. Keil, J. S. Lee, A. Baird and H. Y. Choi, JMIR Form. Res., 2023, 7, e37553 CrossRef PubMed.
- Y. Wang, D. Zhang, C. Zhang and Y. Sun, Cancer Manage. Res., 2020, 12, 10985–10992 CrossRef.
- C. Shi, M. Xie, L. Li, K. Li and B. L. Hu, Medicine, 2019, 98, 19 Search PubMed.
- J. Cruzado, F. I. Sanchez, J. Maria Abellan, F. Perez-Riquelme and F. Carballo, Best Pract. Res., Clin. Gastroenterol., 2013, 27, 867–880 CrossRef PubMed.
- K. H. Chen, M. J. Pan, Z. Jargalsaikhan, T. O. Ishdorj and F. G. Tseng, Biosensors, 2020, 10(163) Search PubMed.
- H. Brenner, C. Stock and M. Hoffmeister, Br. Med. J., 2014, 348, g2467 CrossRef PubMed.
- F. Stracci, M. Zorzi and G. Grazzini, Front. Public Health, 2014, 2(210) Search PubMed.
- D. Lin, H. Huang, S. Qiu, S. Feng, G. Chen and R. Chen, Opt. Express, 2016, 24, 2222–2233 CrossRef PubMed.
- D. Lin, S. Feng, J. Pan, Y. Chen, J. Lin, G. Chen, S. Xie, H. Zeng and R. Chen, Opt. Express, 2011, 19, 13565–13577 CrossRef PubMed.
- Y. Gao, J. Wang, Y. Zhou, S. Sheng, S. Y. Qian and X. Huo, Sci. Rep., 2018, 8, 2732 CrossRef PubMed.
- D. S. Thomas, E. O. Fourkala, S. Apostolidou, R. Gunu, A. Ryan, I. Jacobs, U. Menon, W. Alderton, A. Gentry-Maharaj and J. F. Timms, Br. J. Cancer, 2015, 113, 268–274 CrossRef CAS PubMed.
- Y. R. Wang, J. X. Yan and L. N. Wang, J. Cancer Res. Ther., 2014, 10, 307–309 CrossRef.
- Z. Huang, Z. Li, X. Chen, X. Zhu, J. Zhang, Y. Song, Y. Cao and P. Lu, Biomed Res. Int., 2022, 2022, 1213968 Search PubMed.
- P. C. Lin, J. K. Lin, C. C. Lin, H. S. Wang, S. H. Yang, J. K. Jiang, Y. T. Lan, T. C. Lin, A. F. Y. Li, W. S. Chen and S. C. Chang, Int. J. Colorectal Dis., 2012, 27, 1333–1338 CrossRef PubMed.
- C. Lin, W. C. Wu, G. C. Zhao, D. S. Wang, W. H. Lou and D. Y. Jin, Medicine, 2016, 95(31), e4527 CrossRef PubMed.
- D. L. Giokas, A. G. Vlessidis, G. Z. Tsogas and N. P. Evmiridis, TrAC, Trends Anal. Chem., 2010, 29, 1113–1126 CrossRef.
- L. Chen, J. Lin, J. Yi, Q. Weng, Y. Zhou, Z. Han, C. Li, J. Chen and Q. Zhang, Anal. Bioanal. Chem., 2019, 411, 5277–5285 CrossRef.
- W. Hu, L. Xia, Y. Hu and G. Li, Microchem. J., 2022, 172, 106908 CrossRef.
- B. H. Jun, G. Kim, M. S. Noh, H. Kang, Y. K. Kim, M. H. Cho, D. H. Jeong and Y. S. Lee, Nanomedicine, 2011, 6, 1463–1480 CrossRef.
- Y. Zhao, Y. Yang, Y. Luo, X. Yang, M. Li and Q. Song, ACS Appl. Mater. Interfaces, 2015, 7, 21780–21786 CrossRef.
- M. Gambucci, E. Cambiotti, P. Sassi and L. Latterini, Molecules, 2020, 25, 3405 CrossRef PubMed.
- Z. Liu, X. Liu, Y. Sun and R. Xiao, Acta Opt. Sin., 2023, 43, 17 Search PubMed.
- H. Liu, Y. He and K. Cao, Adv. Mater. Interfaces, 2021, 8(21), 2101448 CrossRef.
- S. Arya, N. Nachiappan, R. Waghmare and M. S. Bhat, Nat. Rev. Methods Primers, 2023, 3, 1 CrossRef.
- C. Lai, Z. Zhang, J. Wen, C. Zeng and Q. Zhang, Spectrosc. Spectral Anal., 2023, 43, 2325–2332 Search PubMed.
- H. Y. Park, M. J. Schadt, L. Wang, I. I. S. Lim, P. N. Njoki, S. H. Kim, M. Y. Jang, J. Luo and C. J. Zhong, Langmuir, 2007, 23, 9050–9056 CrossRef PubMed.
- H. Huang, Z. Zhang and G. Li, Biosensors, 2023, 13(30) Search PubMed.
- N. Mahmed, O. Heczko, A. Lancok and S. P. Hannula, J. Magn. Magn. Mater., 2014, 353, 15–22 CrossRef.
- D. Han, B. Li, Y. T. Wu, Y. Kou, X. Xue, L. Chen, Y. Liu and Q. Duan, Nanotechnology, 2019, 30(46) CrossRef PubMed.
- H. Sun, S. Zeng, Y. Shang and J. Nanosci, Nanotechno, 2018, 18, 1097–1102 Search PubMed.
- F. Li, Z. Yu, L. Zhao and T. Xue, RSC Adv., 2016, 6, 10352–10357 RSC.
- D. Han, B. Li, S. Yang, Y. Yan, L. Yang, Y. Liu and C. Li, Chem. J. Chin. Univ., 2019, 40, 2067–2074 Search PubMed.
- M. Guo, J. Dong, W. Xie, L. Tao, W. Lu, Y. Wang and W. Qian, J. Mater. Sci., 2015, 50, 3329–3336 CrossRef.
- E. Er, A. Sanchez-Iglesias, A. Silvestri, B. Arnaiz, L. M. Liz-Marzan, M. Prato and A. Criado, ACS Appl. Mater. Interfaces, 2021, 13, 8823–8831 CrossRef.
- Z. Hu, X. Zhou, J. Duan, X. Wu, J. Wu, P. Zhang, W. Liang, J. Guo, H. Cai, P. Sun, H. Zhou and Z. Jiang, Sens. Actuators, B, 2021, 334, 129640 CrossRef.
- X. Y. Zhang, D. Han, Z. Pang, Y. Sun, Y. Wang, Y. Zhang, J. Yang and L. Chen, J. Phys. Chem. C, 2018, 122, 5599–5605 CrossRef.
- H. Ma, X. Sun, L. Chen, W. Cheng, X. X. Han, B. Zhao and C. He, Anal. Chem., 2017, 89, 8877–8883 CrossRef PubMed.
- Y. Huang, Y. Wen, K. Baryeh, S. Takalkar, M. Lund, X. Zhang and G. Liu, Microchim. Acta, 2017, 184, 4287–4294 CrossRef.
- W. Chen, M. M. Chi, M. M. Wang, Y. Liu, K. Shu, L. P. Du, J. Wang and C. S. Wu, Sensors, 2023, 23, 9693 CrossRef.
- P. G. Victor, T. R. M. Rebeca, P. Maria, M. B. Neus, G. F. Pablo, N. Pilar, P. M. Jose and C. Susana, J. Electroanal. Chem., 2023, 935, 117312 CrossRef.
- Y. Wang, Y. Mi, Y. Li, J. Wang, L. Cheng, S. Yan and L. Deng, Chin. J. Biotechnol., 2018, 34, 1012–1018 Search PubMed.
Footnotes |
| † Electronic supplementary information (ESI) available. See DOI: https://doi.org/10.1039/d4ay01382d |
| ‡ Equal contributors: Miaowen Xu and Gaoyang Chen. |
| This journal is © The Royal Society of Chemistry 2025 |

