Design and fabrication of superhydrophobic microstructured grooved substrates to suppress the coffee-ring effect and enhance the stability of Sr element detection in liquids using LIBS
Hongbao
Wang
abc,
Honglian
Li
 *abc,
Xusheng
Huang
abc,
Zhichao
Yao
abc,
Huiming
Zhang
abc,
Yu hang
Yao
abc,
Xiaolin
Yin
abc,
Ziying
Chen
abc and
Lide
Fang
abc
aSchool of Quality and Technical Supervision, Hebei University, Baoding, 071002, China. E-mail: lihonglian@hbu.edu.cn
bNational & Local Joint Engineering Research Center of Metrology Instrument and System, Baoding, Hebei 071002, China
cHebei Key Laboratory of Energy Metering and Safety Testing Technology, Hebei University, Baoding, Hebei 071002, China
First published on 20th November 2024
Abstract
A new technique has been developed to enhance the stability of laser-induced breakdown spectroscopy (LIBS) in the analysis of dry droplets by mitigating the coffee ring effect (CRE) on substrates with superhydrophobic microstructured grooves. The substrate was prepared from a laser-etched pure copper base, resembling the surface of a lotus leaf, creating a biomimetic superhydrophobic substrate. The superhydrophobic microstructured grooved substrate contained an array of dome-shaped cones with heights of approximately 140 μm and 100 μm, arranged in a periodic pattern of high-low-high. The superhydrophobic properties of the substrate not only evaporation-induced thermal capillary action but also initiated the Marangoni flow, which moves from the periphery to the center of the droplet as it evaporates. This flow mechanism effectively mitigated the CRE by transporting the analyte from the bottom edge of the droplet across its surface to the central peak. To assess how these superhydrophobic microstructured grooved substrates impede the formation of coffee rings, LIBS was deployed to analyze samples from both structured and unstructured grooved substrates. The results indicated that the relative standard deviation (RSD) of the spectral intensity for Sr I at 407.67 nm in substrates with a superhydrophobic microstructured groove edge length of 0.8 mm was 3.6%. In contrast, for the unstructured grooved substrate and a side length of 0.9 mm, the RSD was significantly higher at 25.4%. This research demonstrates that substrates with superhydrophobic microstructured grooves are capable of effectively mitigating the CRE. Additionally, the study examined how the dimensions of these grooves impact the plasma characteristics across two distinct configurations. Based on these observations, calibration curves for Sr were developed using substrates with groove side lengths of 0.6 mm and 0.8 mm. The performance of the superhydrophobic microstructured grooved substrate was satisfactory, exhibiting determination coefficients (R2) of 0.994 and 0.995 for the Sr element. The detection limits (LOD) were notably low at 0.16 μg mL−1 and 0.11 μg mL−1. The average relative standard deviations (ARSD) were 7.2% and 4.9%, respectively. These results demonstrate that the superhydrophobic microstructured grooved substrate effectively mitigates the CRE, thereby enhancing the detection sensitivity and prediction accuracy for heavy metals. This provides a robust reference for selecting platforms using LIBS technology in the pre-treatment process.
1 Introduction
Accurate detection of trace elements in liquids is essential for maintaining product quality and ensuring safe production in industrial processes. Sr, a key trace element, is vital in environmental monitoring, biomedicine, and nuclear energy. However, the precise detection of Sr in liquids is challenging due to its extremely low concentration and interference from complex matrices. Therefore, developing an efficient and accurate method for detecting Sr is of paramount importance.1LIBS serves as a non-destructive, swift, and practical method widely used across various sectors, including steel inspection,2 monitoring of nuclear reactions,3 assurance of food safety,4 assessment of agricultural and water pollution,5,6 and safeguarding the environment.7 Challenges arise when employing high-energy lasers to ablate liquid samples since a significant portion of the laser energy is consumed in vaporizing the liquid, which diminishes the energy available for plasma generation. Additionally, the intense pulse of high-power lasers can provoke splashes in the liquid, which in turn extinguishes the plasma.8 Hence, direct analysis of water samples using LIBS faces several technical hurdles.
The pretreatment methods for liquid–solid transformation are considered the most effective approaches for preventing liquid splashing and plasma quenching in liquid detection. Among these, the dried droplet method (DDM) is commonly used due to its simple sample pretreatment and minimal substrate effects. However, the DDM is affected by the coffee ring effect (CRE),9 which can reduce the stability and precision of LIBS detection. Therefore, inhibiting the CRE plays a crucial role in improving the solute distribution, stability, and sensitivity of LIBS. Numerous studies have been reported that can suppress the CRE. For instance, Yunker and colleagues10 demonstrated that employing ellipsoidal polystyrene particles could obstruct the gathering of spherical particles at the triple-phase boundary, thus curtailing the CRE. Anyfantakis et al.11 investigated the suppression of the coffee ring effect by adding different concentrations of surfactants to alter the surface tension gradient of the droplets, resulting in various deposition patterns. However, such methods may encounter issues in LIBS detection due to potential interference between the added substances and the spectral lines of the analytes.
To enhance the stability of LIBS detection for trace elements in liquids, numerous studies have employed laser-patterning methods to improve the stability or intensity of spectral signals. Bae et al.12 utilized laser patterning to create a hydrophilic silicon wafer (LPSW) substrate, allowing solutes to be retained in densely packed grooves on the substrate. The quantitative analysis of potassium (K) showed an average RSD of less than 6%. Wang et al.13 fabricated hydrophilic micro/nano-structured layers using femtosecond lasers for the detection of lead (Pb) and chromium (Cr) in water, achieving enhancements in spectral signals, with stability reaching 19.6% and 14.6%, respectively. Niu et al.14 conducted the detection of nickel (Ni), chromium (Cr), and cadmium (Cd) in aqueous solutions by polishing the surface of aluminum substrates with lasers, resulting in a relatively uniform distribution of the solution in the pre-treated grooves and an RSD of approximately 7%.
The above studies employed laser-patterning methods to create hydrophilic substrates, allowing droplets to remain in densely packed grooves. However, these hydrophilic substrates still experience droplet contraction during evaporation, which does not effectively suppress the coffee ring effect, resulting in an RSD of over 6%. Research has shown that hydrophobic surfaces can reduce the contact area between droplets and the substrate, leading to a more uniform deposition of solutes within a smaller area after evaporation, thus improving the stability of spectral signals. For example, Liu et al.15 proposed a superhydrophobic coating, created by sequentially layering polymers and nanoparticles, to suppress the coffee ring effect (CRE) and enhance the stability of LIBS. This study indicated that the Marangoni flow induced by the surface tension gradient of droplets on the superhydrophobic substrate suppressed the CRE, achieving an RSD of 3%. Spraying hydrophobic agents directly onto smooth, clean substrate surfaces is a simple and quick method to prepare superhydrophobic surfaces. However, there are issues with uneven spreading of the agents on the substrate, leading to inconsistencies in wettability across different surface areas. Additionally, the liquid film deposited on the coating can be easily disturbed by laser shock waves, causing position shifts that affect the repeatability of measurements.
Inspired by the surface structure of lotus leaves, micro/nano-scale surface microstructures exhibit enhanced hydrophobicity.16 Therefore, a laser-etched conical array microstructured hydrophobic substrate was developed, where the cones within the microstructure display a periodic arrangement of high-low-high. The sample deposition layer within the substrate adheres firmly and is uniformly deposited. In this work, the superhydrophobic microstructured grooved substrate obtained through laser etching effectively suppressed the coffee ring effect (CRE). Detection via Laser-Induced Breakdown Spectroscopy (LIBS) revealed a minimum relative standard deviation (RSD) of 3.6%. By performing line scans using LIBS on samples on both superhydrophobic microstructured grooved substrates and smooth grooved substrates, we analyzed the impact of groove side lengths (0.6, 0.8, 0.9, 1.1, and 1.3 mm) on detection stability for both substrate types. The suppressive effects of different substrates on the coffee ring phenomenon were verified. Using Sr as the analytical element, we established a calibration curve to characterize the sensitivity and precision of LIBS detection of the DDM on the superhydrophobic grooved substrate.
2 Experimental
2.1 Substrate analysis
The specimen, a square-shaped substrate, was fabricated using a pure copper base with dimensions of 100 mm × 100 mm and a thickness of 3 mm. As shown in Fig. 1, the superhydrophobic microstructured grooved substrates with side lengths of 0.6, 0.8, 0.9, 1.1, and 1.3 mm were obtained through laser etching. A mask featuring small rectangular openings measuring 0.6, 0.8, 0.9, 1.1, and 1.3 mm was crafted from PTE tape and applied to the pure copper substrate. This customization facilitated the creation of a substrate devoid of microstructural grooves, with each groove spaced 5 mm apart.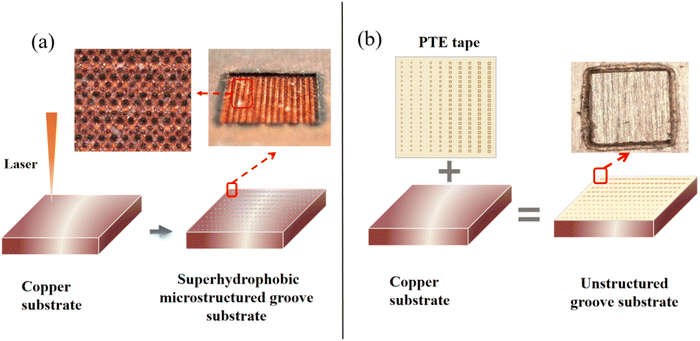 | ||
| Fig. 1 Preparation process of substrates: (a) superhydrophobic microstructured grooved substrate; (b) unstructured grooved substrate. | ||
The superhydrophobic microstructured substrates were etched using a fiber laser (RFL-20). The laser power was set to 20 W, with a frequency of 20 Hz, and etching was performed at a speed of 800 mm s−1. The focal length was 170 mm, and the spacing between adjacent scan points was set to 60 μm. The etching was repeated multiple times within the designated area until the groove depth reached approximately 100 μm, at which point the etching was stopped. This process resulted in a periodically arranged microstructure with high-low variations on the surface.
The microstructure on the copper plate includes arrays of conical structures with heights of approximately 140 μm and 100 μm, exhibiting a periodic distribution of high-low-high. The distance between every two rows of 140 μm high cones is 110 μm. The diameter at the base of the cones is DF(b) = 30 μm ± 12.06, while the diameter at the top is DF(t) = 15 μm ± 4.36.
The 3D microscopy images of the prepared sample surface's microstructure, captured using a KEYENCE VHX-X1, are shown in Fig. 2(a) and (b).
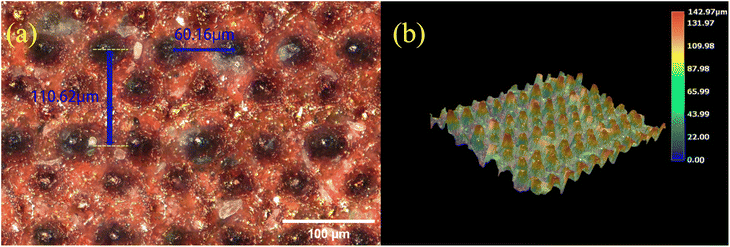 | ||
| Fig. 2 3D microscopy images of the surface microstructure of the superhydrophobic grooved substrate: (a) 100 μm; (b) simulated image generated by the 3D microscope. | ||
Fig. 3 illustrates the process used to evaluate the wettability of superhydrophobic surfaces with and without microstructures. The evaluation was conducted by measuring the contact angles of 1 μL droplets on each surface type. For each surface, ten independent angle measurements were recorded and analyzed using ImageJ software to establish an average contact angle. The microstructured grooved substrate with superhydrophobic properties showed a contact angle of 159.2°, while the unstructured grooved substrate exhibited a contact angle of 77.2°.
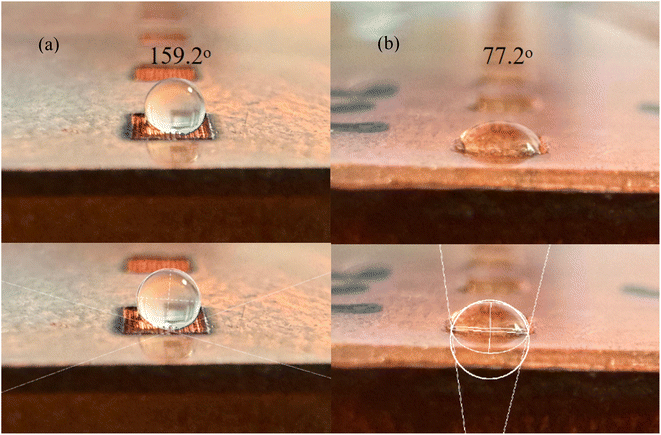 | ||
| Fig. 3 Contact angle of 1 μL droplets in the (a) superhydrophobic microstructured grooved substrate and (b) unstructured grooved substrate. | ||
2.2 Sample preparation
The methodology employed in this study involved the dried droplet technique for analyzing liquid samples, as depicted in Fig. 4. (1) The preparation of the standard solution entailed solvating strontium chloride (SrCl2·2H2O, sourced from Sinopharm Chemical Reagent Co., Ltd., China) in deionized water. This solution was homogenized using vortex oscillation to ensure complete dissolution of SrCl2·2H2O. (2) A precise volume of 1 μL from this mixture was deposited onto a clean substrate via a micropipette (Dragon Laboratory, China). (3) This substrate, bearing the droplet, was placed on a heating device maintained at 70 °C to facilitate evaporation until dryness was achieved. The evaporation temperature was set at 70 °C because a temperature that is too low can affect the evaporation rate of the droplets, while a temperature that is too high, reaching the boiling point of the droplets, can cause splashing and introduce significant errors. Additionally, research analysis indicates that at around 70 °C, on silicon substrates, the evaporation and deposition of droplets exhibit a single-ring morphology.17 This is due to the fact that during evaporation on such superhydrophobic substrates, the early evaporation morphology shows a constant contact angle (CCA).18 As the contact radius gradually decreases, the sample will display a more uniform deposition morphology. For both qualitative and quantitative evaluations, sample concentrations were prepared at 10, 20, 30, 50, 80, and 90 μg mL−1.2.3 Experimental system
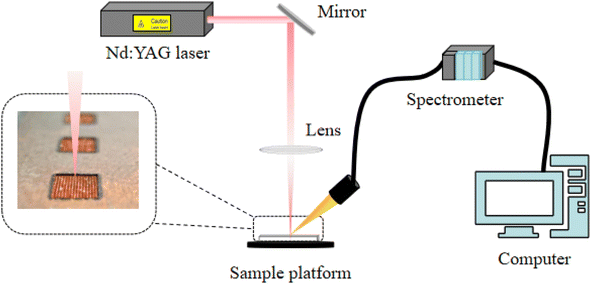
Fig. 5 illustrates the schematic of the LIBS setup utilized in the study. A Nd:YAG laser (model Dawa 200, manufactured by Beijing Raybom Optoelectronics Technology Co., Ltd., China) emitting at a wavelength of 1064 nm was used. The laser's output energy was maintained at 100 mJ. A mirror was used to redirect the laser beam, which was then concentrated by a lens with a 100 mm focal length onto the target surface to perform ablation. The size of the laser spot focused on the sample was roughly 0.1 mm in diameter. A spectrometer (MX2500+, Ocean Optics, USA) equipped with three channels captured the plasma emissions. This was accomplished using an optical fiber bundle with a diameter of 2 mm. The spectrometer's operational wavelength spanned from 200 to 600 nm and achieved a resolution of 0.1 nm. All experiments were conducted at room temperature in a standard air environment.2.4 Data collection and analysis
The research utilized a LIBS system for ablation and spectral generation from dried droplet residues positioned on both superhydrophobic microstructured grooved and flat grooved substrates. The emission line at 407.77 nm of the Sr element was chosen for both qualitative and quantitative elemental analysis. Additionally, the stability of Sr detection was evaluated using substrates with varying groove sizes. LIBS was employed to perform line scans with increments of 0.1 mm on dried sample areas. Ten parallel samples were prepared for each structure. Symmetric two-dimensional line scanning was executed across all zones of the dried droplets on the substrates, aiming to assess the occurrence or prevention of the CRE. This led to a correlation analysis, mapping the spectral intensity of the Sr I 407.67 nm emission line on the y-axis against the corresponding positions on the x-axis. This analysis delineated the distribution of Sr content in dried droplets on both superhydrophobic microstructured grooved and unstructured grooved substrates, as well as the average intensity of characteristic spectral lines and the RSD.To develop the calibration curve in the LIBS analysis, varying concentrations of the Sr element were analyzed to correlate the emitted spectral line intensity with the Sr concentration. This correlation was achieved using the standard addition method. The calibration performance was quantified through several metrics: R2, which assesses the linearity of the calibration curve (approaching 1 indicates enhanced linearity); LOD, which measures the method's sensitivity (lower LOD values signify increased sensitivity); and ARSD, which gauges the precision of the measurement (lower ARSD values suggest improved precision). These metrics were evaluated across different substrate types to compare their impact on the curve's linearity, sensitivity, and precision.
3 Results and discussion
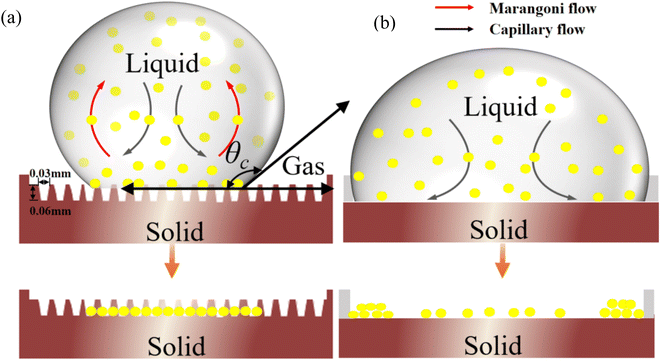
3.1 Theoretical analysis of the hydrophobic principle of droplets in superhydrophobic microstructured grooved substrates and the suppression of the coffee ring effect by evaporative capillary flow
cos![[thin space (1/6-em)]](https://www.rsc.org/images/entities/char_2009.gif) θc = f1 θc = f1![[thin space (1/6-em)]](https://www.rsc.org/images/entities/char_2009.gif) cos cos![[thin space (1/6-em)]](https://www.rsc.org/images/entities/char_2009.gif) θ1 + f2 θ1 + f2![[thin space (1/6-em)]](https://www.rsc.org/images/entities/char_2009.gif) cos cos![[thin space (1/6-em)]](https://www.rsc.org/images/entities/char_2009.gif) θ2 θ2 | (1) |
In the Cassie–Baxter model, θc represents the apparent contact angle, while θ1 and θ2 denote the intrinsic contact angles of the liquid on the respective surfaces of the two components (solid and gas). The fractions f1 and f2 reflect the proportional areas of the two components on the liquid surface, respectively. Since it is assumed that only two components are present, f1 + f2 = 1. If air is trapped in the grooves of the rough surface, the droplet rests on a composite surface formed by the substrate and air, without completely filling the grooves. The surface is composed of solid and gas phases, resulting in a composite contact. In this case, the actual contact area of the droplet is made up of the contact area between the droplet and the solid substrate, and the contact area between the droplet and the air trapped in the grooves. The intrinsic contact angle of the droplet with air is 180°, and the formula for the apparent contact angle at equilibrium (1) can be expressed as:
cos![[thin space (1/6-em)]](https://www.rsc.org/images/entities/char_2009.gif) θc = f1(cos θc = f1(cos![[thin space (1/6-em)]](https://www.rsc.org/images/entities/char_2009.gif) θ1 + 1) − 1 θ1 + 1) − 1 | (2) |
Eqn (2) suggests that significant roughness on a solid surface traps air within its grooves, which increases the interface where the liquid meets air instead of the solid itself. This phenomenon effectively reduces the direct contact between liquid and solid surfaces. Consequently, the apparent contact angle, denoted as θc, increases, thereby enhancing the hydrophobic properties of the surface.
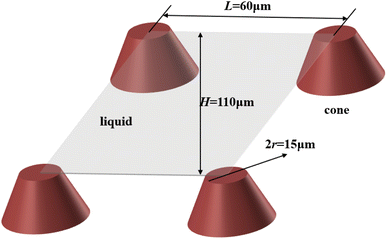
According to the Cassie–Baxter model, the droplet only contacts the top of the conical microstructured substrate, while the other areas are filled with air. Therefore, to analyze the apparent area percentages of solid and gas on the liquid surface, the top of the superhydrophobic microstructure in this study is simplified to a geometric diagram shown in Fig. 6, considering only the contact between the liquid and the top of a dome-shaped cone with a height of 140 μm. The Feret diameter of the cone top measured with a 3D microscope is DF(t) = 2r = 15 μm, with each cone spaced L = 60 μm apart, and the distance H = 110 μm between the tops of two rows of cones, each 140 μm high. Therefore, it can be derived from eqn (3):
 | (3) |
The intrinsic contact angle of the droplet with the copper substrate is 70°, so it can be derived from eqn (2) as θc = 165°. Since there are also cones of approximately 100 μm in height present between the two rows of 140 μm cones, contact with the liquid may occur, leading to an actual measured hydrophobic angle that is smaller than the contact angle obtained from theoretical analysis.
During the advanced stages of liquid evaporation, the liquid in contact with a rough solid surface initially exhibits a Cassie–Baxter state. As the air in the microgrooves of the solid surface is progressively displaced by the liquid, the grooves become completely filled, leaving no residual air.22 The capillary interaction between the aqueous solution and the microstructures within the grooves facilitates the formation of a liquid film on the substrate, which is inherently resistant to shrinkage throughout the drying phase.12 Therefore, this process effectively prevents the accumulation of edge sedimentation.
3.2 Qualitative analysis of elements
In the analysis presented in Fig. 8, the Sr element spectral line intensity at the center of the superhydrophobic microstructured grooved substrate is significantly higher than that at the center of the groove constrained by PTE tape. Compared to the substrate without microstructured grooves constrained by PTE tape, the intensity of the Sr I: 421.50 nm line increased by 7.74 times, and the intensity of the Sr I: 407.67 nm line increased by 6.75 times.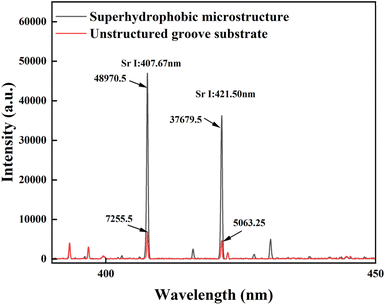 | ||
| Fig. 8 Comparison of Sr element spectral line intensities between the superhydrophobic microstructured grooved substrate and unstructured grooved substrate. | ||
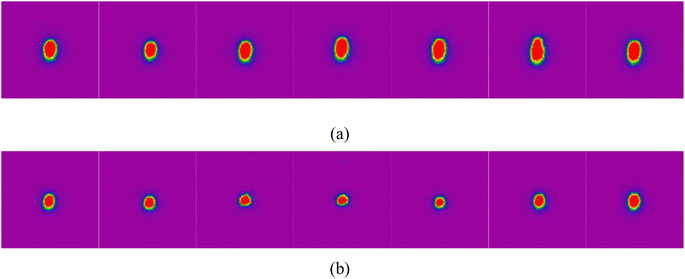
Fig. 9 and 10 present a comparison of the spectral line intensity stability and plasma variation along the centerline for substrates with a side length of 0.6 mm – superhydrophobic microstructured grooved substrate and unstructured grooved substrate. From Fig. 9, it is evident that the spectral signal in the unstructured grooved substrate shows a trend of initially decreasing and then increasing with position, exhibiting a noticeable coffee-ring deposition effect. As illustrated in Fig. 10(a), the plasma on the unstructured grooved substrate also exhibits a trend of initially decreasing and then increasing. In contrast, the spectral line intensity and plasma size in the superhydrophobic microstructured substrate remain relatively stable with position, demonstrating a suppression of the CRE. It is evident from Fig. 10 that the plasma morphology in the superhydrophobic microstructured grooved substrate is larger than that in the substrate without microstructures. The regular array structure on the superhydrophobic microstructured grooved substrate causes the incident laser to reflect multiple times within the grooves of the sample, reducing the reflectivity of the incident laser13 and significantly enhancing the absorption efficiency of the sample. Additionally, the distribution of solvent deposition on the hydrophobic substrate is more uniform, resulting in a larger plasma morphology within the superhydrophobic microstructured grooved substrate compared to the substrate without microstructures.
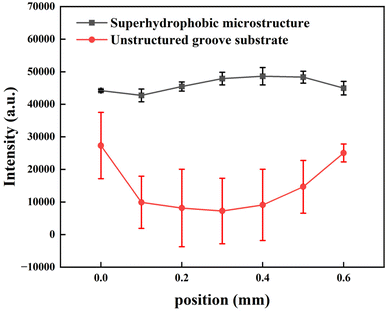 | ||
| Fig. 9 Relationship between the spectral line intensity and centerline position of the Sr element in two different substrate structures. | ||
As illustrated in Fig. 11(a), the intensity of the central spectral line on the superhydrophobic microstructured grooved substrate remains relatively stable across positions as the side length of the rectangular grooves increases, displaying a consistent distribution trend. However, Fig. 11(b) demonstrates that when the groove length varies between 0.6 mm and 1.3 mm, the spectral intensity stability at the central line position is compromised, suggesting an uneven distribution of liquid sample deposition on the unstructured grooved substrate.
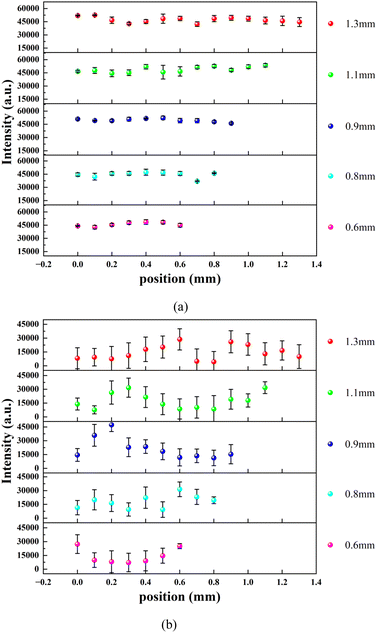 | ||
| Fig. 11 Centerline spectral line intensity variation trends in the (a) superhydrophobic microstructured grooved substrate; (b) unstructured grooved substrate. | ||
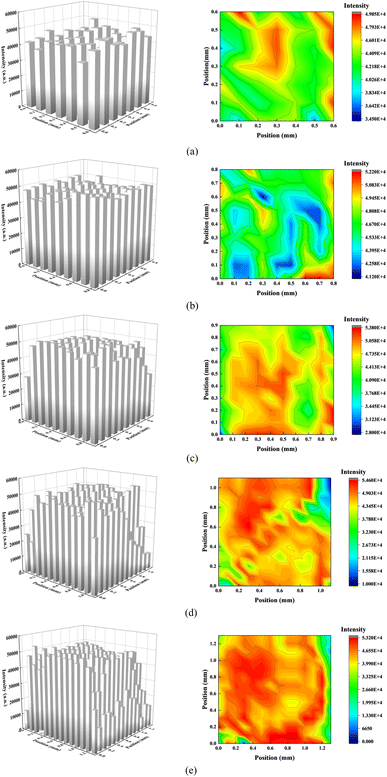
Fig. 12 illustrates the spatial distribution of spectral line intensity over a microstructured, superhydrophobic grooved substrate, with groove side dimensions ranging from 0.6 mm to 1.3 mm. An increase in the side length correlates with a marked reduction in spectral intensity near the edges of the substrate. This phenomenon results from the superhydrophobic properties of the substrate, which confine droplet deposition to a specific area. Despite variations in droplet placement, the spectral intensity within this confined zone shows remarkable stability, demonstrating the effectiveness of the substrate in mitigating the CRE. Unlike typical superhydrophobic coatings where droplets may migrate across the surface, leaving a trail of solute, the microstructured substrate restricts each droplet to a single use, enhancing both substrate utilization and analysis reliability. In contrast, this structure enhances stability, facilitating the placement of multiple parallel samples on a single substrate. Additionally, the stability of the deposited samples mitigates the issue of splattering in the deposited film.
Fig. 13 illustrates the spectral intensity distribution across the entire region of the unstructured grooved substrate. In this configuration, the spectral intensity profile of droplets features a distinct pattern: the intensity is subdued at the center and elevated at the periphery. But the precise shape of this distribution is non-uniform and lacks regularity. Therefore, the stability of the detection will diminish.
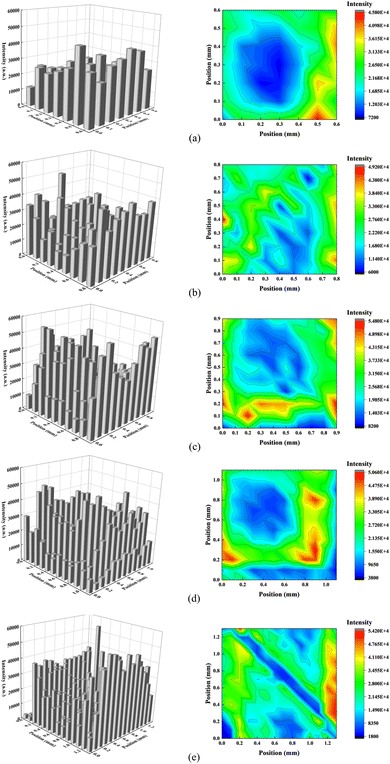 | ||
| Fig. 13 Schematic diagram of spectral intensity distribution in the entire region of unstructured grooved substrate: (a) 0.6 mm, (b) 0.8 mm, (c) 0.9 mm, (d) 1.1 mm, and (e) 1.3 mm. | ||
Fig. 14(a) illustrates that as the side length of the substrate increases, the intensity of the spectral lines initially increases and then decreases. Concurrently, the RSD first decreases and subsequently increases, with a critical point occurring at a side length of 0.8 mm. This behavior is attributed to the constant area covered by 1 μL droplets on the superhydrophobic surface, which results in a tendency for droplet aggregation towards the central region. Therefore, if the base length of the groove surpasses the deposition area, there will be a marked reduction in the spectral line intensity at the edges, which adversely affects the stability of the detection signal.
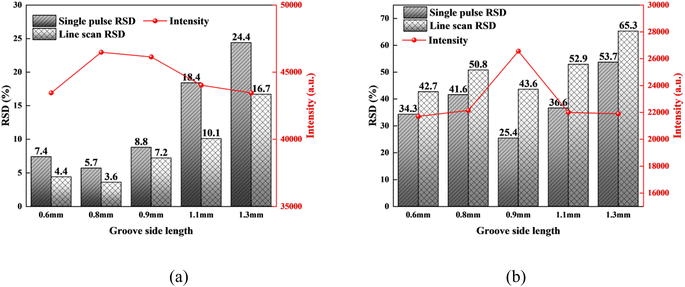 | ||
| Fig. 14 Relationship between the spectral line intensity and RSD of different sizes of the (a) superhydrophobic microstructured grooved substrate and (b) unstructured grooved substrate. | ||
In cases where groove dimensions are smaller, obstruction by the groove walls may result in incomplete collection of radiation emitted from the plasma. Additionally, such confinement escalates the plasma density, intensifying its inherent shielding effect, which consequently diminishes the intensity of the observed spectral signals.
Fig. 14(b) illustrates a distinct trend where the spectral line intensity initially increases and subsequently falls with increasing side length, with a critical turning point at 0.9 mm. In contrast, the RSD displays an opposite pattern, decreasing initially and then increasing. The attenuation in spectral line intensity at smaller side lengths can be attributed to incomplete collection of radiation from the plasma due to blockages by the groove's inner walls. Concurrently, at smaller side lengths, the plasma density increases, enhancing the plasma shielding effect which further diminishes the spectral signals. In the case of larger side lengths, the extended travel and duration of the laser plasma's reflected shock wave back to the plasma plume results in a weakened shock wave intensity, thus diminishing the spectral line intensity. Therefore, by appropriately selecting the groove edge length, optimal signal enhancement can be achieved.
In plasmas, temperature and electron density are key indicators for analyzing dynamic behaviors. The computation of these parameters across varying distances from the focusing lens to the surface of the sample is fundamental. By employing the local thermal equilibrium model, one can determine the plasma temperature through the application of the Boltzmann23 plot method, as delineated by the following equation:
 | (4) |
The intensity of the spectrum, denoted as Iki, corresponds to the center wavelength λ of the spectral line. The degeneracy of the energy level involved in the spectral transition is represented by gk. The transition probability is indicated by Aki. The excitation energy is given by ΔE, with kB being the Boltzmann constant and T representing the plasma temperature. There exists a constant C in this context. Linear fitting is applied to ln(Iki/gkAki) and ΔE, as outlined in eqn (3), to determine the slope −1/kBT. This calculation facilitates the estimation of the plasma temperature, T. The spectral lines selected for plasma temperature determination include Cu I 324.75 nm, Cu I 327.39 nm, and Cu I 338.07 nm, as depicted in Fig. 15. The physical characteristics of these spectral lines are detailed in Table 1, with parameter data obtained from the NIST.
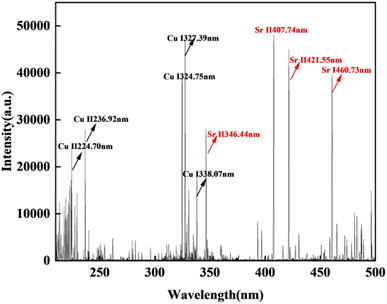 | ||
| Fig. 15 Distribution of characteristic spectral lines of Cu and Sr elements on superhydrophobic substrates. | ||
| λ/nm | E i | E k | ΔE/eV | Ag/108 s−1 |
|---|---|---|---|---|
| 324.75 | 0 | 30![[thin space (1/6-em)]](https://www.rsc.org/images/entities/char_2009.gif) 783.697 783.697 |
3.82 | 5.58 |
| 327.39 | 0 | 30![[thin space (1/6-em)]](https://www.rsc.org/images/entities/char_2009.gif) 535.324 535.324 |
3.79 | 2.75 |
| 338.07 | 118![[thin space (1/6-em)]](https://www.rsc.org/images/entities/char_2009.gif) 531.906 531.906 |
148![[thin space (1/6-em)]](https://www.rsc.org/images/entities/char_2009.gif) 102.986 102.986 |
3.67 | 2.4 |
The electron density of plasma is determined using the half-width Δλ1/2 of the spectral line, according to the following equation.24
 | (5) |
where ω is the electron collision parameter and Ne is the electron density.
As shown in Fig. 16, as the groove size increases from 0.6 mm to 1.3 mm, there is a gradual decrease in both plasma temperature and electron density on superhydrophobic microstructured and non-structured grooved substrates. When the groove size is 0.6 mm, the structural constraints cause the electron density and plasma temperature to be relatively high. As the degree of confinement gradually decreases, both the electron density and plasma temperature also decrease.25 For the detection of the Sr element in the copper substrate, there are no spectral line interferences around the characteristic peak of Sr at 407.74 nm. However, for the detection of other elements, there may be interference from spectral lines of the substrate elements that are close to or overlapping with the lines of the elements being analyzed. Therefore, to reduce the impact of this phenomenon, it is necessary to decrease the Stark broadening of the spectral lines,24 which requires lowering the electron density by increasing the groove size.
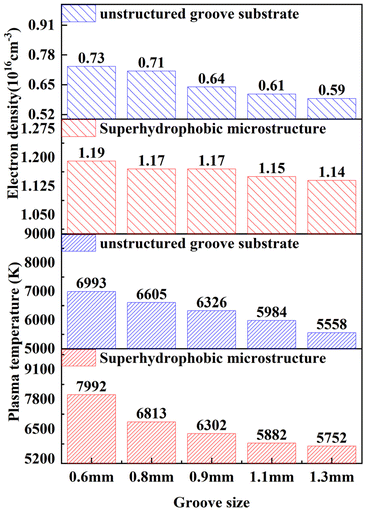 | ||
| Fig. 16 Relationship between the plasma temperature and electron density on substrates with different sizes of superhydrophobic microstructures and grooves without microstructures. | ||
3.3 Quantitative analysis of elements
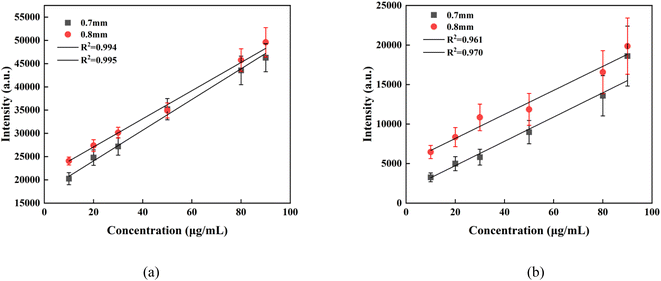
Following a quantitative examination of the Sr element concentration and the intensity of spectral lines in droplets employing the standard addition approach, calibration curves were generated. These curves pertained to both superhydrophobic grooved microstructured substrates and unstructured grooved substrates, with side dimensions of 0.6 mm and 0.8 mm, utilizing the 407.64 nm emission line of Sr I. For each concentration sample depicted in Fig. 17, an array row scanning ablation method was employed, incorporating a total of 10 parallel samples per concentration. A rectangular array facilitated the collection of 36 spectra, with a spacing of 0.1 mm between samples, subsequently integrated into a single spectrum for analysis. This process allowed for the calculation of the RSD. Calibration curves were then evaluated for substrates with and without superhydrophobic microstructured grooves. Notably, the calibration curves for Sr on the 0.6 mm and 0.8 mm superhydrophobic microstructured substrates demonstrated greater linearity (R2 = 0.994, 0.995) compared to those on the unstructured grooved substrate (R2 = 0.961, 976). Additional assessments of quantitative capabilities, including the ARSD and the LOD for Sr, were conducted, and the results are detailed in Table 2. The ARSD for Sr on the 0.8 mm superhydrophobic microstructured substrate was significantly lower (4.9%) than on the unstructured grooved substrate (15.5%), underscoring superior analytical accuracy. Furthermore, the LOD of Sr on the superhydrophobic substrate was 0.11 μg mL−1, reflecting its heightened sensitivity.| Substrate | Length of side (mm) | R 2 | ARSD (%) | LOD (μg mL−1) |
|---|---|---|---|---|
| Superhydrophobic | 0.6 | 0.994 | 7.2 | 0.16 |
| Microstructured | 0.8 | 0.995 | 4.9 | 0.11 |
| Unstructured | 0.6 | 0.961 | 17.3 | 0.35 |
| Grooved | 0.8 | 0.970 | 15.5 | 0.2 |
4 Conclusion
In this investigation, a substrate with superhydrophobic and microstructured grooves was created using laser ablation. This design effectively mitigated the CRE and significantly improved the stability of the DDM. The detection of the Sr element in liquid samples was conducted using a superhydrophobic microstructured grooved substrate, which required only a simple pretreatment process. Theoretical analysis and experimental findings have shown that due to the superhydrophobic characteristics of the substrate, the evaporation process induces not only capillary flow but also a Marangoni flow directed from the periphery to the center of the droplet. This Marangoni flow counteracts the CRE by moving analytes from the bottom edge of the droplet along its surface towards the center.According to the line scan results of dried droplets on the superhydrophobic microstructured grooved substrate, the RSD of Sr I 407.67 nm spectral intensity was the lowest on the substrate with a side length of 0.8 mm, reaching 3.6%; for the substrate with unstructured grooves with a side length of 0.9 mm, the minimum RSD observed was 25.4%. This configuration resulted in 85.8% reduction in RSD. Therefore, the rectangular superhydrophobic grooved microstructured substrate is highly effective in mitigating the CRE, thereby enhancing the stability and reliability of LIBS technology in analyzing dried droplets. The calibration curves indicate that the determination coefficient (R2) for the Sr element on a superhydrophobic microstructured grooved substrate with a side length of 0.8 mm was 0.995, representing a 2.6% increase compared to an unstructured grooved substrate. The LOD of this substrate was 0.11 μg mL−1, showing a 45% improvement over the unstructured grooved substrate. Additionally, the ARSD was 4.9%, which is 63% lower than that observed on the unstructured grooved substrate. The findings suggest that the superhydrophobic grooved microstructured substrate exhibits superior linearity, enhanced sensitivity, and improved accuracy.
The use of a superhydrophobic microstructured grooved substrate can effectively mitigate the CRE in the DDM, leading to improved stability and sensitivity in subsequent analyses. This kind of substrate prevents the common issue of edge deposition, offering a straightforward and reliable platform for the dried droplet analysis technique.
Data availability
The authors confirm that the data supporting the findings of this study are available within the article.Author contributions
Hongbao Wang: writing – original draft, methodology, investigation, formal analysis. Honglian Li: writing – review & editing, funding acquisition, conceptualization. Xusheng Huang: methodology, investigation, formal analysis. Huiming Zhang: investigation. Yu hang Yao: writing – review & editing. Xiaolin Yin: data analysis, sample processing. Ziying Chen: methodology. Lide Fang: supervision, funding acquisition.Conflicts of interest
The authors declare that they have no conflict of interest.Acknowledgements
This work was supported by the National Natural Science Foundation of China (No. 62173122), the Key Projects of Hebei Natural Science Foundation (No. F2021201031), the Funding Project for Introducing Overseas Students in Hebei Province (No. C20210312), the Key Research and Development Project of Universities in Hebei Province (241790143A), and the Post-graduate's Innovation Fund Project of Hebei University (No. HBU2024SS010).References
- L. Ren, S. Li and W. Ye, et al., Tracking organic matrix in the seashell by elemental map under laser-induced breakdown spectroscopy, Talanta, 2024, 271, 125658 CrossRef PubMed.
- Q. Ma, Z. Liu and T. Zhang, et al., Multielement simultaneous quantitative analysis of trace elements in stainless steel via full spectrum laser-induced breakdown spectroscopy, Talanta, 2024, 125745 CrossRef.
- P. A. Gaviola, M. Sallese and M. S. Anzorena, et al., Development of a simple method based on LIBS for evaluation of neutron production targets made of hydrogen isotopes, Measurement, 2021, 177, 109245 CrossRef.
- A. Safi, J. E. Landis and H. G. Adler, et al., Enhancing biomarker detection sensitivity through tag-laser induced breakdown spectroscopy with NELIBS, Talanta, 2024, 271, 125723 CrossRef PubMed.
- M. Yan, L. Honglian and W. Yitong, et al., Influence of Planar Mirror Confinement and Temperature Control upon the Elemental Analysis of Soil by Laser-Induced Breakdown Spectroscopy, Anal. Lett., 2023, 56(17), 2792–2802 CrossRef.
- H. Li, Y. Meng and J. Sun, et al., Research on the traceability method of heavy metal pollution in typical wetlands, J. Laser Appl., 2022, 34(3), 032005 CrossRef.
- J. Nie, L. Guo and Y. Liu, et al., Heavy metals high-sensitive detection by laser-induced breakdown spectroscopy based on radial electroosmotic flow-driven enrichment, Talanta, 2024, 267, 125199 CrossRef PubMed.
- V. Lazic, LIBS Analysis of Liquids and of Materials Inside Liquids, Springer, Berlin, Heidelberg, 2014, DOI:10.1007/978-3-642-45085-3-8.
- D. Mampallil and B. H. Eral, A review on suppression and utilization of the coffee-ring effect, Adv. Colloid Interface Sci., 2018, 252, 38–54 CrossRef PubMed.
- P. J. Yunker, T. Still, M. A. Lohr and A. G. Yodh, Suppression of the coffee-ring effect by shape-dependent capillary interactions, Nature, 2011, 476(7360), 308–311 CrossRef PubMed.
- M. Anyfantakis, Z. Geng, M. Morel, S. Rudiuk and D. Baigl, Modulation of the coffeering effect in particle/surfactant mixtures: the importance of particle-interface interactions, Langmuir, 2015, 31(14), 4113–4120 CrossRef PubMed.
- D. Bae, S. Nam and S. Han, et al., Spreading a water droplet on the laser-patterned silicon wafer substrate for surface-enhanced laser-induced breakdown spectroscopy, Spectrochim. Acta, Part B, 2015, 113, 70–78 CrossRef CAS.
- Q. Wang, Y. Liu and L. Jiang, et al., Metal micro/nanostructure enhanced laser-induced breakdown spectroscopy, Anal. Chim. Acta, 2023, 1241, 340802 CrossRef.
- S. Niu, L. Zheng and A. Q. Khan, et al., Laser-induced breakdown spectroscopic detection of trace level heavy metal in solutions on a laser-pretreated metallic target, Talanta, 2018, 179, 312–317 CrossRef.
- L. Yuanchao, P. Jie and Z. Guobin, et al., Stable and ultrasensitive analysis of organic pollutants and heavy metals by dried droplet method with superhydrophobic-induced enrichment, Anal. Chim. Acta, 2021, 1151, 338253 CrossRef.
- S. Taolei, F. Lin and G. Xuefeng, et al., Bioinspired surfaces with special wettability, Acc. Chem. Res., 2005, 38(8), 644–652 CrossRef PubMed.
- X. Zhong, C. Wu and F. Duan, From enhancement to elimination of dual-ring pattern of nanoparticles from sessile droplets by heating the substrate, Appl. Therm. Eng., 2017, 115, 1418–1423 CrossRef.
- F. C. Wang and H. A. Wu, Molecular origin of contact line stick-slip motion during droplet evaporation, Sci. Rep., 2015, 5(1), 17521 CrossRef PubMed.
- A. B. D. Cassie and S. Baxter, Wettability of porous surfaces, Trans. Faraday Soc., 1944, 40, 546–551 RSC.
- H. Hu and R. G. Larson, Marangoni effect reverses coffee-ring depositions, J. Phys. Chem. B, 2006, 110(14), 7090–7094 CrossRef PubMed.
- L. E. Scriven and C. V. Sternling, The Marangoni effects, Nature, 1960, 187(4733), 186–188, DOI:10.1038/187186a0.
- N. A. Patankar, Transition between super-hydrophobic states on rough surfaces, Langmuir, 2004, 20(17), 7097–7102 CrossRef.
- M. N. Shaikh, S. Hafeez and A. M. Kalyar, et al., Spectroscopic characterization of laser ablation brass plasma, J. Appl. Phys., 2008, 104(10), 103108 CrossRef.
- A. Lesage, Experimental Stark widths and shifts for spectral lines of neutral and ionized atoms a critical review of selected data for the period 2001–2007, New Astron. Rev., 2009, 52(11–12), 471–535 CrossRef.
- C. Nan, S. Xinjian and W. Jian, et al., Sensitive determination of rare earth elements in liquid samples by spatial confinement assisted surface enhanced laser-induced breakdown spectroscopy, Opt Laser. Technol., 2024, 170, 110279 CrossRef.
| This journal is © The Royal Society of Chemistry 2025 |


