Synthesis of a fluorescent probe based on rhodol's highly selective recognition of H2S and its application in cells†
Jiefeng
Tang
,
Xiangjun
Chen
,
Zhenzhen
Wang
,
Shuntao
Zhang
,
Juan
Wang
 * and
Chunru
Cheng
 *
*
College of Chemical Engineering, Sichuan University of Science & Engineering, Zigong 643000, China. E-mail: wangjuan2022@suse.edu.cn
First published on 8th November 2024
Abstract
A new fluorescent probe for detecting hydrogen sulfide (H2S) was developed through the thiolation reaction of 2-chloro-1,4-naphthoquinone. Rhodol was employed as the fluorophore, while 2-chloro-1,4-naphthoquinone acted as the reactive group for H2S. The probe remains non-fluorescent under sunlight but emits a strong fluorescence upon reaction with H2S, accompanied by a visible color change in the solution. This selective H2S probe features rapid detection (under 1 minute), high photostability, and a very low detection limit (LOD = 44.3 nM), well below the levels that trigger physiological responses. The probe's mechanism was confirmed through 1H-NMR, HR-MS, and DFT analysis. With low cytotoxicity and high biocompatibility, the probe has been effectively applied for fluorescent bioimaging of H2S in living cells.
1. Introduction
Hydrogen sulfide (H2S) is recognized alongside NO and CO as one of the three primary gaseous mediators in biological systems. In modern analytical chemistry and biomedical research, H2S is acknowledged as a significant biomolecular signal closely associated with various physiological and pathological processes.1–5 It is endogenously synthesized viaL-cysteine, catalyzed by cystathionine-β-synthase, cystathionine-γ-lyase, and 3-mercaptopyruvate sulfurtransferase. Abnormal levels of hydrogen sulfide have been linked to numerous diseases, including diabetes, Alzheimer's disease, Down syndrome, and Parkinson's disease.6–11 Consequently, it is crucial to develop effective methods for sensitive and selective detection of H2S in biological systems. Common analytical techniques such as colorimetry,12 electrochemical analysis,13 polarography,14 and sulfide precipitation15 have been employed to detect H2S. Compared to these methods, fluorescence imaging, with its high spatial and temporal resolution, has been widely used as an effective tool for monitoring biomolecules within biological systems.16–25 Recently, significant advances have been made in detecting H2S in blood and cells, employing various photomechanisms in the design of fluorescent probes for H2S, including intramolecular charge transfer (ICT), fluorescence resonance energy transfer (FRET), and rhodamine-based turn-on mechanisms.26The typical approach for detecting H2S using fluorescent probes involves a specific chemical reaction between the probe's reactive group and H2S, such as sulfidation, reduction, or addition reactions. These reactions induce significant changes in the fluorescence properties of the probe. By monitoring these changes, researchers can quantitatively detect and track the production and metabolism of H2S within biological systems. In this work, we introduce a novel fluorescent probe, TF-1, designed specifically for H2S detection, which leverages the turn-on mechanism of rhodol. Unlike conventional probes that rely on general reaction mechanisms, TF-1 employs a strategic design where the hydroxyl group of rhodol is masked by a naphthoquinone moiety, maintaining the rhodol in a non-fluorescent spiro form. Upon interaction with H2S, the probe undergoes a thiolysis reaction, releasing the rhodol in its open-ring fluorescent form. This “off-on” mechanism not only ensures high sensitivity and specificity for H2S detection but also provides a distinct fluorescence response that can be easily monitored in biological systems. This innovative design enhances the probe's selectivity, minimizes background interference, and enables real-time tracking of H2S dynamics with excellent photostability.
2. Experimental section
2.1 Materials and instruments
Phthalic anhydride (99.7%), m-hydroxy-N,N-diethylbenzeneamine (95%), catechol (99%), and 2-chloro-1,4-naphthoquinone (98%) along with other analytical reagents were commercially obtained and used as received. NMR data were collected using DMSO-d6 as solvent on a 600 MHz NMR spectrometer, with high-resolution mass spectra (HR-MS) measured at 298 K on a WNMR-I 500 MHz spectrometer. UV-visible absorption spectra were recorded using a UV-2547 spectrophotometer (Shimadzu, Japan), and fluorescence spectra at room temperature were recorded using a Cary Eclipse fluorescence spectrometer (Agilent Technologies, USA), with an excitation wavelength set at 490 nm. The cytotoxic effects of compound TF-1 on cells were determined using the CCK-8 assay.2.2 Synthesis of compound TF-1
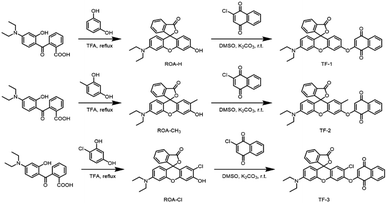
Weigh m-hydroxy-N,N-diethylbenzeneamine (1.65 g, 10 mmol) and phthalic anhydride (1.48 g, 10 mmol), first dissolve the phthalic anhydride in toluene, and react at 80 °C for 30 minutes. After 30 minutes, add m-hydroxy-N,N-dimethylbenzeneamine and heat to 110 °C for a further 8 hours. Monitor the reaction by TLC. Upon completion, remove the solvent by rotary evaporation and recrystallize from n-butanol. Purify the intermediate 2-(4-Diethylamino-2-hydroxybenzoyl)benzoic acid (86.6% yield) via column chromatography. Weigh intermediate 2-(4-diethylamino-2-hydroxybenzoyl)benzoic acid (1.56 g, 5.0 mmol) and catechol (0.55 g, 5.0 mmol), dissolve in 5 mL of trifluoroacetic acid, and reflux at 80 °C for 12 hours. Monitor the reaction by TLC. After completion, remove the solvent by rotary evaporation and recrystallize using ethyl acetate. Purify the compound to obtain intermediate ROA-H (80.1% yield). Weigh the obtained intermediate ROA-H (193.7 mg, 0.5 mmol) and 2-chloro-1,4-naphthoquinone (96.3 mg, 0.5 mmol), dissolve in 8 mL of DMSO under nitrogen protection, and react at room temperature for 12 hours. Monitor the progress of the reaction by TLC. After completion, extract with ethyl acetate and saturated salt water, collect the organic phase, dry over anhydrous sodium sulfate, and reduce the pressure to dry the solvent, obtaining a crude product. Purify the crude product via column chromatography, using a mobile phase system of dichloromethane and methanol (100![[thin space (1/6-em)]](https://www.rsc.org/images/entities/char_2009.gif) :
:![[thin space (1/6-em)]](https://www.rsc.org/images/entities/char_2009.gif) 1). The product is a brown solid, namely the fluorescent probe TF-1, with a yield of 74.3%. Synthesis methods for TF-2 and TF-3 are provided in the ESI† (Scheme 2).
1). The product is a brown solid, namely the fluorescent probe TF-1, with a yield of 74.3%. Synthesis methods for TF-2 and TF-3 are provided in the ESI† (Scheme 2).
1H NMR (600 MHz, DMSO-d6) δ 8.11–8.07 (m, 1H), 8.03 (dt, J = 7.7, 1.0 Hz, 1H), 8.01–7.97 (m, 1H), 7.94–7.87 (m, 2H), 7.83 (td, J = 7.5, 1.2 Hz, 1H), 7.75 (td, J = 7.5, 0.9 Hz, 1H), 7.39 (dt, J = 7.7, 0.9 Hz, 1H), 7.33 (d, J = 2.5 Hz, 1H), 7.02 (dd, J = 8.7, 2.5 Hz, 1H), 6.89 (d, J = 8.7 Hz, 1H), 6.54–6.46 (m, 3H), 6.11 (s, 1H), 3.37 (t, J = 7.1 Hz, 4H), 1.09 (t, J = 7.0 Hz, 6H). 13C NMR (151 MHz, DMSO-d6) δ 184.86, 179.50, 169.11, 159.56, 155.00, 152.72, 152.60, 152.44, 149.80, 136.13, 135.10, 134.44, 131.96, 131.40, 130.67, 130.56, 129.14, 126.70, 126.63, 126.14, 125.15, 124.67, 117.44, 116.47, 115.80, 109.43, 109.07, 104.69, 97.34, 83.24, 44.28, 12.75. ESI-MS m/z calcd for C34H25NO6 [M + H]+ 544.1755, found 544.1768.
2.3 UV-visible and fluorescence spectroscopy measurement
Spectral analysis is performed at room temperature in a buffer solution (PBS/MeCN = 1/4, v/v, pH = 7.4). The concentration of the probe TF-1/2/3 used for UV-VIS and fluorescence spectroscopy measurements is 10 μM. Solutions of cations and anions are prepared in distilled water. Spectral data, including UV absorption spectra and fluorescence emission spectra, are collected by adding chemical reagents using a microliter syringe. After adding aliquots to the mixture, the solution is stirred, excited at 490 nm, and the spectrum at 547 nm was recorded.2.4 Cytotoxicity and fluorescence imaging
Cell viability in different concentrations of the probe (0 μM, 5 μM, 10 μM, 20 μM, 30 μM, and 50 μM) is assessed. A549 cells incubated in 100 μL of culture medium are transferred to each well of a 96-well plate, which is then incubated for 24 h at 37 °C with 5% CO2 and 95% O2. The culture medium is then removed, and probes of 0, 5, 10, 20, 30, and 50 μM concentrations are added and incubated for another 24 h. After washing thrice with PBS, 10 μL of 5 mg mL−1 CCK8 is added to each well and incubated for 4 hours. The medium is removed, 100 μL of DMSO solution is added, the plate is agitated for several minutes, and UV absorption at 450 nm is measured with an enzyme reader to calculate cell viability. For fluorescence imaging, hydrogen sulfide is categorized into exogenous and endogenous production. For exogenous H2S, NaHS aqueous solution is added, and for endogenous H2S, cysteine is used, which is known to be converted into H2S in living cells by cystathionine β-synthase (CBS) and cystathionine γ-lyase (CSE).3. Results and discussion
3.1 Effect of pH and time on the probe
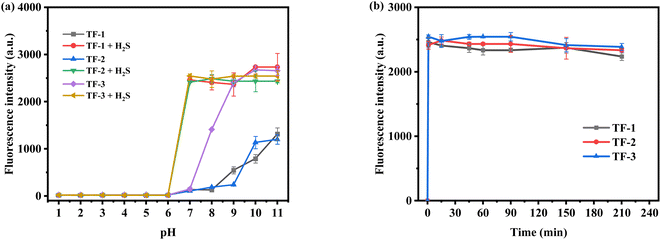
We synthesized three naphthoquinone derivatives based on the rhodol structure to study the effects of electron-donating and electron-withdrawing groups on the probes. Using fluorescence emission spectra, we examined the impact on each probe (10 μM) in the presence and absence (100 μM) of hydrogen sulfide (H2S). The introduction of the naphthoquinone group suppresses the probe's inherent fluorescence. As shown in Fig. 1a, under acidic conditions (pH 1–6), the probes exhibit no fluorescence due to the closed state of rhodol's spirolactone in acidic environments. However, under alkaline conditions (pH 8–11), the spirolactone ring opens, resulting in some fluorescence. TF-1 maintains a low fluorescence intensity at pH 7–11 (Fig. S13†), indicating potential for detecting H2S in the human body. TF-2, influenced by electron-donating groups, exhibits improved alkaline resistance (Fig. S14†). In contrast, TF-3, affected by electron-withdrawing groups, shows a greater pH influence (Fig. S15†); for instance, at pH 8, TF-1 and TF-2 retain low fluorescence intensity, while TF-3 reaches a fluorescence intensity of 1500. Upon adding H2S, all probes demonstrate fluorescence recovery. Each system can detect H2S within 1 minute (Fig. 1b). Overall, the introduction of electron-donating and electron-withdrawing groups affects the probe's structure; electron-donating groups enhance acid–base resistance, while electron-withdrawing groups weaken it. The three probes show minor differences in detection time and fluorescence intensity. TF-1 will be the primary focus of subsequent research.3.2 Optical properties
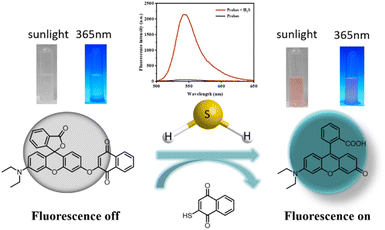
The probe TF-1, featuring rhodol (compound II) as the fluorophore and 2-chloro-1,4-naphthoquinone as the quenching group, masks the hydroxyl groups. The structure of the probe is confirmed by 1H NMR, 13C NMR, and ESI-MS. Initially, the UV absorption and fluorescence emission spectra of the probe TF-1 (10 μM) are measured as shown in Fig. 2, with and without H2S (0.1 mM). UV spectra reveal that, in the absence of H2S, there are no significant absorption peaks, but upon addition of H2S, a strong absorption peak appears at 520 nm (Fig. 2a). For fluorescence emission, under maximum excitation at 490 nm, no fluorescence intensity is detected before H2S addition; however, after H2S addition, a strong fluorescence signal appears at 547 nm (Fig. 2b). This change can be visually observed as the solution changes color from colorless to pink. To determine the response time and detection limit of the probe TF-1 for hydrogen sulfide, as illustrated, the probe (10 μM) responds rapidly to the presence of H2S (0.1 mM) with maximum fluorescence intensity at 547 nm reached within 1 min (Fig. 1b), demonstrating a faster response compared to many reported H2S fluorescence probes.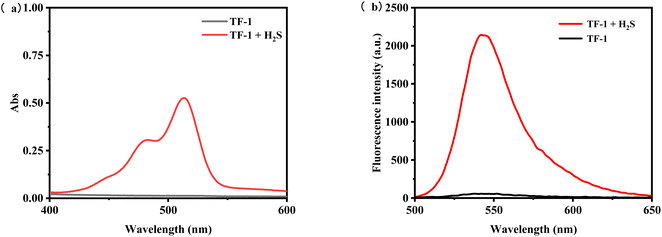 | ||
| Fig. 2 (a) UV absorption spectra of probe TF-1 (10 μM) before and after addition of H2S (50 μM) and (b) fluorescence emission spectra of probe TF-1 (10 μM) before and after addition of H2S (50 μM). | ||
To explore the linear relationship between fluorescence intensity and H2S concentration, various concentrations of H2S (0–60 μM) were added to the probe solution (10 μM in PBS/MeCN = 1/4, v/v, pH = 7.4). The change in fluorescence intensity at 547 nm was recorded (Fig. 3a). The fluorescence intensity changes were fitted using a linear regression equation to establish the corresponding linear relationship and calculate the detection limit (using the formula LOD = 3σ/ρ). As shown in Fig. 3b, within the range of 0–50 μM (0–5.0 equiv.), the fluorescence intensity of the probe TF-1 exhibits a strong linear relationship with the concentration of H2S, with R2 = 0.9930. The calculated LOD is 44.3 nM, which is significantly lower than the concentrations of H2S required to elicit physiological responses (10–600 μM).
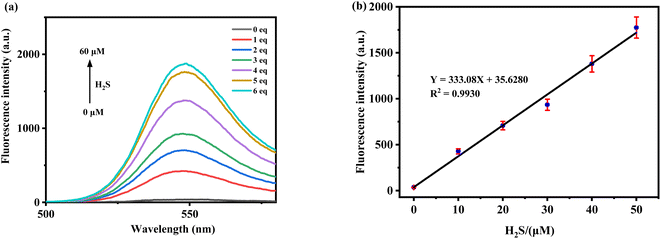 | ||
| Fig. 3 (a) The fluorescence of probe TF-1 (10 μM) changes with the increase of H2S concentration. (b) Linear fluorescence signal of probe TF-1 (10 μM) at different H2S concentrations. | ||
3.3 Mechanism of TF-1 probe's recognition of H2S
To test our hypothesis of creating an H2S-sensitive “off-on” sensor, we studied the reactivity of probe TF-1 in the presence/absence of H2S. Fig. 2 shows the changes in the UV absorption and fluorescence emission spectra of the probe recorded within 5 min after mixing with NaHS. The following changes were observed: (1) an increase in the UV absorption spectra at 520 nm; (2) a new broad band in the fluorescence emission spectra near 547 nm. After the initial 3 min of reaction, the fluorescence intensity increased by dozens of times, sufficient to confirm the presence of hydrogen sulfide or its donor in various biological systems. In the fluorescence spectra after adding NaHS, the maximum fluorescence intensity was at the same wavelength as rhodol. These results suggest that H2S cleaves the ether bonds in probe TF-1 and releases fluorescence (Scheme 1). The naphthalene urea unit effectively quenches the fluorescence emission through the photoinduced electron transfer (PET) effect. After H2S treatment, rhodol hydroxyls start to donate electrons and initiate the ICT process, which induces a strong fluorescence signal.3.4 Selectivity of the probe TF-1 for H2S
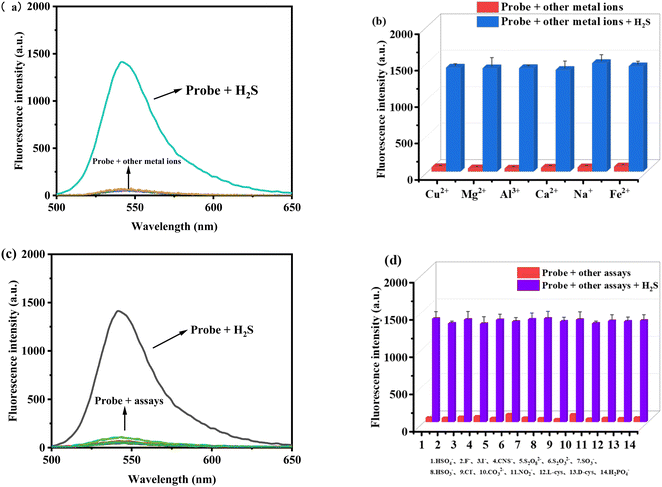
The selectivity and interference resistance of fluorescence probes are crucial performance indicators. In this study, all molecular ions were prepared in ultrapure water. We analyzed the target anion H2S, along with HSO4−, F−, I−, CNS−, S2O82−, S2O32−, SO32−, HSO3−, Cl−, CO32−, NO2−, L-cysteine (L-cys), D-cysteine (D-cys), and H2PO4−, and the cations Cu2+, Mg2+, Al3+, Ca2+, Na+, and Fe2+. As shown in Fig. 4a and b, probe TF-1 efficiently detects H2S in the presence of metal ions without interference. Similarly, as shown in Fig. 4c and d, probe TF-1 maintains high detection efficiency for H2S even in the presence of other anions. In summary, probe TF-1 exhibits high selectivity for H2S and excellent interference resistance, showing no selectivity for other analytes. This indicates that the probe has high specificity, sensitivity, and strong interference resistance, making it suitable for use in complex molecular ion environments.3.5 Mechanistic studies
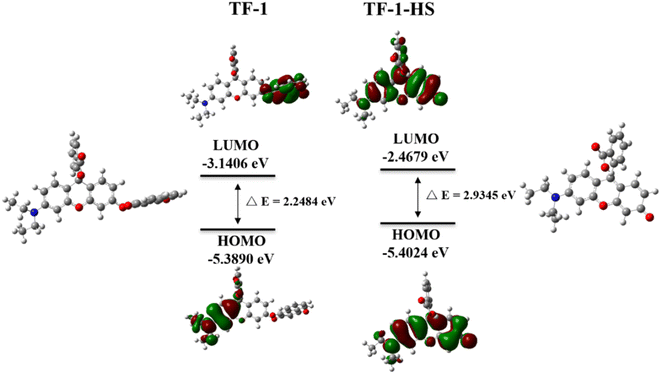
To confirm that the color and fluorescence changes of the probe TF-1 are triggered by H2S, we characterized the substances before and after the reaction of TF-1 with H2S using ESI-MS analysis. As shown in Fig. S10,† peaks at m/z = 388.1548 correspond to the ion peaks of [TF-1-HS]+, respectively, matching the theoretical molecular weights. To further understand the response mechanism of TF-1 to H2S, we conducted 1H NMR titration. Comparing the hydrogen spectra at 0 eq., 3 eq., and 5 eq. of H2S (Fig. S11†), we found that in the presence of 3 eq. of H2S, TF-1 was not completely sulfidized compared to the system at 0 eq. However, in the presence of 5 eq. of H2S, the number of hydrogen atoms in the high-field region corresponds to the fully sulfidized compound, indicating that the reaction of H2S with TF-1 aligns with the fluorescence titration results. In the 1H NMR titration experiment, a comparison between the spectra of unreacted probes and those reacted with 5 equivalents of H2S shows the disappearance or significant weakening of several proton signals. Notably, the 7.3–8.3 ppm range shows a pronounced disappearance of aromatic proton signals, indicating a substantial alteration in the electronic environment in this region during the reaction. Additionally, peaks in the 6.0–7.0 ppm range show significant changes, likely corresponding to protons near the reaction site. The disappearing peaks are primarily associated with aromatic protons and protons near the reactive center. As H2S is introduced, the chemical environment of these protons is disrupted or altered, leading to changes or the loss of NMR signals. Additionally, we used Gaussian 16 software at the B3LYP/6-31G(d) level for density functional theory (DFT) calculations to further substantiate the response mechanism. The HOMO (highest occupied molecular orbital) of TF-1 is primarily concentrated in the phenothiazine part (Fig. 5). In contrast, the LUMO and LUMO of TF-1-HS are mainly distributed in the rhodol structure. The calculated energy gap for TF-1 is 2.2484 eV, while for TF-1-HS it is 2.9345 eV. The energy gap of TF-1-HS is smaller than that of TF-1 because the strong electron-withdrawing group (naphthoquinone part) in TF-1 hinders the ICT process. However, in the presence of H2S, the naphthoquinone part is dissociated, triggering the ICT process in the probe, which results in fluorescence activation. The theoretical calculations align with the experimental results, further validating the proposed response mechanism.3.6 Cell imaging
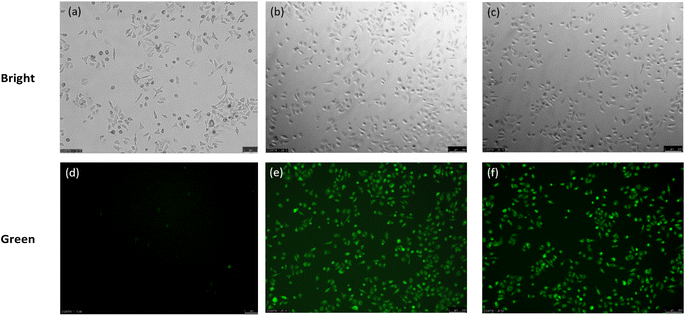
We assessed the ability of the TF-1 probe to detect H2S in live cells. Standard cytotoxicity assays using CCK8 demonstrated that cell viability remained above 80% under exposure to 50 μM of the probe, indicating negligible cytotoxicity. This suggests that the probe can be safely used for cell imaging (Fig. S12†).Subsequently, the probe's application in fluorescence imaging of exogenous H2S in live cells was investigated. Using the probe at 10 μM, only faint fluorescence was observed in A549 cells (Adamas life, China) stained for 30 minutes (Fig. 6a and d). However, upon addition of H2S (100 μM) for 30 minutes, intense green fluorescence was observed in the cells (Fig. 6b and e). Cysteine, capable of being desulfurized by enzymes in live cells to produce H2S (Fig. 6c and e), serves as a viable method for generating endogenous H2S. Therefore, we monitored endogenous H2S in A549 cells under a fluorescence microscope using the TF-1 probe, and the results were consistent with those observed for exogenous H2S. These findings confirm that the TF-1 probe can visualize both exogenous and endogenous H2S in cells.
4. Conclusions
In summary, a new reactive fluorescent probe for detecting H2S, termed probe TF-1, has been developed. This probe is constructed by linking a 2-chloro-1,4-naphthoquinone moiety with a rhodol fluorophore to capture H2S, demonstrating excellent sensing properties towards H2S. These include significant fluorescence enhancement, low detection limit, and high selectivity, as well as low cytotoxicity. Moreover, the successful imaging application of this probe at the cellular level underscores its potential for biological H2S detection in living systems.Data availability
The data underlying this study are available in the published article and its ESI.†Author contributions
Jiefeng Tang: writing – original draft, methodology, data curation. Xiangjun Chen: visualization, software, investigation. Zhenzhen Wang: investigation, formal analysis. Shuntao Zhang: visualization, investigation. Juan Wang: writing – review & editing, supervision, conceptualization. Chunru Cheng: writing – review & editing, supervision, resources.Conflicts of interest
The authors declare that they have no known competing financial interests or personal relationships that could have appeared to influence the work reported in this paper.Acknowledgements
This research was financially supported by the National Natural Science Foundation of China(22377087).References
- A. Aroca, C. Gotor, D. C. Bassham and L. C. Romero, Antioxidants, 2020, 9(7), 621 CrossRef.
- N. Singh, S. Sharma, R. Singh, S. Rajput, N. Chattopadhyay, D. Tewari, K. B. Joshi and S. Verma, Chem. Sci., 2021, 12(48), 16085–16091 RSC.
- A. S. Sokolov, P. V. Nekrasov, M. V. Shaposhnikov and A. A. Moskalev, Ageing Res. Rev., 2021, 67, 101262 CrossRef.
- Y. S. Kafuti, S. Zeng, X. S. Liu, J. J. Han, M. Qian, Q. X. Chen, J. Y. Wang, X. J. Peng, J. Yoon and H. D. Li, Chem. Commun., 2023, 59(17), 2493–2496 RSC.
- T. Y. Wang, X. Huang, S. Yang, S. Hu, X. L. Zheng, G. J. Mao, Y. Li and Y. B. Zhou, Anal. Chim. Acta, 2023, 1265, 341–356 Search PubMed.
- C. Szabó, Nat. Rev. Drug Discovery, 2007, 6(11), 917–935 CrossRef PubMed.
- L. Y. Wu, W. Yang, X. M. Jia, G. D. Yang, D. Duridanova, K. Cao and R. Wang, Lab. Invest., 2009, 89(1), 59–67 CrossRef PubMed.
- Y. R. Zhang, Q. R. Wang, P. Su, F. Zhao, J. Huang and B. X. Zhao, RSC Adv., 2015, 5(27), 20634–20638 RSC.
- H. Yamasaki and M. F. Cohen, Nitric Oxide, 2016, 55, 91–100 CrossRef PubMed.
- G. Oláh, K. Módis, G. Törö, M. R. Hellmich, B. Szczesny and C. Szabo, Biochem. Pharmacol., 2018, 149, 186–204 CrossRef PubMed.
- H. Ibrahim, A. Serag and M. A. Farag, J. Adv. Res., 2021, 27, 137–153 CrossRef PubMed.
- J. Bae, M. G. Choi, J. Choi and S. K. Chang, Dyes Pigm., 2013, 99(3), 748–752 CrossRef.
- N. S. Lawrence, J. Davis, L. Jiang, T. G. J. Jones, S. N. Davies and R. G. Compton, Electroanalysis, 2000, 12(18), 1453–1460 CrossRef.
- J. E. Doeller, T. S. Isbell, G. Benavides, J. Koenitzer, H. Patel, R. P. Patel, J. R. Lancaster, V. M. Darley-Usmar and D. W. Kraus, Anal. Biochem., 2005, 341(1), 40–51 CrossRef PubMed.
- M. Ishigami, K. Hiraki, K. Umemura, Y. Ogasawara, K. Ishii and H. Kimura, Antioxid. Redox Signaling, 2009, 11(2), 205–214 CrossRef.
- H. Kobayashi, M. Ogawa, R. Alford, P. L. Choyke and Y. Urano, Chem. Rev., 2010, 110(5), 2620–2640 CrossRef PubMed.
- G. Shilang, H. Yanyan, H. Fang, J. Yulong, Z. Guanxin, Y. Liushui, Z. Deqing and Z. Rui, Anal. Chem., 2015, 87(3), 1470–1474 CrossRef.
- C. Xu, H. D. Li and B. Z. Yin, Biosens. Bioelectron., 2015, 72, 275–281 CrossRef PubMed.
- N. Zhao, Q. Gong, R. X. Zhang, J. Yang, Z. Y. Huang, N. Li and B. Z. Tang, J. Mater. Chem. C, 2015, 3(32), 8397–8402 RSC.
- L. Q. Yan, Z. N. Kong, W. Shen, W. Q. Du, Y. Zhou and Z. J. Qi, RSC Adv., 2016, 6(7), 5636–5640 RSC.
- G. Y. Jiang, G. J. Zeng, W. P. Zhu, Y. D. Li, X. B. Dong, G. X. Zhang, X. L. Fan, J. G. Wang, Y. Q. Wu and B. Z. Tang, Chem. Commun., 2017, 53(32), 4505–4508 RSC.
- L. Yan, X. Gu, Z. Wang and Z. Qi, ChemistrySelect, 2018, 3(12), 3406–3410 CrossRef.
- L. Yan, X. Li and J. Li, ChemistrySelect, 2018, 3, 10157–10163 CrossRef.
- L. Q. Yan, D. Nan, C. Lin, Y. Wan, Q. Pan and Z. J. Qi, Spectrochim. Acta, Part A, 2018, 202, 284–289 CrossRef.
- Z. Zhen, D. Chengquan and S. Huanhuan, Inorg. Chem. Commun., 2018, 95, 56–60 CrossRef.
- A. R. Lippert, J. Inorg. Biochem., 2014, 133, 136–142 CrossRef PubMed.
Footnote |
| † Electronic supplementary information (ESI) available. See DOI: https://doi.org/10.1039/d4ay01643b |
| This journal is © The Royal Society of Chemistry 2025 |

