Theoretical investigations of transition metal atom-doped MoSi2N4 monolayers as catalysts for electrochemical CO2 reduction reactions†
Received
7th September 2024
, Accepted 19th November 2024
First published on 27th November 2024
Abstract
Following the principle of single-atom catalysts (SACs), the fourth-period transition metals (TM) were designed as active sites on a MoSi2N4 monolayer surface with N vacancy, and the catalytic mechanisms of these single-atom active sites for the conversion of CO2 to CO were investigated by first-principles calculations. Our results showed that the doped TM atoms on the MoSi2N4 surface significantly enhanced the CO2 reduction reaction (CO2RR) activity compared with the pristine MoSi2N4 monolayer. Our findings after analyzing all the doped structures in our work were as follows: (1) the Sc-, Ti-, and Mn-doped structures exhibited very low limiting potentials; (2) out of Sc-, Ti- and Mn-doped structures, the Mn@MoSi2N4-Nv structure showed the best catalytic performance with a limiting potential of only –0.16 V, exhibiting an advantage over the hydrogen evolution reaction, which is a competitive reaction of CO2RR. However, the positive binding free energy at 298.15 K of the intermediate reactant *COOH on the Mn@MoSi2N4-Nv surface indicated its unstable state, which hinders the CO generation process. This is contrary to the results derived from the adsorption/binding energy at 0 K, which indicated that the effect of temperature cannot be ignored when considering adsorption/binding energy. Our work provides insights into the effects of temperature on the catalytic mechanisms for CO2RR through TM-doped MoSi2N4 monolayers.
1. Introduction
The increasing carbon dioxide (CO2) emissions have led to various environmental problems. Thus, there is an urgent need to decrease CO2 emissions and develop techniques for CO2 capture and utilization. The electrochemical carbon dioxide reduction reaction (CO2RR) is one of the promising solutions that can convert CO2 into valuable chemical fuels through multiple protonation steps.1–3 However, there are several challenges to overcome as follows: first, the large C![[double bond, length as m-dash]](https://www.rsc.org/images/entities/char_e001.gif) O bond energy in CO2 molecules indicates that breaking this bond requires a significant amount of energy, which results in a slow reaction rate and Faraday inefficiency of CO2RR;4–6 second, CO2RR can result in multiple reaction products, which makes the reaction path very complex and yields various final products; third, the presence of side reactions, such as hydrogen evolution reaction (HER), further results in low product selectivity.7–10 So, developing high-performance catalysts for electrochemical CO2RR is crucial, which explains the volume of work on this topic. For example, noble metals, such as Au and Ag, have been designed as effective catalysts for selectively reducing CO2 to CO, but their high cost limits their wide applications.11,12 Therefore, developing noble metal-free (low-cost), efficient, and stable electrocatalysts for CO2RR is one of the current research focus. New strategies, such as single-atom catalysts (SACs), have also been adopted to design new catalysts. The SACs exhibit excellent properties, including high atomic utilization efficiency, product selectivity, and uniform distribution of catalytic active sites.13–17 The activity of SACs is closely related to the coordination environment of the central atom.18–20 In 2011, Zhang et al.21 demonstrated the excellent catalytic performance of Pt1/FeOx single-atom catalysts for CO production. Two-dimensional (2D) materials have been considered promising SAC substrates, which can load highly active transition metal atoms (TMs).22 The unique physical, chemical, and electronic properties make them suitable for the development of novel CO2RR catalysts that can replace noble metal catalysts.23–26 The recently synthesized MSi2N4 (M = Mo, W),27 which have been confirmed as novel 2D semiconductor materials without knowing their 3D parents, provide us new candidates for catalyst designs. Different modifications have been adopted to tune the active sites on the surface of 2D MSi2N4 for high electrochemical catalytic performance.28–35 In the line of intrinsic defect engineering, Luo et al.30 found that the pre-formed N vacancies on the MSi2N4 surface can expose the active Si atoms on the surface, thus enhancing the N2 adsorption capacity, which can effectively promote the nitrogen reduction reaction (NRR). TiSi2N4 and TaSi2N4 were identified as high-potential and promising NRR catalysts, with calculated limiting potentials of only 0.41 and 0.46 V. Extraneous TM atom doping is another important method to design catalysts. For example, the TM atoms doped on the surface of MoSi2N4 show excellent activity in CO2RR.31 In the case of the Co atom-doped MoSi2N4, HCOOH is the preferred product for CO2 reduction with a rate-determining step (RDS) height of 0.89 eV; on the other hand, the surface modification using Sc, Ti, Fe, and Ni atoms inclined the catalysts towards reducing CO2 to CH4, with an RDS barrier of 0.81–1.24 eV. The Cu–MoSi2N4 catalyst, where a Cu atom substitutes one surface Si atom, shows excellent reaction performance for C2 products.32 The products of the Cu–MoSi2N4 catalytic reaction are valuable C2+ chemicals, which were further identified as CH4, C2H4, C2H6, C2H5OH, and C3H7OH. Similar TM-doped catalysts were screened theoretically to realize efficient nitric oxide electroreduction reaction (NOER), and Zr- and Pt-doped MSi2N4 monolayers exhibited the best catalytic activities and selectivity for generating NH3 at limiting potentials of 0 V and 0.10 V.33 Special TM–N4 structures were constructed by embedding a series of TM atoms into defective MoSi2N4 monolayers, which demonstrates the oxygen evolution reaction (OER) and oxygen reduction reaction (ORR) activities.34 Through high-throughput computational screening of 3d, 4d, and 5d TMs doped into the M-, Si-, and N-sites of MSi2N4 monolayers, Zang et al.35 discovered that the doping of V, Fe, Nb, Tc, and Ta atoms to MSi2N4 significantly enhances its HER activities. Finally, 10 out of 124 candidates have been successfully identified as excellent HER catalysts. The outstanding performance of defective or doped MoSi2N4 as electrocatalysts in various important reactions raises another interesting question: are there design strategies based on doped MSi2N4 monolayers to explore good catalysts for the conversion of CO2 into CO with high efficiency and high selectivity? There have been only very few studies about this so far. In previous work, single TM-anchored MoSi2N4 monolayers with no defects on the surface were explored as CO2RR catalysts.31 Then, in the Cu–MoSi2N4 catalyst, Si vacancy was introduced, so the TM atoms were coordinated with N atoms on the surface.32 In the present work, we will explore the synergistic effect of N vacancy and TM atoms, where the TM atoms are coordinated with Si atoms on the surface. We take SACs as a novel design strategy and theoretically screen 10 TM (Sc–Zn)-doped MoSi2N4 monolayers as electrocatalysts for CO2RR. The TM atoms work as active sites and break the CO bond. Based on the complexity of the product selectivity and reaction paths, CO is selected as the target product because CO has a very high industrial value as a feedstock for various chemical products and industrial reactions.36–38 Catalyzing CO2 to CO is considered a more economically viable pathway due to its high selectivity and relatively low energy consumption among multiple product conversions.16,18,19 Currently, the available CO electrocatalysts suffer from issues of high overpotentials, low current efficiency, low product selectivity, slow reaction rates (compared to HER), poor stability, and high application costs.39,40 This puts forward higher requirements of selectivity for the designed catalysts. Another issue related to the catalytic reaction rate is the presence of side reactions, such as hydrogen evolution reaction (HER), so the competition between CO2RR and HER also will be discussed. In all, we conduct a theoretical investigation into the CO2RR performance of 10 TM (Sc–Zn)-doped MoSi2N4 monolayers (denoted by TM@MoSi2N4-Nv) during CO generation using the density functional theory (DFT) method. We hope our work will be helpful in finding CO2RR electrocatalysts of high performance based on our obtained insights into the catalytic process of TM@MoSi2N4-Nv catalysts and the related catalytic mechanism.
O bond energy in CO2 molecules indicates that breaking this bond requires a significant amount of energy, which results in a slow reaction rate and Faraday inefficiency of CO2RR;4–6 second, CO2RR can result in multiple reaction products, which makes the reaction path very complex and yields various final products; third, the presence of side reactions, such as hydrogen evolution reaction (HER), further results in low product selectivity.7–10 So, developing high-performance catalysts for electrochemical CO2RR is crucial, which explains the volume of work on this topic. For example, noble metals, such as Au and Ag, have been designed as effective catalysts for selectively reducing CO2 to CO, but their high cost limits their wide applications.11,12 Therefore, developing noble metal-free (low-cost), efficient, and stable electrocatalysts for CO2RR is one of the current research focus. New strategies, such as single-atom catalysts (SACs), have also been adopted to design new catalysts. The SACs exhibit excellent properties, including high atomic utilization efficiency, product selectivity, and uniform distribution of catalytic active sites.13–17 The activity of SACs is closely related to the coordination environment of the central atom.18–20 In 2011, Zhang et al.21 demonstrated the excellent catalytic performance of Pt1/FeOx single-atom catalysts for CO production. Two-dimensional (2D) materials have been considered promising SAC substrates, which can load highly active transition metal atoms (TMs).22 The unique physical, chemical, and electronic properties make them suitable for the development of novel CO2RR catalysts that can replace noble metal catalysts.23–26 The recently synthesized MSi2N4 (M = Mo, W),27 which have been confirmed as novel 2D semiconductor materials without knowing their 3D parents, provide us new candidates for catalyst designs. Different modifications have been adopted to tune the active sites on the surface of 2D MSi2N4 for high electrochemical catalytic performance.28–35 In the line of intrinsic defect engineering, Luo et al.30 found that the pre-formed N vacancies on the MSi2N4 surface can expose the active Si atoms on the surface, thus enhancing the N2 adsorption capacity, which can effectively promote the nitrogen reduction reaction (NRR). TiSi2N4 and TaSi2N4 were identified as high-potential and promising NRR catalysts, with calculated limiting potentials of only 0.41 and 0.46 V. Extraneous TM atom doping is another important method to design catalysts. For example, the TM atoms doped on the surface of MoSi2N4 show excellent activity in CO2RR.31 In the case of the Co atom-doped MoSi2N4, HCOOH is the preferred product for CO2 reduction with a rate-determining step (RDS) height of 0.89 eV; on the other hand, the surface modification using Sc, Ti, Fe, and Ni atoms inclined the catalysts towards reducing CO2 to CH4, with an RDS barrier of 0.81–1.24 eV. The Cu–MoSi2N4 catalyst, where a Cu atom substitutes one surface Si atom, shows excellent reaction performance for C2 products.32 The products of the Cu–MoSi2N4 catalytic reaction are valuable C2+ chemicals, which were further identified as CH4, C2H4, C2H6, C2H5OH, and C3H7OH. Similar TM-doped catalysts were screened theoretically to realize efficient nitric oxide electroreduction reaction (NOER), and Zr- and Pt-doped MSi2N4 monolayers exhibited the best catalytic activities and selectivity for generating NH3 at limiting potentials of 0 V and 0.10 V.33 Special TM–N4 structures were constructed by embedding a series of TM atoms into defective MoSi2N4 monolayers, which demonstrates the oxygen evolution reaction (OER) and oxygen reduction reaction (ORR) activities.34 Through high-throughput computational screening of 3d, 4d, and 5d TMs doped into the M-, Si-, and N-sites of MSi2N4 monolayers, Zang et al.35 discovered that the doping of V, Fe, Nb, Tc, and Ta atoms to MSi2N4 significantly enhances its HER activities. Finally, 10 out of 124 candidates have been successfully identified as excellent HER catalysts. The outstanding performance of defective or doped MoSi2N4 as electrocatalysts in various important reactions raises another interesting question: are there design strategies based on doped MSi2N4 monolayers to explore good catalysts for the conversion of CO2 into CO with high efficiency and high selectivity? There have been only very few studies about this so far. In previous work, single TM-anchored MoSi2N4 monolayers with no defects on the surface were explored as CO2RR catalysts.31 Then, in the Cu–MoSi2N4 catalyst, Si vacancy was introduced, so the TM atoms were coordinated with N atoms on the surface.32 In the present work, we will explore the synergistic effect of N vacancy and TM atoms, where the TM atoms are coordinated with Si atoms on the surface. We take SACs as a novel design strategy and theoretically screen 10 TM (Sc–Zn)-doped MoSi2N4 monolayers as electrocatalysts for CO2RR. The TM atoms work as active sites and break the CO bond. Based on the complexity of the product selectivity and reaction paths, CO is selected as the target product because CO has a very high industrial value as a feedstock for various chemical products and industrial reactions.36–38 Catalyzing CO2 to CO is considered a more economically viable pathway due to its high selectivity and relatively low energy consumption among multiple product conversions.16,18,19 Currently, the available CO electrocatalysts suffer from issues of high overpotentials, low current efficiency, low product selectivity, slow reaction rates (compared to HER), poor stability, and high application costs.39,40 This puts forward higher requirements of selectivity for the designed catalysts. Another issue related to the catalytic reaction rate is the presence of side reactions, such as hydrogen evolution reaction (HER), so the competition between CO2RR and HER also will be discussed. In all, we conduct a theoretical investigation into the CO2RR performance of 10 TM (Sc–Zn)-doped MoSi2N4 monolayers (denoted by TM@MoSi2N4-Nv) during CO generation using the density functional theory (DFT) method. We hope our work will be helpful in finding CO2RR electrocatalysts of high performance based on our obtained insights into the catalytic process of TM@MoSi2N4-Nv catalysts and the related catalytic mechanism.
2. Computational methods
All spin polarization calculations were performed using the DS-PAW software.41 The Perdew–Burke–Ernzerhof (PBE) functional based on the generalized gradient approximation (GGA) and PAW pseudopotential were used to deal with the exchange–correlation interaction for the ion-electron interaction.42,43 The initial spin configurations were taken as the ferromagnetic state. The Grimme's semiempirical scheme (DFT-D3) was incorporated to address the van der Waals (vdW) interactions.44 The k-mesh was set to be 3 × 3 × 1 for structural optimization and 5 × 5 × 1 for accurate electronic density of state (DOS) calculations. In all the calculations, the thickness of the vacuum layer was set to be 30 Å along the z direction to eliminate the interaction between adjacent periodic supercells. The energy convergence criteria were set to 10−5 eV for geometry optimization and 10−6 eV for electronic DOS calculations and the criteria of force convergence was set to 0.02 eV Å−1. The cut-off energy was set to 500 eV. The local three-dimensional electron correlation of the fourth-period TMs can be described by considering the on-site Coulomb repulsion (U) and exchange interactions (J) in the DFT+U method.45 The optimized U–J values for different transition atoms are listed in Table S1 in the ESI.†
On the surface of a 3 × 3 × 1 supercell of a 2D MoSi2N4 monolayer, one N atom is substituted by a TM atom (TM@MoSi2N4-Nv). The binding energy (Ebind) of the TM atom on the MoSi2N4-Nv monolayer indicates the thermal stability of TM@MoSi2N4-Nv monolayers and is calculated by the following formula:
| | | Ebind = E(TM@MoSi2N4-Nv) − E(MoSi2N4-Nv) − E(TM) | (1) |
E(TM@MoSi
2N
4-N
v),
E(MoSi
2N
4-N
v), and
E(TM) represent the DFT total energies of TM@MoSi
2N
4-N
v, MoSi
2N
4 monolayer with N-vacancy, and an isolated TM atom, respectively. The
Ef was calculated to evaluate the difficulty of doping TM in the MoSi
2N
4 monolayer and is defined as:
| | | Ef = E(TM@MoSi2N4-Nv) − E(MoSi2N4-Nv) − μ(TM) | (2) |
μ(TM) is calculated as
Etot/
N, where
Etot and
N are the DFT total energies of the TM atom in the bulk phase and the number of atoms in it, respectively. Similar to
Ebind, the CO
2 adsorption energy (
Eads) was calculated by:
| | | Eads = E(CO2_TM@MoSi2N4-Nv) − E(TM@MoSi2N4-Nv) − E(CO2) | (3) |
E(CO
2_TM@MoSi
2N
4-N
v),
E(TM@MoSi
2N
4-N
v), and
E(CO
2) represent the DFT total energies of CO
2 adsorbed by the TM@MoSi
2N
4-N
v monolayer, TM@MoSi
2N
4-N
v substrate, and CO
2 molecule, respectively. The binding energy (
Eb) for all intermediates on the TM@MoSi
2N
4-N
v surface was calculated by:
36| |  | (4) |
| |  | (5) |
E(*COOH) and
E(*CO) are the DFT total energies of TM@MoSi
2N
4-N
v adsorbed with the *COOH intermediate and *CO intermediate, and
E(*) is the energy of the clean TM@MoSi
2N
4-N
v surface.
E(CO
2),
E(H
2O) and
E(H
2) are the DFT total energies of the gas-phase CO
2, H
2O, and H
2, respectively.
The computational hydrogen electrode (CHE) model was employed to determine the reaction energy as a function of the potential with a proton–electron pair in the reactant.46–48 Thus, the chemical potential of the proton-electron pair (H+ + e−) in an aqueous solution is equal to that of half of an isolated H2 molecule. According to the CHE model, the Gibbs free energy change (ΔG) for all the electrochemical steps is calculated by:
| | | ΔG = ΔE = ΔZPE − TΔS + ΔGU + ΔGpH | (6) |
Δ
E refers to the reaction energy change of each hydrogenation step calculated by DFT. ΔZPE and Δ
S are the changes in zero-point energy and entropy, respectively. ΔZPE can be calculated by summing the vibrational frequencies (ΔZPE = 1/2Σ
hv), the details of which are given in Section 1 in the ESI.
† In the phonon frequency calculation, the finite displacement method is used with a set of supercells containing small displacements. The first principle code, DS-PAW, is used to calculate the total energies of these supercells. Then, the force constant and dynamical matrix can be derived from the displacement–total energy results, and the phonon modes and frequencies will be the eigenvectors and eigenvalues of the dynamical matrix in the harmonic approximation. The theory and calculation details and examples of input files for DS-PAW in phonon frequency calculations are given in Section 2 in the ESI.
† The results of ZPE and TS corrections for *COOH and *CO are listed in Tables S2 and S3 (ESI
†), respectively. When performing vibrational frequency calculations for adsorption intermediates, only the adsorbate in the catalyst was allowed to move while the other atoms were fixed. For free molecules, the vibrational frequencies were calculated directly without fixing the atoms. The temperature
T is set to 298.15 K.
n is the number of transferred electrons, and
U is the electrode potential relative to the reversible hydrogen electrode (RHE). Δ
GpH is the free energy correction of pH, which can be expressed as:
| | ΔGpH = kBT × ln![[thin space (1/6-em)]](https://www.rsc.org/images/entities/char_2009.gif) 10 × pH 10 × pH | (8) |
Here,
kB is the Boltzmann constant, and the pH is set to zero for simplicity in this work. If the electrolyte pH is known, the RHE can be related to the standard hydrogen electrode (SHE) scale by the Nernst equation:
USHE =
URHE + 0.059·pH. The best absolute value for the standard hydrogen electrode in water is 4.28 V. If the absolute value of SHE (4.28 V) is included explicitly, all calculated Gibbs free energies will have a constant shift. The catalytic activity for the CO
2RR can be described by the limiting potential (
UL), which is defined as:
Δ
Gmax is the Δ
G of the elementary step with the maximum Δ
G.
The above computational methods are widely adopted to explore the underlying catalytic mechanisms, which have been successfully applied in different kinds of catalytic reactions. It provides us insights into the possible reaction paths at the microscopic level, where the Gibbs free energy change for all electrochemical steps are compared. However, there are still some drawbacks in binding energy calculations of molecular adsorbates. The binding energy calculated by eqn (4) and (5) and the CO2 adsorption energy calculated by eqn (3) are derived from the DFT total energies, and all of these energies are the values corresponding to the ground states at 0 K. These physical quantities cannot describe the chemical reactions taking place at room temperature (298.15 K) because the effects of room temperature were excluded in DFT calculations. To take into account the temperature effects, the DFT total energy E should be replaced by the Gibbs free energy G, where the zero-point energy and temperature-related entropy corrections are included. Now, we can get different insights from the binding energy at 0 K and binding free energy at 298.15 K. For example, the CO2 adsorption free energy (Gads) is calculated by:
| | | Gads = G(CO2_TM@MoSi2N4-Nv) − G(TM@MoSi2N4-Nv) − G(CO2) | (10) |
G(CO
2_TM@MoSi
2N
4-N
v),
G(TM@MoSi
2N
4-N
v), and
G(CO
2) represent the Gibbs free energies for CO
2 absorption by the TM@MoSi
2N
4-N
v monolayer, TM@MoSi
2N
4-N
v substrate, and CO
2 molecule, respectively. The Gibbs free energies were calculated using
eqn (6).
3. Results and discussions
3.1 Structure and stability of TM@MoSi2N4-Nv monolayers
As shown in Fig. 1(a) and (b), 10 TM atoms (Sc–Zn) are considered to substitute the N atoms on the surface of the pristine MoSi2N4 monolayer. The percentage of TM doping can be calculated by NTM/Ntot × 100%, where NTM and Ntot are the number of doped atoms and the total number of atoms in the doped substrate, respectively. The 3 × 3 × 1 MoSi2N4 supercell comprises a total of 63 atoms. As a TM atom replaces an N atom, the total number of atoms remains unchanged. Therefore, the percentage of TM doping should be 1/63, approximately 1.6%. Due to the larger radius of the TM atoms compared to that of the N atoms, the anchoring space generated by the N vacancy is insufficient to accommodate the TM atoms. Consequently, the TM atoms are extruded from the pristine N layer, forming a cone-shaped structure. As a result, the bond lengths of all three TM–Si bonds in the TM@MoSi2N4-Nv (TM = Sc–Zn) monolayers exceed those of the N–Si bonds in the pristine MoSi2N4 monolayer (1.74 Å). In comparison to other monolayers, the Zn atoms in the Zn@MoSi2N4-Nv monolayer are far away from the surface of the MoSi2N4-Nv monolayer. Out of the ten TM atoms, only the bond lengths of the Zn–Si bonds are significantly larger than those of the TM–Si bonds in the other monolayers. As shown in Table S4 in ESI,† the Zn–Si bond length is about 3.2 Å, which is longer than that of the Zn–Si bond in silicene/(0001) ZnS interfaces. This is also similar to the result obtained when Zn atoms are directly adsorbed onto the pristine MoSi2N4 monolayer.49 The optimized stable configurations and structural parameters of all TM@MoSi2N4-Nv monolayers are shown in Fig. S1 and Table S4 in the ESI,† respectively.
 |
| | Fig. 1 (a) Top and (b) side views of a 2D TM@MoSi2N4-Nv monolayer. The selected location of the doped TM atoms and the selected TM atoms are labeled. Calculated (c) binding energy (Eb) and (d) formation energy (Ef) of the TM@MoSi2N4-Nv monolayers. (e) d-band centers of TM atoms (TM = Sc–Zn). | |
The thermal stability of TM@MoSi2N4-Nv (TM = Sc–Zn) monolayers is a crucial parameter for evaluating the catalyst performance. As shown in Fig. 1(c), the binding energies range from −4.42 eV to −0.44 eV. The Ni@MoSi2N4-Nv monolayer has the highest binding energy of −4.42 eV, while the Zn@MoSi2N4-Nv monolayer has the lowest binding energy of −0.44 eV. In general, catalysts with larger negative binding energies exhibit better thermal stability. Comparing the binding energy of the optimized structures, the Zn@MoSi2N4-Nv monolayer is unstable. As a result, it will not be taken into account in the subsequent CO2RR performance analysis. Fig. 1(d) shows that only the Mn@MoSi2N4-Nv monolayer has a negative formation energy of −0.38 eV. However, a positive formation energy does not necessarily rule out the possibility of its experimental synthesis. For example, Co–MoS2 has a calculated formation energy of 1.80 eV, but it can be synthesized under mild hydrothermal conditions.50 The formation energies of the TM@MoSi2N4-Nv (TM = Sc–Cu) monolayers are all lower than this value, indicating that they can be synthesized without harsh experimental conditions. Secondly, the orbital overlaps in the partial density of states (PDOS) can further confirm the difference in binding energy for these 10 TM atoms on the surface of MoSi2N4-Nv monolayers. The 3d orbital of TM atoms and the 2p orbital of Si atoms overlap near the Fermi level in all monolayers except for the Zn@MoSi2N4-Nv monolayer. The transfer of part 3d orbital electrons from the TM atoms to the pristine MoSi2N4 surface during doping results in the formation of stable TM–Si bonds. At the same time, the resulting TM-3d empty orbitals provide channels for electron acceptors and donors in the catalytic process. The more the atomic orbitals overlap, the stronger the orbital hybridization. The stronger orbital hybridization will induce more negative binding energy and more stable structures. The Ti, V, Cr, Mn, Fe, Ni and Cu-doped systems possess magnetic ground states, indicated by the asymmetric spin-up and spin-down states in PDOS calculations. Also, the magnetic moments for single TM atoms and total magnetic moments for TM @ MoSi2N4-Nv are given in Table S9 in the ESI.† The unbalanced magnetic moment induced by the N vacancy in MoSi2N4-Nv will interact with the magnetic moment caused by unpaired electrons in TM atoms. The PDOS of TM-3d and Si-2p for TM@MoSi2N4-Nv (TM = Sc–Zn) monolayers are given in Fig. S2 in the ESI.† Thirdly, the chemical bond length of the Si–TM bond will be another criterion. As given in Table S4 in the ESI,† the TM–Si bond lengths in their compounds are bigger or close to the values calculated in our present work. This means that the chemical bonds have been created between TM atoms and Si atoms nearby, which is helpful for stability.
3.2 Initial adsorption of CO2 molecule
The adsorption capacity of TM atoms can be described by the d-band center. Based on the classic d-band center theory,51 a d-band center value closer to the Fermi level corresponds to a stronger adsorption capacity. Fig. 1(e) shows the d-band center values of TM atoms in the TM@MoSi2N4-Nv (TM = Sc–Zu) monolayers. The d-band center values of the Sc, Ti, Mn, Fe@MoSi2N4-Nv monolayers are closer to the Fermi energy level (blue dashed box). Therefore, we predict that their adsorption capacity will be strong. The first and most critical step in CO2RR is the initial adsorption of CO2 molecules, and the adsorption configuration of CO2 can significantly influence the subsequent reduction processes. The present study considers two adsorption configurations: vertical adsorption of CO2 (denoted by *CO2_1) and horizontal adsorption of CO2 (denoted by *CO2_2). The optimized configurations for *CO2_1 and *CO2_2 are shown in Fig. S3 and S4 in the ESI,† respectively. The results indicate that, except for the Mn@MoSi2N4-Nv monolayer, CO2 maintained a linear shape in the optimized *CO2_1 adsorption configuration for all monolayers. However, in the *CO2_2 adsorption configurations of TM@MoSi2N4-Nv (TM = Sc–Cu) monolayers, the configurations of CO2 changed significantly, and the originally linear CO2 became V-shaped (∠O–C–O < 180°). This suggests that the CO2 molecules were activated. Table S5 in the ESI† presents the structural parameters of the *CO2_2 configuration of the TM@MoSi2N4-Nv (TM = Sc–Cu) monolayers.
In the case of the pristine MoSi2N4 monolayer, the CO2 molecules in two optimized CO2 adsorption configurations always exhibit a linear structure. This suggests that activating CO2 on its surface is a challenging process. The *CO2_1 and *CO2_2 optimized configurations of TM@MoSi2N4-Nv (TM = Sc–Cu) monolayers and pristine MoSi2N4 monolayer are given as Fig. S3 and S4 in ESI,† respectively. Firstly, the surface substitution defect, TM on N vacancy, enhances the adsorption of CO2 on the surface. Table 1 compares the CO2 adsorption energies/adsorption free energies of the *CO2_1 and *CO2_2 configurations, further illustrating the enhanced CO2 adsorption capability achieved through surface doping with TM atoms. The CO2 adsorption energies of the TM@MoSi2N4-Nv (TM = Sc–Cu) monolayers (−1.32 to −0.16 eV) are all lower than those of the pristine MoSi2N4 monolayer (0.13 to 0.20 eV). In view of the adsorption free energy, the same trend is observed, which indicates that TM doping enhances the adsorption of molecular CO2. Secondly, the two configurations, *CO2_1 and *CO2_2, show different adsorption abilities for CO2.
Table 1 Adsorption energies (Eads/eV) at 0 K and adsorption free energies (Gads/eV) at 298.15 K of *CO2_1 and *CO2_2 on TM@MoSi2N4-Nv (TM = Sc–Cu) monolayers and pristine MoSi2N4 monolayer
| Transition metals |
*CO2_1 |
*CO2_2 |
|
E
ads (0 K) |
G
ads (298.15 K) |
E
ads (0 K) |
G
ads (298.15 K) |
| MoSi2N4 |
0.13 |
0.55 |
0.20 |
0.64 |
| Sc |
−0.18 |
0.27 |
−1.32 |
−0.81 |
| Ti |
−0.21 |
0.12 |
−0.78 |
−0.32 |
| V |
−0.47 |
−0.02 |
−0.76 |
−0.25 |
| Cr |
−0.22 |
0.32 |
−0.28 |
0.16 |
| Mn |
−0.47 |
−0.05 |
−0.46 |
0.02 |
| Fe |
−0.27 |
0.14 |
−0.71 |
−0.20 |
| Co |
−0.23 |
0.21 |
−0.31 |
0.15 |
| Ni |
−0.18 |
0.02 |
−0.45 |
0.00 |
| Cu |
−0.16 |
0.37 |
−0.45 |
0.08 |
In the *CO2_1 optimized configuration, when the CO2 molecule is adsorbed on the surface, one terminal O atom of CO2 binds with the TM atom on the catalytic surface. In the *CO2_2 optimized configurations, both the O and C atoms can bind with the TM atom on the catalytic surface. The *CO2_2 optimized configurations should be more stable than *CO2_1 optimized configurations because there are two possible chemical bonds (O–TM and C–TM) between CO2 and TM atom in the *CO2_2 optimized configurations. Our calculations demonstrated in Table 1 confirm this surmise. Thirdly, the configuration of the molecular CO2 depends on the TM atoms. Except for the Mn atom, the *CO2_2 configuration has lower adsorption energy (−1.32 to −0.31 eV) than those of the *CO2_1 configurations (−0.47 to −0.16 eV) for TM doping. The adsorption energy in the case of the Mn atom is almost the same for the *CO2_1 configuration and the *CO2_2 configurations. This is the first reason why the *CO2_2 configurations will be used in the subsequent CO2RR process.
Considering the temperature effects into account, values of the adsorption free energies at 298.15 K for the TM doping are positive. Usually, it is assumed that a positive adsorption free energy indicates unstable adsorption; only V and Mn atoms have negative adsorption free energies for the *CO2_1 configuration, and only Sc, Ti, V and Fe atoms have negative adsorption free energies for the *CO2_2 configurations. These results are very different from those inferred from the adsorption energy at 0 K. The *CO2_2 configuration has a lower adsorption energy than that of the *CO2_1 configuration, except for Mn doping. Finally, based on the adsorption energies at 0 K and adsorption free energies at 298.15 K, only Sc, Ti, V, Mn and Fe-doped MoSi2N4-Nv are suitable as catalysts for CO2RR. From the relation between free energy and the equilibrium constant, ΔG0 = −RTln(Kp), the equilibrium constant Kp is calculated from the Gibbs free energies at 298.15 K listed in Table 1. As shown, only the equilibrium constants of Sc, Ti, V and Fe in the *CO2_2 configurations are larger than 103, and the values are 4.9 × 10¹³, 2.6 × 10⁵, 1.7 × 10⁴, and 2.4 × 10³ for Sc, Ti, V and Fe, respectively. The equilibrium constants of V and Mn in the *CO2_1 configurations are 2.2 and 7.0, respectively. Other equilibrium constant values are not bigger than 1, so they can be omitted. The calculations of equilibrium constants further confirm the conclusion inferred from the adsorption free energy.
Besides the adsorption free energies at room temperature, the charge transfer between CO2 and the catalytic surface can supply another insight. As shown in Fig. 2, the charge transfer occurs between the CO2 molecules and the TM atoms in the *CO2_2 configurations, donating electrons to the CO2via the C atom and significantly activating the CO bond and the CO2 molecules. The Bader charge (Table S5 in the ESI†) reveals that the charges obtained by CO2 decrease with increasing atomic number, consistent with the change in adsorption energy. Furthermore, the adsorption capacities of the Sc, Ti, Mn, Fe@MoSi2N4-Nv monolayers align with the predicted results of the d-band center, where the bond angles of CO2 after adsorption change from 180° to 132.1°–143.5°, adsorption energies of CO2 range from −1.32 to −0.46 eV, and CO2 molecules gain charges of 0.39–0.88 e. The *CO2_2 configurations will be used for further studies in the subsequent CO2RR process.
 |
| | Fig. 2 Differential charge density diagrams of CO2 adsorbed on (a) Sc@MoSi2N4-Nv, (b) Ti@MoSi2N4-Nv, (c) V@MoSi2N4-Nv, (d) Cr@MoSi2N4-Nv, (e) Mn@MoSi2N4-Nv, (f) Fe@MoSi2N4-Nv, (g) Co@MoSi2N4-Nv, (h) Ni@MoSi2N4-Nv, (i) Cu@MoSi2N4-Nv monolayers, respectively. The isosurfaces are 0.005 e Å−3. The charge accumulation and depletion are marked by the yellow and cyan regions, respectively. | |
3.3 Reaction pathway analysis of CO2RR
Previous studies have demonstrated that CO2RR can produce a range of products when CO2 molecules are adsorbed on the catalyst surface. These products include CO and HCOOH (two-electron products), CH3OH (six-electron product), CH4 (eight-electron product), and C2+ (generated by C–C coupling).52,53 The present work excludes considering the C2+ products due to the difficulty of achieving C–C coupling with only one active site in SAC.17,54Fig. 3(a) shows that CO and HCOOH are the two-electron products generated during CO2RR, via the CO2 → *COOH → *CO → CO and CO2 → *OCHO → *HCOOH → HCOOH pathways, respectively. The *CO and *HCOOH can produce the *CHO intermediate, which is crucial for the production of multi-electron products like CH4, in addition to desorption.
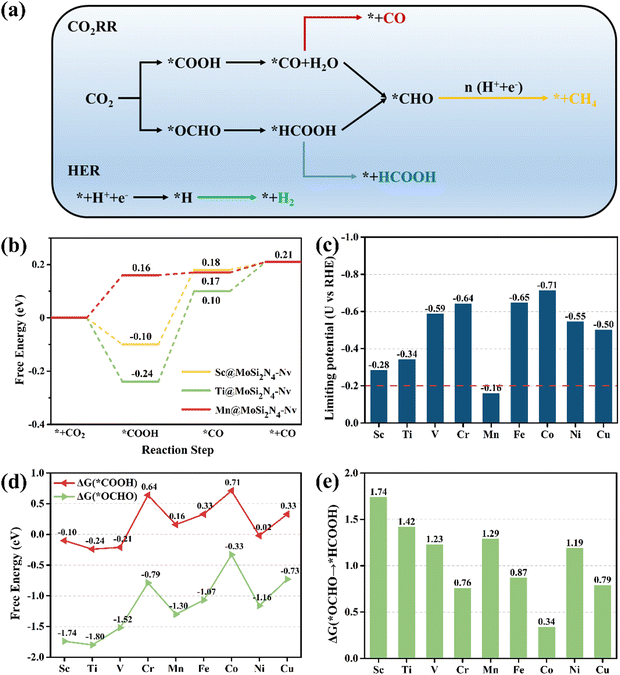 |
| | Fig. 3 (a) Schematic of the analyzed reaction pathways of CO2RR and HER in this work. (b) Gibbs free energy diagrams of CO2 to CO on the Sc, Ti, Mn@MoSi2N4-Nv monolayers (URHE = 0 V). (c) UL of CO2RR to CO on the TM@MoSi2N4-Nv (TM = Sc–Cu) monolayers. (d) ΔG of *COOH and *OCHO formations. (e) ΔG of *OCHO + H+ + e− → *HCOOH on TM@MoSi2N4-Nv (TM = Sc–Cu) monolayers. | |
The proton-coupled electron transfer (PCET) is a crucial step in the electrocatalytic process. At a basic level, PCET is defined as any process that entails the combined movement of at least one electron and one proton.55 The electron and proton could move in the same direction or in opposite or orthogonal directions. In heterogeneous electrochemical PCET, The electrode participates in chemical bond breaking and forming, serving as a reservoir for electrons. Simultaneously, protons are transferred to the electrode surface by H3O+ and facilitate the formation of reaction intermediates or products.56 Many electrocatalytic reaction mechanisms require multiple electron and proton transfers, and these transfers could be coupled to each other or other chemical steps. In the CO2RR process, the next challenge following CO2 adsorption on catalyst surfaces is the first hydrogenation step: * + CO2 + H+ + e− → *COOH. This step represents the first PCET step of CO2RR and is a significant obstacle due to the substantial energy required. Effective CO catalysts can reduce the free energy barrier in this step, thereby increasing the reaction rate of the entire CO2RR process. Furthermore, HER can deplete the active sites on the catalyst surface, thereby reducing the reaction rate. It is the main competing reaction for CO2RR.25,57 Therefore, an ideal CO catalyst should not only have high CO2RR activity but also inhibit other side reactions, such as the production of HCOOH, further hydrogenation of CO, and HER. In this study, we evaluate the activity of CO production on monolayers of TM@MoSi2N4-Nv (TM = Sc–Cu). Based on the above analysis, we consider the CO2RR with CO generation in the following steps:
| | | * + CO2 + H+ + e− → *COOH | (11) |
| | | *COOH + H+ + e− → *CO + H2O | (12) |
The pristine MoSi2N4 monolayer has a low capacity for activating CO2 molecules for adsorption, so forming the *COOH intermediate requires overcoming a high ΔG of 4.07 eV, which directly impedes subsequent reactions. The surface structure of the pristine MoSi2N4 monolayer needs to be properly modified, i.e., doped with TM atoms, due to its poor CO2RR performance. According to the Brønsted–Evans–Polanyi relationship, reactions with lower ΔG have smaller thermodynamic barriers and are therefore kinetically favorable.58,59 As shown in Fig. 3(b), after comparing the ΔGmax for CO production on TM@MoSi2N4-Nv (TM = Sc–Cu) monolayers, the results indicate that the Sc, Ti, Mn@MoSi2N4-Nv monolayers have lower ΔGmax values of 0.28, 0.34, and 0.16 eV, respectively, suggesting excellent CO catalytic activity. In fact, the Gibbs free energy diagrams of CO production from the TM@MoSi2N4-Nv (TM = Sc–Cu) monolayers (Fig. S5 in the ESI†) indicate that generating *COOH becomes easier in all the systems when compared to the pristine MoSi2N4 monolayers. This suggests that doping TM atoms in the pristine MoSi2N4 monolayers reduces the ΔG of generating *COOH, which significantly enhances the CO2RR performance and increases the catalytic rate. However, the ΔG for CO production and the potential determining steps (PDS) vary with different TM@MoSi2N4-Nv monolayers. The PDS for the Cr, Mn, Co@MoSi2N4-Nv monolayers is the activation process of CO2: * + CO2 + H+ + e− → *COOH. The PDS for the Sc, Ti@MoSi2N4-Nv monolayers is the dehydration and the CO product generation process: *COOH + H+ + e− → *CO + H2O. In contrast, the RDS for the V, Fe, Ni, Cu@MoSi2N4-Nv monolayers is the CO desorption process: *CO →* + CO. On the other hand, for the Fe, Ni, Cu@MoSi2N4-Nv monolayers, the formation of *COOH is the PDS. The details on the intermediate configurations are provided in Fig. S6 (ESI†). Detailed information on the distances between substrates and intermediates, as well as the binding energy and binding free energy of the intermediates, are given in Tables S6 and S7 in the ESI,† respectively. From Table S6 in the ESI,† the *COOH binding energies of nine TM, @MoSi2N4-Nv monolayers are all negative, indicating that the COOH product can adsorb on the monolayer surface after being generated. When the temperature is 298.15 K, the COOH binding free energies of Sc, Ti, V and Ni@MoSi2N4-Nv monolayers are −0.11 eV, −0.25 eV, 0.21 eV and −0.01 eV, respectively. The other five TM@MoSi2N4-Nv monolayers have positive binding free energies, which indicates the *COOH on the TM@MoSi2N4-Nv monolayers tends to desorb. Because the COOH is a reactant for the CO product generation process, *COOH + H+ + e− → *CO + H2O, the desorption of *COOH will hinder the CO generation. According to this, only Sc, Ti, V and Ni@MoSi2N4-Nz monolayers are suitable as catalysts for CO generation.
Theoretical UL has been shown as an effective metric for evaluating catalyst activity.46Fig. 3(c) shows that the UL values for CO production on the Sc, Ti, Mn@MoSi2N4-Nv monolayers are more positive, which are −0.28, −0.34, and −0.16 V, respectively, than those of the other monolayers. To further evaluate the CO2RR performance of these catalysts, we have summarized the CO-generating performance of other SACs reported in previous studies for comparison (Table S8 in the ESI†). The comparison shows that the UL of the Sc, Ti, Mn@MoSi2N4-Nv monolayers is still larger than that of most catalysts, demonstrating their excellent catalytic performance. The UL of the Mn@MoSi2N4-Nv monolayer (−0.16 V) is larger than that of the Mn–N3 SAC embedded in graphitic carbon nitride (−0.24 V).60 As shown in Fig. 3(c), the maximum value of the UL (−0.20 V) for the SACs summarized in Table S8 in the ESI† is marked with a red dashed line. Only the UL of the Mn@MoSi2N4-Nv monolayer is still larger than this value, indicating its higher catalytic activity.
It is important to consider the generation of HCOOH as a side reaction. Upon adsorption of CO2 molecules on the catalyst surface, the proton–electron pair can attack the C atom to form the *OCHO intermediate and then attack the O atom to form the *HCOOH intermediate, which ultimately yields the HCOOH product.61,62 Thus, *COOH and *OCHO are both intermediates in the first protonation step of CO2RR and correspond to CO and HCOOH, respectively. To assess the selectivity of the TM@MoSi2N4-Nv (TM = Sc–Cu) monolayers between CO and HCOOH, we first examine the propensity of CO2 to produce *COOH and *OCHO on these monolayers. As shown in Fig. 4(d), all monolayers prefer to produce *OCHO than *COOH, i.e., ΔG(*OCHO) < ΔG(*COOH). However, Fig. 4(e) shows that the production of *HCOOH requires overcoming very large ΔG for almost all the monolayers. Although it is easier to produce the *OCHO compared to the *COOH, the CO will still be the preferred product for these monolayers according to the Brønsted–Evans–Polanyi relationship.58,59 However, for the Co@MoSi2N4-Nv monolayer, the ΔG for *OCHO → *HCOOH is only 0.34 eV, which is much lower than that of the other monolayers and lower than the ΔG for forming *COOH (0.71 eV). After generating *HCOOH, the HCOOH product can be produced by overcoming the ΔG of 0.49 eV. Thus, the Co@MoSi2N4-Nv monolayer will preferentially generate the HCOOH product over the CO product. Additionally, the PDS height is only 0.49 eV, which is lower than that of the HCOOH product generated by directly modifying the Co atoms on the MoSi2N4 surface (0.89 eV).31
 |
| | Fig. 4 (a) ΔG for the first protonation step in the CO2RR (ΔG(*COOH)) and HER (ΔG(*H)). (b) UL difference between CO2RR and HER (UL(CO2RR) − UL(HER)). | |
The analysis above indicates that the ΔGmax for CO production in the Sc, Ti, Mn@MoSi2N4-Nv monolayers is lower than that for HCOOH production, suggesting that *CO is easily generated from their surface. At this stage, either *CO desorbs to produce CO or continued hydrogenation of *CO generates C1 products (Fig. 3(a)). The *CHO is crucial in the production of C1 products such as CH4. Therefore, we focus on the selectivity of the reaction between *CO desorption and *CO hydrogenation to produce *CHO. The free energy diagrams for CH4 generation from the Sc, Ti, Mn@MoSi2N4-Nv monolayers, where the reaction pathway is *CO → *CHO → *OCH2 → *OCH3 → *O + CH4 → *OH → * + H2O, are given as Fig. S7–S9 in the ESI.† For the Sc, Ti@MoSi2N4-Nv monolayers, despite the exothermic nature of the *CO → *CHO step with respect to the *CO desorption step, to complete the reaction process to produce CH4, the subsequent hydrogenation needs to overcome the ΔG of 1.52 eV and 1.64 eV, respectively. The Mn@MoSi2N4-Nv monolayer only requires 0.07 eV for the protonation of *CO to form *CHO. However, this is still larger than the thermodynamic barrier for CO desorption (0.04 eV). The ΔG for the formation of CH4 is 1.12 eV, which is unfavorable for the production of CH4. This is consistent with the Sc, Ti@MoSi2N4-Nv monolayers. Furthermore, according to the Sabatier principle,63 the adsorption of *CO is less stable, which favors the desorption of *CO over further reduction. In Table S7 in the ESI,† the *CO binding energies of Sc, Ti, Mn@MoSi2N4-Nv monolayers are −0.21, −0.24, and −0.19 eV, respectively. These values are higher than the CO binding energy of −0.75 eV calculated on edge-hosted Fe–N4 SAC.64 The Faraday efficiency of CO on edge-hosted Fe–N4 SAC is up to 94%, indicating that the CO product can be smoothly desorbed after being generated on its surface. Therefore, *CO on the Sc, Ti, Mn@MoSi2N4-Nv monolayers tend to desorb, producing CO products and inhibiting the generation of other products. When the temperature is 298.15 K, the *CO binding free energies Gb of Sc, Ti, Mn@MoSi2N4-Nv monolayers are 0.27, 0.19, and 0.26 eV, respectively. These positive values further indicate that *CO on the Sc, Ti, Mn@MoSi2N4-Nv monolayers is unstable and tends to desorb from the surface, which is helpful for producing CO at room temperature.
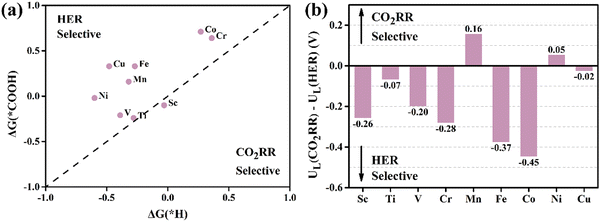
3.4 Selectivity for the CO2RR versus the HER
It is widely acknowledged that the most probable competitive reaction in the CO2RR process is the HER, which is * + H+ + e− → *H,65,66 because the H atom absorption is inevitable for CO2RR applications. The initial hydrogenation step should be more favourable to the formation of *COOH or *OCHO than *H.57,67 The calculated UL of HER on the TM@MoSi2N4-Nv surface ranges from −0.6 to −0.03 V (Fig. S10, ESI†). In order to gain insights into the competition between HER and CO2RR at the first protonation step, two cases with or without applied potential should be considered. In the case without the applied potential, if the ΔG of HER and that of CO2RR are equal, the two reactions occur simultaneously. This corresponds to the 45-degree line in the coordinate system where horizontal and vertical coordinates are selected as ΔG of HER and that of CO2RR, respectively. As shown in Fig. 4(a), the majority of data are above the line, meaning that these catalysts prefer the first protonation step of HER at an applied potential of zero. In the presence of an applied potential, the UL is taken as an indicator of the preference for HER and CO2RR. If the difference between UL(CO2RR) and UL(HER) is a positive value, it indicates the catalyst easily generates a CO2RR product. A more positive result indicates a higher CO2RR selectivity of the catalyst.14,20 This result is more reflective of the selectivity of the actual reactions because actual reactions involve the applied potential. As shown in Fig. 4(b), the result of UL(CO2RR) − UL(HER) is 0.16 V on the Mn@MoSi2N4-Nv monolayer, which indicates that CO can be preferentially produced on its surface over H2 in the presence of an applied potential. Therefore, considering all the competing reactions, CO will be the primary product on the Mn@MoSi2N4-Nv monolayer.
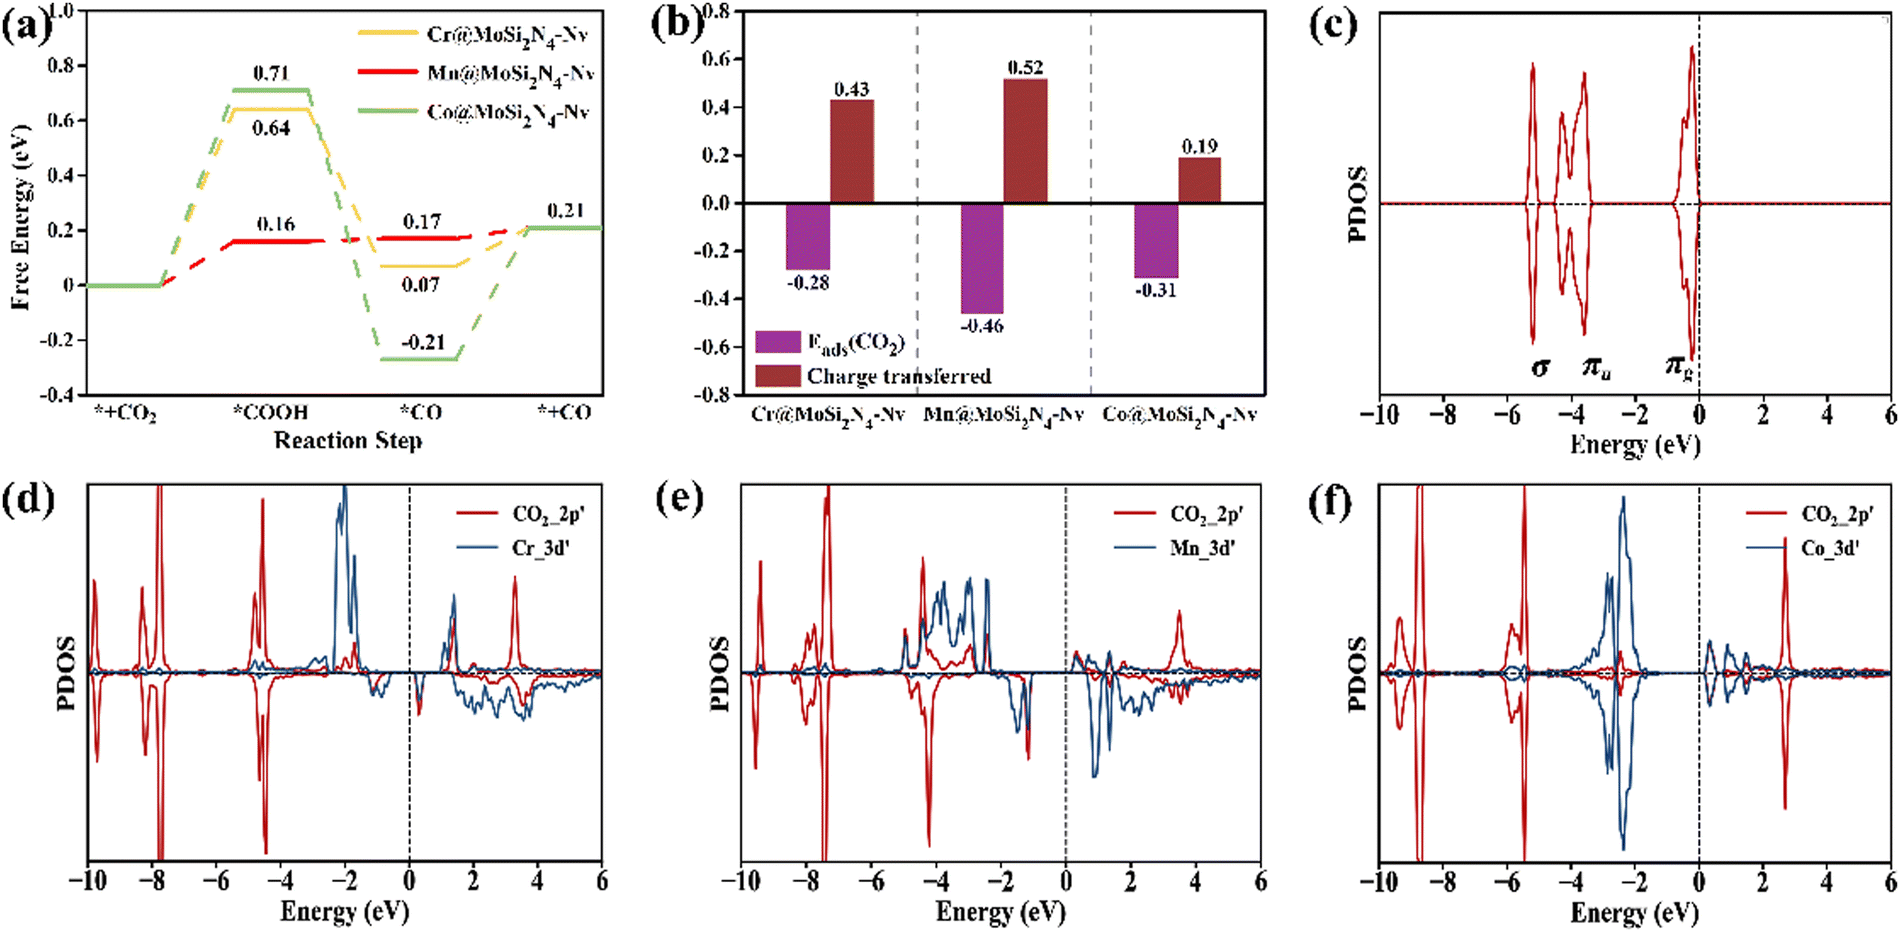
3.5 Origin of the catalytic activity of Mn@MoSi2N4-Nv
Fig. 5(a) shows that the Mn@MoSi2N4-Nv monolayer adsorbs CO2, requiring a ΔG of 0.16 eV to produce *COOH. Subsequently, *CO is produced with a ΔG of 0.01 eV, which then desorbs to produce the CO product with a low ΔG of 0.04 eV. In contrast, the Cr and Co@MoSi2N4-Nv monolayers, which have the same PDS as the Mn@MoSi2N4-Nv monolayer, produce *COOH with much larger ΔG of 0.64 eV and 0.71 eV, respectively. In order to investigate the reasons behind the exceptional CO2RR performance of the Mn@MoSi2N4-Nv monolayer, it is essential to analyze its origins. The Mn@MoSi2N4-Nv monolayer exhibits a higher CO2 adsorption energy and transfers more charges than the other two monolayers, as shown in Fig. 5(b). This indicates that it can adsorb CO2 molecules more stably. Additionally, Fig. 5(d)–(f) displays the PDOS of the Cr, Mn, Co@MoSi2N4-Nv monolayers after CO2 adsorption, with the PDOS of CO2 molecules included for comparison in Fig. 5(c). Upon the adsorption of CO2, the bonding orbital of CO2 splits and overlaps with the 3d orbital of the TM atoms. This results in the transfer of electrons from the πg orbital of CO2 to the empty d orbital of the TM atoms. The 3d orbital of Mn@MoSi2N4-Nv fully overlaps with the 2p orbital of CO2, and the bonding orbitals are hybridized compared to those of the Cr, Co@MoSi2N4-Nv monolayers. This synergistic effect of electron acceptance, feedback and d-orbital occupation ensures the stable adsorption and effective activation of CO2 and contributes to the difference in catalytic activity.14,16,31 Moreover, the presence of an empty antibonding orbital near the Fermi energy level makes it easier for the Mn@MoSi2N4-Nv monolayer to accept electrons and continue the hydrogenation, which reduces the difficulty of generating *COOH.
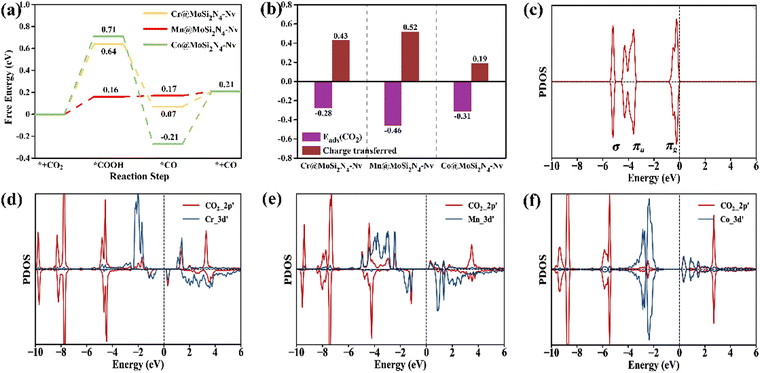 |
| | Fig. 5 (a) Gibbs free energy diagrams of CO2 to CO on the Cr, Mn, Co@MoSi2N4-Nv monolayer (URHE = 0 V). (b) Comparison of CO2 adsorption energy and CO2 transferred charges on the Cr, Mn, Co@MoSi2N4-Nv monolayers. (c) Molecular orbitals (MO) of the free CO2 molecule. The PDOS of CO2 adsorbed on the (d) Cr@MoSi2N4-Nv, (e) Mn@MoSi2N4-Nv and (f) Co@MoSi2N4-Nv monolayer. | |
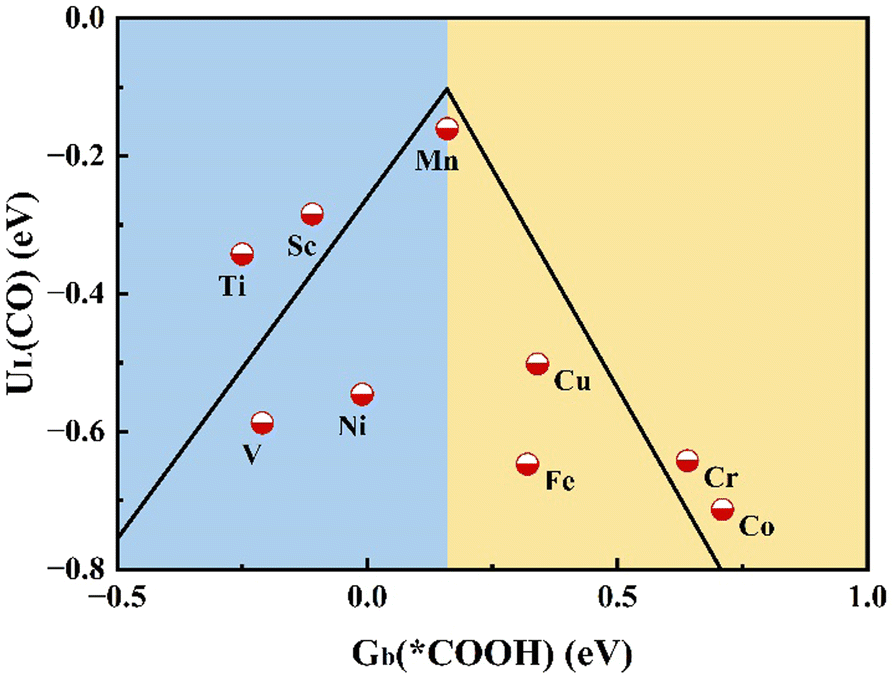
In order to confirm the relationship between adsorption energy and catalytic activity, we illustrate the limiting potential UL of the TM@MoSi2N4-Nv (TM = Sc–Cu) monolayers for CO production with the binding free energy Gb at 298.15 K of the *COOH by plotting it as a volcano plot.2,18,66 As shown in Fig. 6, the Mn@MoSi2N4-Nv monolayer is closest to the summit position of the activity volcano, while the Sc, Ti@MoSi2N4-Nv monolayers are closer to the summit of the activity volcano, and the Cr, Co@MoSi2N4-Nv monolayers are far away from the summit of the volcano. This is in accordance with the Sabatier principle that catalysts with appropriate intermediate adsorption strengths have superior catalytic performance.63 Also, the volcano plot using the limiting potential UL of the TM@MoSi2N4-Nv (TM = Sc–Cu) monolayers for CO production and the binding energy (0 K) of the *COOH is given as Fig. S11 (ESI†), where a similar trend can be found.
 |
| | Fig. 6 Activity volcano plot for two-electron reduction of CO2 to CO, and the relationship between the binding free energy Gb (*COOH) and UL(CO). | |
4. Conclusions
In this study, following the principle of single atomic catalysts, we investigate the potential of 10 TM atoms (Sc–Zn) doped on the MoSi2N4 monolayer as CO2RR catalysts by first-principles calculations. Based on our screening results, we found: (1) the Sc, Ti, and Mn-doped structures exhibit very low limiting potentials; (2) out of Sc, Ti and Mn doping, the Mn@MoSi2N4-Nv structure shows the best catalytic performance with a limiting potential of only −0.16 V and also has an advantage over the HER. However, when Mn@MoSi2N4-Nv monolayers act as catalysts, the positive binding free energy of the intermediate reactant *COOH indicates the unstable adsorption of COOH on the catalytic surface, which will hinder the CO product generation process: *COOH + H+ + e− → *CO + H2O. So, a low temperature will be favorable for CO generation using Mn@MoSi2N4-Nv as catalysts. The effect of temperature will play an important role in the electrochemical catalytic reactions and our work provides some examples. Our work provides potential CO catalysts based on TM-doped MoSi2N4, and it is more important that the temperature effects be taken into account to get realistic insights into the electrochemical reaction process.
Data availability
The data that support the findings of this study are available from the corresponding authors upon reasonable request.
Conflicts of interest
There are no conflicts to declare.
Acknowledgements
This work was financially supported by the National Natural Science Foundation of China (NSFC, no. U20A20145 and 11974004). We gratefully acknowledge HZWTECH for providing computation facilities. This work was also supported by the High-performance Computing Platform of UESTC.
References
- R. Wu, D. Liu, J. Geng, H. Bai, F. Li, P. Zhou and H. Pan, Appl. Surf. Sci., 2022, 602, 154239 CrossRef CAS.
- Y. Zhang, R. Yang, H. Li and Z. Zeng, Small, 2022, 18, 2203759 CrossRef CAS.
- H. Chen, A. D. Handoko, T. Wang, J. Qu, J. Xiao, X. Liu, D. Legut, Z. Wei Seh and Q. Zhang, ChemSusChem, 2020, 13, 5690–5698 CrossRef CAS PubMed.
- Y. Y. Birdja, E. Pérez-Gallent, M. C. Figueiredo, A. J. Göttle, F. Calle-Vallejo and M. T. M. Koper, Nat. Energy, 2019, 4, 732–745 CrossRef CAS.
- D. Gao, T. Liu, G. Wang and X. Bao, ACS Energy Lett., 2021, 6, 713–727 CrossRef CAS.
- Y. Chen, S. Ji, C. Chen, Q. Peng, D. Wang and Y. Li, Joule, 2018, 2, 1242–1264 CrossRef CAS.
- N. Li, X. Wang, X. Lu, P. Zhang and W.-J. Ong, Chem. – Eur. J., 2021, 27, 17900–17909 CrossRef CAS PubMed.
- T. Liu, G. Wang and X. Bao, J. Phys. Chem. C, 2021, 125, 26013–26020 CrossRef CAS.
- S. Cao, Y. Hu, C. Yang, J. Li, H. Chen, S. Wei, S. Liu, Z. Wang, D. Sun and X. Lu, J. CO2 Util., 2022, 62, 102074 CrossRef CAS.
- B. Xiong, Y. Yang, J. Liu, Z. Hua and Y. Yang, Fuel Process. Technol., 2022, 233, 107315 CrossRef CAS.
- M. Liu, Y. Pang, B. Zhang, P. De Luna, O. Voznyy, J. Xu, X. Zheng, C. T. Dinh, F. Fan, C. Cao, F. P. G. de Arquer, T. S. Safaei, A. Mepham, A. Klinkova, E. Kumacheva, T. Filleter, D. Sinton, S. O. Kelley and E. H. Sargent, Nature, 2016, 537, 382–386 CrossRef CAS PubMed.
- Q. Lu, J. Rosen, Y. Zhou, G. S. Hutchings, Y. C. Kimmel, J. G. Chen and F. Jiao, Nat. Commun., 2014, 5, 3242 CrossRef PubMed.
- H. Xu, D. Cheng, D. Cao and X. C. Zeng, Nat. Catal., 2018, 1, 339–348 CrossRef CAS.
- P. Hou, Y. Huang, F. Ma, X. Wei, R. Du, G. Zhu, J. Zhang and M. Wang, Appl. Surf. Sci., 2023, 619, 156747 CrossRef CAS.
- C. Zhao, X. Su, S. Wang, Y. Tian, L. Yan and Z. Su, J. Mater. Chem. A, 2022, 10, 6178–6186 RSC.
- Z. Lou, W. Li, H. Yuan, Y. Hou, H. Yang and H. Wang, J. Mater. Chem. A, 2022, 10, 3585–3594 RSC.
-
X.-F. Yang, A. Wang, B. Qiao, J. U. N. Li, J. Liu and T. Zhang, Single-atom catalysts: a new frontier in heterogeneous catalysis, 2013 Search PubMed.
- X. Cui, W. An, X. Liu, H. Wang, Y. Men and J. Wang, Nanoscale, 2018, 10, 15262–15272 RSC.
- Y. W. Sun and J. Y. Liu, Phys. Chem. Chem. Phys., 2023, 25(6), 4773–4779 RSC.
- F. Xu, X. Wang, X. Liu, C. Li, G. Fan and H. Xu, Mol. Catal., 2022, 530, 112571 CrossRef CAS.
- B. Qiao, A. Wang, X. Yang, L. F. Allard, Z. Jiang, Y. Cui, J. Liu, J. Li and T. Zhang, Nat. Chem., 2011, 3, 634–641 CrossRef CAS.
- K. S. Novoselov, A. K. Geim, S. V. Morozov, D.-E. Jiang, Y. Zhang, S. V. Dubonos, I. V. Grigorieva and A. A. Firsov, Science, 2004, 306, 666–669 CrossRef CAS PubMed.
- W. Fan, C. Liu, C. Hu, X. Liu, X. Wang, J. Wu, Z. Yu, P. Cheng, T. Yang, Q. Liu and Y. Qi, Appl. Surf. Sci., 2023, 635, 157611 CrossRef CAS.
- Z. Lu, Y. Cheng, S. Li, Z. Yang and R. Wu, Appl. Surf. Sci., 2020, 528, 147047 CrossRef CAS.
- Y. Pan, R. Lin, Y. Chen, S. Liu, W. Zhu, X. Cao, W. Chen, K. Wu, W.-C. Cheong, Y. Wang, L. Zheng, J. Luo, Y. Lin, Y. Liu, C. Liu, J. Li, Q. Lu, X. Chen, D. Wang, Q. Peng, C. Chen and Y. Li, J. Am. Chem. Soc., 2018, 140, 4218–4221 CrossRef CAS PubMed.
-
Z. Yu, H. Xu and D. Cheng, Design of Single Atom Catalysts, Report null, Taylor & Francis, 2021 Search PubMed.
- W. Ding, Z. Xue, J. Li, M. Li, L. Bai, Q. Zhou, X. Zhou, Y. Peng and L. Miao, ECS J. Solid State Sci. Technol., 2022, 11, 016001 CrossRef.
- W. Shi, G. Yin, S. Yu, T. Hu, X. Wang and Z. Wang, J. Mater. Sci., 2022, 57, 18535–18548 CrossRef CAS.
- C. Xiao, R. Sa, Z. Cui, S. Gao, W. Du, X. Sun, X. Zhang, Q. Li and Z. Ma, Appl. Surf. Sci., 2021, 563, 150388 CrossRef CAS.
- Y. Luo, M. Li, Y. Dai, X. Zhang, R. Zhao, F. Jiang, C. Ling and Y. Huang, J. Mater. Chem. A, 2021, 9, 15217–15225 RSC.
- W. Xun, X. Yang, Q.-S. Jiang, M.-J. Wang, Y.-Z. Wu and P. Li, ACS Appl. Energy Mater., 2023, 6, 3236–3243 CrossRef CAS.
- Y. Linghu, T. Tong and C. Wu, Appl. Surf. Sci., 2023, 609, 155332 CrossRef CAS.
- T. Tong, Y. Linghu, G. Wu, C. Wang and C. Wu, Phys. Chem. Chem. Phys., 2022, 24, 18943–18951 RSC.
- S. Lu, Y. Zhang, F. Lou, K. Guo and Z. Yu, Appl. Surf. Sci., 2022, 579, 152234 CrossRef CAS.
- Y. Zang, Q. Wu, W. Du, Y. Dai, B. Huang and Y. Ma, Phys. Rev. Mater., 2021, 5, 045801 CrossRef CAS.
- S. Cao, H. Chen, Y. Hu, J. Li, C. Yang, Z. Chen, S. Wei, S. Liu, Z. Wang, D. Sun and X. Lu, Chem. Eng. J., 2023, 461, 141936 CrossRef CAS.
- J. M. Spurgeon and B. Kumar, Energy Environ. Sci., 2018, 11, 1536–1551 RSC.
- S. Jin, Z. Hao, K. Zhang, Z. Yan and J. Chen, Advances and Challenges for the Electrochemical Reduction of CO2 to CO: From Fundamentals to Industrialization, Report, 2021, 1433–7851 Search PubMed.
- Z. Gao, Y. Meng, A. Koso, J. Mishima, B. Xie, Z. Ni and S. Xia, Colloids Surf., A, 2022, 648, 129365 CrossRef CAS.
- X. Guan, C. Zhao, X. Liu, S. Liu, W. Gao and Q. Jiang, J. Phys. Chem. C, 2020, 124, 25898–25906 CrossRef CAS.
- P. E. Blöchl, Phys. Rev. B: Condens. Matter Mater. Phys., 1994, 50, 17953 CrossRef.
- G. Kresse and D. Joubert, Phys. Rev. B: Condens. Matter Mater. Phys., 1999, 59, 1758 CrossRef CAS.
- J. P. Perdew, K. Burke and M. Ernzerhof, Phys. Rev. Lett., 1996, 77, 3865 CrossRef CAS.
- S. Grimme, J. Antony, S. Ehrlich and H. Krieg, J. Chem. Phys., 2010, 132, 154104 CrossRef.
- S. L. Dudarev, G. A. Botton, S. Y. Savrasov, C. J. Humphreys and A. P. Sutton, Phys. Rev. B: Condens. Matter Mater. Phys., 1998, 57, 1505–1509 CrossRef CAS.
- A. A. Peterson, F. Abild-Pedersen, F. Studt, J. Rossmeisl and J. K. Nørskov, Energy Environ. Sci., 2010, 3, 1311–1315 RSC.
- J. K. Nørskov, J. Rossmeisl, A. Logadottir, L. R. K. J. Lindqvist, J. R. Kitchin, T. Bligaard and H. Jonsson, J. Phys. Chem. B, 2004, 108, 17886–17892 CrossRef.
- J. Rossmeisl, A. Logadottir and J. K. Nørskov, Chem. Phys., 2005, 319, 178–184 CrossRef CAS.
- Z. Cui, K. Yang, K. Ren, S. Zhang and L. Wang, Mater. Sci. Semicond. Process., 2022, 152, 107072 CrossRef CAS.
- G. Liu, A. W. Robertson, M. M. J. Li, W. C. H. Kuo, M. T. Darby, M. H. Muhieddine, Y. C. Lin, K. Suenaga, M. Stamatakis, J. H. Warner and S. C. E. Tsang, Nat. Chem., 2017, 9, 810–816 CrossRef CAS PubMed.
- B. Hammer and J. K. Norskov, Nature, 1995, 376, 238–240 CrossRef CAS.
- T. K. Todorova, M. W. Schreiber and M. Fontecave, ACS Catal., 2020, 10, 1754–1768 CrossRef CAS.
-
S. Xu and E. A. Carter, Theoretical Insights into Heterogeneous (Photo)electrochemical CO2 Reduction, Report 0009-2665, American Chemical Society, 2019 Search PubMed.
- H. Li, T. Liu, P. Wei, L. Lin, D. Gao, G. Wang and X. Bao, Angew. Chem., Int. Ed., 2021, 60, 14329–14333 CrossRef CAS.
- S. Hammes-Schiffer, Energy Environ. Sci., 2012, 5, 7696–7703 RSC.
-
R. E. Warburton, A. V. Soudackov and S. Hammes-Schiffer, Theoretical Modeling of Electrochemical Proton-Coupled Electron Transfer, Report 0009-2665, American Chemical Society, 2022 Search PubMed.
- Y. Tian, T. Zhao, C. Zhao and Y. Likai, Appl. Surf. Sci., 2022, 597, 153724 CrossRef CAS.
- J. N. Brønsted, Chem. Rev., 1928, 5, 231–338 CrossRef.
- M. G. Evans and M. Polanyi, Trans. Faraday Soc., 1938, 34, 11–24 RSC.
- J. Feng, H. Gao, L. Zheng, Z. Chen, S. Zeng, C. Jiang, H. Dong, L. Liu, S. Zhang and X. Zhang, Nat. Commun., 2020, 11, 4341 CrossRef.
- Y. Liu, J. Zhao and Q. Cai, Phys. Chem. Chem. Phys., 2016, 18, 5491–5498 RSC.
- Z. Jiang, T. Wang, J. Pei, H. Shang, D. Zhou, H. Li, J. Dong, Y. Wang, R. Cao, Z. Zhuang, W. Chen, D. Wang, J. Zhang and Y. Li, Energy Environ. Sci., 2020, 13, 2856–2863 RSC.
- M. Che, Catal. Today, 2013, 218–219, 162–171 CrossRef CAS.
- F. Pan, B. Li, E. Sarnello, Y. Fei, X. Feng, Y. Gang, X. Xiang, L. Fang, T. Li, Y. H. Hu, G. Wang and Y. Li, ACS Catal., 2020, 10, 10803–10811 CrossRef CAS.
- N. Li, X. Chen, W.-J. Ong, D. R. MacFarlane, X. Zhao, A. K. Cheetham and C. Sun, ACS Nano, 2017, 11, 10825–10833 CrossRef CAS.
- Y. Xiao and W. Zhang, Nanoscale, 2020, 12, 7660–7673 RSC.
- X. Wang, H. Niu, Y. Liu, C. Shao, J. Robertson, Z. Zhang and Y. Guo, Catal. Sci. Technol., 2020, 10, 8465–8472 RSC.
|
| This journal is © the Owner Societies 2025 |
Click here to see how this site uses Cookies. View our privacy policy here. 
 *a and
Jianwei
Wang
*a and
Jianwei
Wang