 Open Access Article
Chemical characterization of polymer and chloride content in waste plastic materials using pyrolysis – direct analysis in real time – high-resolution mass spectrometry†
Emily
Halpern
 a,
Lauren
Heirty
a,
Christopher
West
a,
Lauren
Heirty
a,
Christopher
West
 a,
Yitao
Li
b,
Won M.
Kim
c,
Anthony S.
Mennito
c and
Alexander
Laskin
 *a
*a
aDepartment of Chemistry, Purdue University, West Lafayette, IN 47907, USA. E-mail: alaskin@purdue.edu
bDepartment of Statistics, Purdue University, West Lafayette, IN 47907, USA
cExxonMobil Technology and Engineering Company, Annandale, NJ 08801, USA
First published on 30th December 2024
Abstract
The increasing global demand for plastic has raised the need for effective waste plastic management due to its long lifetime and resistance to environmental degradation. There is a need for rapid plastic identification to improve the mechanical waste plastic sorting process. This study presents a novel application of Temperature-Programmed Desorption-Direct Analysis in Real Time-High Resolution Mass Spectrometry (TPD-DART-HRMS) that enables rapid characterization of various plastics. This technique was applied on four commercially available reference polymers (polyethylene, polypropylene, polystyrene, polyvinyl chloride) as well as three “waste” plastic samples of mixed origin. These waste plastic samples were obtained as discards from various industrial processes with limited analytical characterization data. Through the application of CH2 Kendrick mass defect (KMD) grouping, characteristic trends in the mass spectra of each sample were identified, allowing for a simplified numerical comparison. This approach utilized a robust statistical approach using the Tanimoto coefficient, allowing for the quantitative measures of similarity between standards and unknown samples. The application of this mathematical evaluation methodology was used to identify plastic types and to distinguish structurally similar polymers. Additionally, we report that a chloride ion clustering effect with copper substrate can identify chlorinated polymer PVC (polyvinyl chloride) utilizing pyro-(−)DART-HRMS mode. PVC polymer is of particular interest in recycling due to its high chloride content, which can present technical challenges for some types of recycling. We found that chloride ion clusters are a good screening marker for the presence of chlorinated polymers in mixed waste plastic samples. This study can possibly help advance rapid and accurate analytical techniques for identifying the composition of waste plastics to advance the effectiveness of the waste plastic sorting process.
Environmental significanceIt is estimated that less than 10% of post-consumer plastic is recycled worldwide. Technologies that can aid in increasing overall plastic recycling rates are sought. Any diversion of waste plastics into recycling will have the benefit of reducing the plastics that are unmitigated entering into the environment. One challenge is that plastic waste streams often include a mix of plastic types that must be separated as each plastic type can have different processing requirements. Current methods of sorting and separating waste plastics are costly. Additionally, there are no universal means of easily sorting and segregating mixed plastic wastes. Analytical techniques that can quickly identify plastic types, especially halogenated plastics, can improve mechanical sorting efficiency. This study demonstrates a widely applicable method to rapidly screen plastic type, including PVC, in mixed streams. |
Introduction
As global demand for plastic continues to grow, the management of plastic waste has become a societal concern.1–3 Global annual plastic production has doubled over the last 20 years to over 460 million tons (Mt). The primary disposal rates by pathway for post-consumer plastic waste are estimated as follows: 69% to managed landfills and incineration facilities, 9% recycling, and 22% unmitigated, such as unmanaged dumpsites, burnings, or released into the environment.4 The environmental impacts of plastic waste present a complex challenge due to the material's durability and longevity. With only 9% of plastic currently being recycled, a significant need exists to divert more plastic from landfills and incineration into recycling streams. Progress in this area is largely dependent on the accurate identification and sorting of different types of plastics. Advanced techniques are needed to improve plastic identification, facilitating sorting accuracy and recycling efficiency. As a result, overall recycling rates may be increased, and the volume of plastic waste entering landfills or incineration facilities could be reduced, contributing to more sustainable waste management practices. The current methods of recycling can include mechanical and chemical recycling and other methods of disposal such as reuse without alteration and waste-to-energy.5,6 Improvements in all of these approaches will advance the circular plastic economy, which can conserve energy, preserve valuable materials, and reduce unwanted waste from entering the environment.1,2 This work is particularly timely and relevant given the ongoing negotiations for a Global Plastics Treaty, led by the United Nations Environment Assembly, which aims to increase plastic circularity.7 Contributions are being made to improve plastic identification and sorting, supporting the goals of the treaty and helping to create a more circular economy for plastics. The complexities in enhancing plastic recycling are multifaceted and technically difficult. Diverse plastic types entering the plastic waste stream often require polymer-specific recycling methods, and not all polymers can be repurposed equally efficiently.1,6,8 The heterogeneity of plastics, enhanced by the use of different additives, further complicates the recycling process.5,9,10 A common plastic disposal method, such as incineration, can generate harmful byproducts if not mitigated, posing challenges in safe handling and environmental compliance concerns.3 A particularly challenging aspect is the presence of halides in plastics that can yield acids such as hydrofluoric and hydrochloric acids (HF, HCl) that can result in equipment fouling.11 Therefore, there is a need for the development of rapid and efficient screening analytical techniques that can rapidly identify and characterize the molecular composition of plastic, improving the viability for use as feedstock for various recycling methodologies.10,12Spectroscopy methods, particularly FTIR and Raman, are widely employed for screening plastic types and evaluating plastic strain.5,6 Other spectroscopy techniques used for plastic screening include laser-induced breakdown spectroscopy (LIBS) and X-ray based methods. LIBS and X-ray fluorescence spectroscopy are effective for rapid detection and sorting plastics containing elements beyond the common C, N, O, such as polyvinyl chloride (Cl), polysulfone (S), and polytetrafluoroethylene (F).13,14 Additionally, X-ray absorption spectroscopy combined with neural network algorithms for statistical analysis of spectral features, has been demonstrated for classifying various plastic types.15 However, spectroscopic methods provide limited information about polymer chain length and minor additives within plastic mixtures, making it challenging to accurately identify plastic types and trace components.6 For more detailed molecular-level characterization, plastic pyrolysis coupled with gas chromatography-mass spectrometry (pyro-GC/MS) is often utilized. This technique, however, is limited to detecting relatively low-molecular-weight fragments (<650 m/z)16 and can be time-consuming, with single runs typically exceeding 10 minutes.9,17 The application of Direct Analysis in Real Time – Mass Spectrometry (DART-MS) has been used widely in characterizing polymers18–26 and polymer additives found in plastic waste.27–31 DART operates as an ambient pressure ionization method, enabling the mass spectrometric detection of plastic fragment ions with a mass-to-charge ratio of <2000 m/z produced from samples of solid plastic, achieved without the generation of multiply charged ions and the need for sample preparation.32,33 DART-MS produces more complex spectra compared to pyro-GC/MS. However, due to the absence of a separation stage, the much shorter analysis time offers a distinct advantage for sorting mixed plastic streams.34 To take advantage of these two techniques, we utilized a temperature-programmed desorption/pyrolysis approach in conjunction with DART-MS, known as pyro-DART-MS.35 This innovative method facilitates the selective desorption of plastic fragments by controlling temperature and heating rates. It also provides a more comprehensive sample characterization that is derived from a more reproducible temperature profile.35,36 Additionally, the inclusion of the pyrolysis stage alleviates the impact of the ionizing plasma temperature in DART and reduces associated matrix effects upon ionization which distinguishes it from traditional DART-MS.32,37 The versatility of pyro-DART-MS is demonstrated as it can be applied to solids, flakes, liquids, and powders.35,37–39 Furthermore, it can serve as a proxy system for studying processes of polymer thermal decomposition and pyrolysis.1,2 This technique has been previously employed for polymer sample analysis35,40,41 and the chemical analysis of complex environmental microplastic samples.17,40,42 Interfacing a high-resolution mass spectrometer (HRMS) with the pyro-DART setup allows for the acquisition of molecular fingerprints of unidentified plastics, including their additives. The HRMS data acquisition facilitates Kendrick mass defect (KMD) analysis of MS features, recorded with high mass accuracy and high mass resolution. KMD analysis simplifies complex spectra, particularly for polymers characterized by repeated monomer chains that result in distinct KMD homologous groups.32,34,43–48 The thermal desorption of polymer characteristic fragments forms the basis for plastic fingerprinting.35,49 KMD proves invaluable for statistical comparison between HRMS spectra of unknown plastics,50 offering a robust tool for characterizing plastic types.43,44,47,50,51
In this study, we introduce the application of pyro-DART-HRMS through a case study designed to establish a rapid screening method for waste plastic feedstocks. Plastic types are identified through KMDCH2 fingerprinting, allowing for a universal analysis method for majority of hydrocarbon plastic types. This approach includes the development of an initial library of KMDCH2-transformed mass spectra for four common plastics. Subsequently, a robust statistical method employing the Tanimoto Coefficient (TC) is utilized to determine the plastic-type in unknown samples, ensuring a practical approach for similarity calculations, commonly used in chemometrics.52
Experimental section
Samples of plastic materials
Four reference plastics, obtained from Sigma-Aldrich (St. Louis, MO) were selected for use in this study, as outlined in Table 1. Three waste discards from various industrial processes which would be a candidate for recycling, were supplied by Sartorius and Exxon Mobil. An identifier and descriptions are included in Table 1. The selected reference materials include polyethylene, polypropylene, polystyrene, and polyvinyl chloride, which are some of the most prevalent plastic materials, particularly used in packaging.10,53 We also prepared and used mixtures of polyethylene/polystyrene, polypropylene/polystyrene, and polystyrene/Waste A at varying mass fractions to evaluate the sensitivity of polymer detection.pyro-DART-HRMS analysis
Small samples of plastic materials, approximately 1 × 1 mm in size, were placed into disposable copper sample pots. Copper substrates, a thermally conductive metal, are the commercially available substrate specifically designed for pyro-DART analysis, which may allow for the eventual industrial application of this technique. The copper pots were positioned onto the IonRocket™ heating stage (BioChromato Inc., Fujisawa, Kanagawa, Japan) that was interfaced with a DART ionization source (JumpShot®, IonSense Inc., Saugus, MA) and an Orbitrap Q Exactive HF-X high-resolution mass analyzer (Thermo Scientific Inc.). Fig. 1 outlines the schematics of this experimental setup along with the illustrative total ion chromatogram and HRMS spectra averaged over the annotated temperature ranges. The temperature programmable stage was initiated at 50 °C for 0.5 min, followed by a temperature ramp of 100 °C min−1 until reaching 600 °C, and then held at 600 °C for 1 min. The temperature range of 50–600 °C was used as it was previously reported for pyro-DART analysis of polymers,35 and the limit of 600 °C is the highest temperature reachable by our heating system.A T-shaped glass junction suspended between the DART source and the mass spectrometer inlet was installed above the heating stage to facilitate the transport of the evaporated pyrolysis products into the ionization region. Gas-phase pyrolysis products of polymer species were ionized by the metastable He atoms in the DART gas stream set at 200 °C temperature and a flow rate of 2 L min−1. The mass spectrometer was operated at a resolution of m/Δm 240![[thin space (1/6-em)]](https://www.rsc.org/images/entities/char_2009.gif) 000 at 200 m/z and data was acquired within 100–1000 m/z range. The application of positive pyro-(+)DART ionization for plastics produces a series of peaks that differ by the monomer mass and can also yield protonated ions of various polymer fragments of variable lengths. Because of the ambient nature of pyro-DART experiments, HRMS features are complex and correspond to characteristic and complex patterns of oxidized species CxHyOz (M hereafter) resulting from plastic thermal degradation, which can form ion adducts with protons [M + H]+ and ammonium [M + NH4]+.35 Fig. S1† is included to demonstrate the KMD plot of polypropylene and polystyrene analytes with a KMD base of the monomer that composes each polymer. The large homologous series created through this method shows how the fingerprint information of each polymer sample is still preserved through thermal decomposition. The ionization of PVC with pyro-(+)DART does not produce peaks that differ by the monomer because of the HCl elimination during heating.54 However, the observed [M + H]+ and [M + NH4]+ features, primarily reflecting highly unsaturated species with an extensive network of π-bonds, are still characteristic of the PVC analyte.35 In pyro-(−)DART mode, deprotonated ions [M − H]− are formed from oxidized polystyrene fragments, but polyethylene and polypropylene produce additional NO2 adduct ions, [M + NO2]−, previously reported in the literature.35 PVC in negative mode produces very characteristic ions of copper chloride species CuxClx+1−, described later in the text.
000 at 200 m/z and data was acquired within 100–1000 m/z range. The application of positive pyro-(+)DART ionization for plastics produces a series of peaks that differ by the monomer mass and can also yield protonated ions of various polymer fragments of variable lengths. Because of the ambient nature of pyro-DART experiments, HRMS features are complex and correspond to characteristic and complex patterns of oxidized species CxHyOz (M hereafter) resulting from plastic thermal degradation, which can form ion adducts with protons [M + H]+ and ammonium [M + NH4]+.35 Fig. S1† is included to demonstrate the KMD plot of polypropylene and polystyrene analytes with a KMD base of the monomer that composes each polymer. The large homologous series created through this method shows how the fingerprint information of each polymer sample is still preserved through thermal decomposition. The ionization of PVC with pyro-(+)DART does not produce peaks that differ by the monomer because of the HCl elimination during heating.54 However, the observed [M + H]+ and [M + NH4]+ features, primarily reflecting highly unsaturated species with an extensive network of π-bonds, are still characteristic of the PVC analyte.35 In pyro-(−)DART mode, deprotonated ions [M − H]− are formed from oxidized polystyrene fragments, but polyethylene and polypropylene produce additional NO2 adduct ions, [M + NO2]−, previously reported in the literature.35 PVC in negative mode produces very characteristic ions of copper chloride species CuxClx+1−, described later in the text.
HRMS data analysis
The HRMS data was acquired using Thermo Scientific Xcalibur software and the list of the experimental individual mass spectrometric features was extracted using DeconTools Autoprocessor (https://omics.pnl.gov/software/). The background features were identified from the HRMS records acquired at 50 °C. The signal-to-noise threshold for the peak picking process was set to 10 for all experiments and C13 isotopes were removed from the peak list using a custom Excel macros sheet.55 Kendrick mass defect (KMDCH2) grouping of MS features was performed using custom Excel macros that performed background subtracting and two-dimensional CH2–H2 KMD grouping.55,56 Kendrick mass defect analysis groups MS features were based on their KMD values. It simplifies the identification of chemical formulas using normalized m/z values with a standard chemical base, typically CH2. This technique is particularly useful for organic analytes that produce a large number of ions that differ by CH2 mass units, which are common in polymer mass spectra. CH2 is the most frequently used Kendrick base due to its wide applicability to complex organic mixes.57 Due to the commonality of carbon-based polymer backbones, CH2 analysis can be universally applied to most polymer MS spectra without prior knowledge of its structure. Eqn (1) depicts normalization of m/z values with a CH2 base to a Kendrick mass value, KMCH2, and calculation of the corresponding Kendrick mass defect value KMDCH2: | (1) |
| KMDCH2 = nominal mass − KMCH2 | (2) |
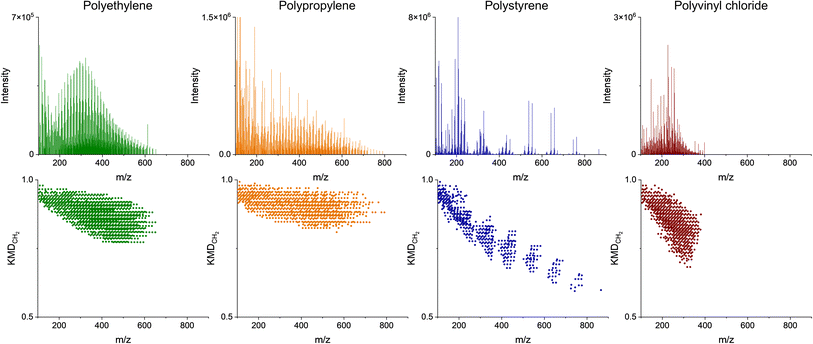
The nominal masses are those obtained by rounding to the nearest integer. Series of homologous MS peaks differ by the number of CH2 units that have identical KMDCH2 which necessitates only one assignment within each of the homologous series.58Fig. 2 depicts the pyro-(+)DART-HRMS spectra of the four plastic reference materials analyzed, as well as their corresponding KMDCH2 plots. The integrated regions were chosen based on the highest intensity section of the thermogram, which is where the plastic undergoes thermal decomposition. The obtained spectra showcase the most characterizing MS features produced during heating with the background signal minimized. Specifically, the integrated regions include 250–550 °C for polyethylene, 225–500 °C for polypropylene, 250–500 °C polystyrene, and 500–550 °C for PVC. Fig. S2† illustrates the pyro-(+)DART-HRMS KMDCH2 plots of the four plastic reference polymers integrated across the following temperature ranges: 100–200 °C, 200–300 °C, 300–400 °C, and 400–500 °C. While these species can be individually assigned, the vast majority (>95%) of the species are comprised of a long KMDCH2 series of 10 or more species. To investigate the variability of ion types detected for the plastic references, formulas were assigned to the representative components of each of these KMDCH2 series. Formula assignments were restricted by +1 ppm error between their theoretical and experimental m/z values and by the following constraints for the elemental composition: 12C ≤ 100, 1H ≤ 200, 14N ≤ 1, 16O ≤ 10, and 35Cl ≤ 1.
Results and discussion
Analysis of reference standards
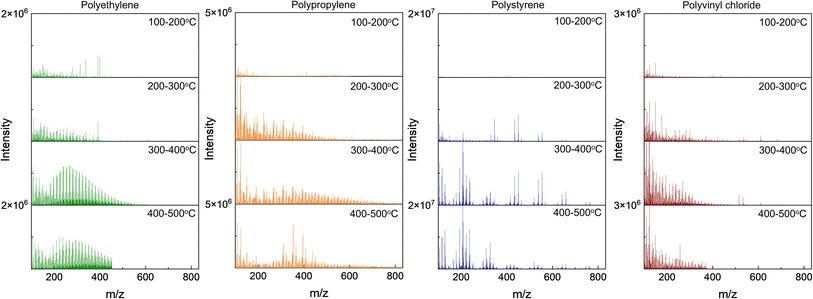
The compositional information provided by the mass spectra and KMDCH2 plots in Fig. 2, combined with the plastic total ion chromatograms (thermograms) in Fig. S3,† provide the temperature-resolved information about the thermal decomposition of plastics. PVC starts to decompose into lower molecular weight compounds at relatively higher temperatures (350–550 °C) than observed for other plastic types. While the dechlorination products can be detected at much lower temperatures (>300 °C) in pyro-(−)DART, as depicted by the rapid increase at 300 °C in the thermograms in Fig. S4,† the high temperatures required to detect thermal decomposition products in positive mode for PVC serve as another indicator for its presence in unknown plastic samples.11 These observations of thermal degradation of PVC are consistent with the literature, as PVC begins dechlorinating at low temperatures (∼300 °C), but the release of hydrocarbon material occurs at much higher temperatures.11 Additionally, the decomposition of PVC occurs in two stages from 250–300 °C and from 350–525 °C which supports the presence of two main groups of peaks found in the positive mode thermograms for PVC as illustrated by Fig. S3.† Analysis of plastics with pyro-DART-HRMS produces mass spectra of gas-phase fragments of thermally degraded plastics. These thermally degraded species are characteristic of PVC samples and can be used to identify the presence of PVC in complex plastic mixtures. As depicted in Fig. 2, the mass spectra of the pure polymer tend to be visually different. Polystyrene appears the most different of the four with evenly separated groups of peaks instead of densely packed peaks that are characteristic of the other polymers. Polypropylene has higher molecular weight species compared to that of the structurally similar polyethylene. While these differences may reflect the average molecular weight differences of the reference materials (polyethylene 4000 Da, polypropylene 12![[thin space (1/6-em)]](https://www.rsc.org/images/entities/char_2009.gif) 000 Da, PVC 48
000 Da, PVC 48![[thin space (1/6-em)]](https://www.rsc.org/images/entities/char_2009.gif) 000 Da, and polystyrene 35
000 Da, and polystyrene 35![[thin space (1/6-em)]](https://www.rsc.org/images/entities/char_2009.gif) 000 Da), it has been previously reported that the species evaporated during thermal decomposition are limited by molecular weight.59 Larger chain fragments remain nonvolatile and will continue to decompose into smaller fragments; this may be an indication of a greater impact of polymer type and thermal degradation mechanism than the average molecular weight of polymers.59
000 Da), it has been previously reported that the species evaporated during thermal decomposition are limited by molecular weight.59 Larger chain fragments remain nonvolatile and will continue to decompose into smaller fragments; this may be an indication of a greater impact of polymer type and thermal degradation mechanism than the average molecular weight of polymers.59
Assessment of temperature-resolved HRMS records provides additional insights into plastic characterization, as depicted in Fig. 3. Different polymer types have different temperatures at which they thermally decompose (pyrolyze), which can provide an additional tool for unknown assignments. For the four reference material polymers in this study, polyethylene begins to degrade thermally (1% decomposed) at 318 °C, polypropylene at 315 °C, polystyrene at 330 °C, and polyvinyl chloride at 184 °C.59 The temperature-resolved decomposition of these reference materials is further illustrated in Fig. S3.† The pyro-DART-HRMS analysis can potentially assist in understanding and modeling thermal degradation reactions. Additionally, it can be used in characterizing and identifying polymer types within complex plastic feedstocks. However, it is important to note that the decomposition of these plastics is monitored by the measurement of evolved and analyzed ions, so in the case of Fig. 3, the decomposition temperature range is limited to species that can be detected in (+)DART.
The polyethylene-assigned KMDCH2 homologous series that contain CHO2−7 species is a result of ambient oxidation of the thermal degradation products. There is also nitrogen present in some of the assigned species, which is likely due to the formation of [M + NH4]+ ion adducts, rather than the presence of nitrogen in the original plastic material.36 Polypropylene-assigned KMDCH2 homologous series are similar to those of polyethylene, with CH and CHO2−5 oxidized species containing minimal presence of ammonium adducts. Polystyrene-assigned KMDCH2 series contain less oxygenated CHO1−3 species and CH species. The higher thermal stability of polystyrene, as shown with decomposition beginning at higher temperatures, is a result of its extensive network of π-bonds that require higher energies for bond breakage.60 Protonated styrene monomer is detected (103.0548 m/z) with this technique, while the protonated monomers of polyethylene and polypropylene were not. PVC fragments, similar to polystyrene, are primarily CH and minimally oxidized CHO1−2 species. The identified species do not contain chlorine and have high double bond equivalent (DBE) values, as HCl is released during thermal decomposition and double π-bonds –CH![[double bond, length as m-dash]](https://www.rsc.org/images/entities/char_e001.gif) CH– are formed.35
CH– are formed.35
Detailed ion assignment can be very time-consuming and not very practical for rapid, high-throughput applications for the identification of plastic types. Alternatively, KMDCH2 plots can be treated as distinctive fingerprints of plastic types, as depicted in Fig. 2, which highlights significant variations from one another. PVC and polystyrene thermal desorption species have lower defect values than polyethylene and polypropylene. Even polyethylene and polypropylene have systematically different KMDCH2 patterns. The variations in both the range and values of KMDCH2 enable the differentiation of plastics solely through their KMDCH2 patterns, without the need to assign individual species. Utilizing KMDCH2 trends for identifying unknown plastics is more straightforward compared to the assessment of individually identified ions. Moreover, this approach reduces the necessity to focus on specific pyrolysis products, which can vary as plastics contain different additives and contaminants.
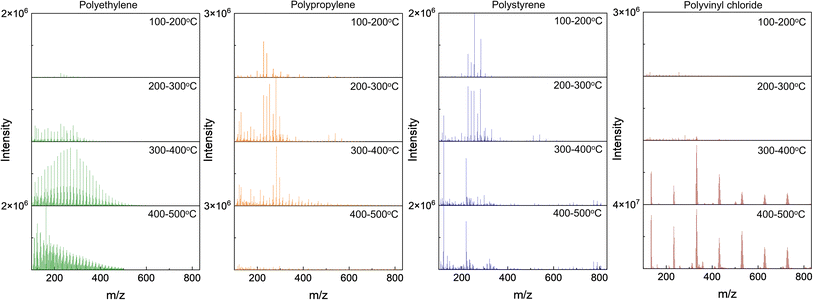
Experiments using pyro-(+)DART-HRMS can provide information about plastic type; however, certain additional information for the polymer characterization can be gleaned from negative mode as well. Fig. 4 depicts the negative mode mass spectra of four plastic reference materials averaged over temperature ranges of 100–200 °C, 200–300 °C, 300–400 °C, and 400–500 °C. Oxidized pyrolysis fragment ions were observed in the negative mode which indicates similar pyrolysis products are detected in both ionization modes as their corresponding adducts. Some of the detected ions are plausibly [M + NO2]− and [M + HCO3]− adducts, as suggested by previously reported (−)DART-MS detection.35 In negative mode, polyethylene fragments display oxygen content of O1–O10, polypropylene fragments of O1–O8, and polystyrene fragments of O1–O13. One significant advantage of the negative mode is the increased number of peaks detected for each plastic reference material: polyethylene (pos 1500 m/z peaks, neg 2187 m/z peaks), polypropylene (pos 1299 m/z peaks, neg 1701 m/z peaks), and polystyrene (pos 829 m/z peaks, neg 928 m/z peaks). The additional peaks observed may be due to stabilization from the formation of [M + O2]− adduct ions.61 Significant differences in negative ionization efficiency are evident compared to positive mode. Species detected at higher desorption temperatures are overall less abundant in negative mode, and several thermally desorbed polystyrene fragment ions also exhibit lower intensity in negative mode. The increase in the number of species detected in negative mode can likely be attributed to carboxylic acids and alcohols formed during the oxidative thermal decomposition of hydrocarbon-polymers,62,63 which are preferentially detected in (−)DART.37,61 In the PVC mass spectra, visually distinct CuxClx+1− peaks are evident. As the detected thermal decomposition species of PVC in negative mode are significantly different from the hydrocarbon products formed from the others polymers, pyro-(−)DART PVC will be discussed separately later in the text.
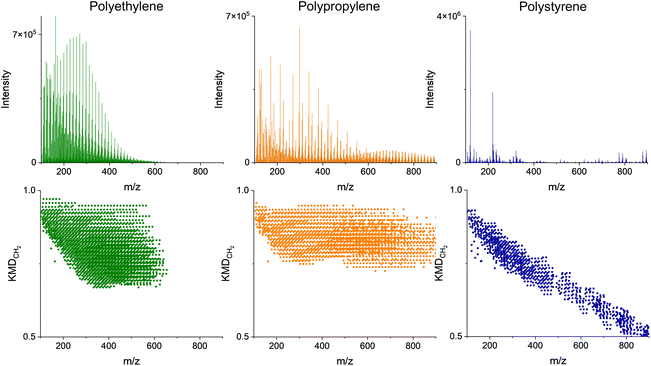
Fig. 5 (top) depicts the pyro-(−)DART high-resolution mass spectra of the four plastic reference materials analyzed. As with positive mode obtained spectra are the spectra integrated for the most intense regions of plastic thermal decomposition for visual simplicity: 250–550 °C for polyethylene, 200–400 °C for polypropylene, and 200–500 °C polystyrene, the corresponding KMDCH2 plots for polyethylene, polypropylene, and polystyrene, as depicted in Fig. 5 (bottom), provide similar information to the pyro-(+)DART plots, with some notable differences. Specifically, the integrated spectra of polypropylene and the transformed KMDCH2 plots reveal the detection of larger m/z species in the negative mode compared to positive mode. This observation is attributed to the detection of larger alkane species in (−)DART through the formation of [M + O2]− ions.61 A similar observation applies to polystyrene, where ions with higher masses are also ionizable, albeit at lower intensities. Despite the lower signal-to-noise ratio (SNR) of these thermal degradation products of hydrocarbon polymers, positive mode remains preferable for identifying complex plastic feedstocks where lower intensity plastic contributors may be present. However, for analyzing high molecular weight thermal decomposition products and pyrolysis mechanisms, negative mode may be necessary. Fig. S5† displays the evolution of KMDCH2 plots with temperature, illustrating the pyro-(−)DART-HRMS analysis results reported for the three plastic reference materials integrated across various temperature ranges: 100–200 °C, 200–300 °C, 300–400 °C, and 400–500 °C.
Analysis of plastic waste samples
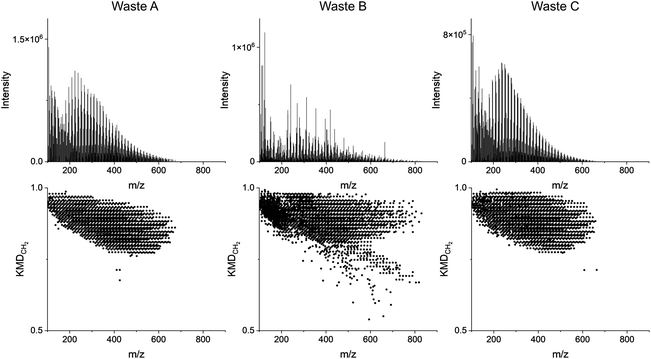
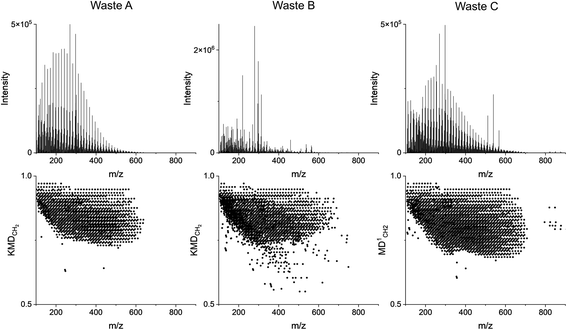
The complexity of plastic waste samples is largely due to the number of detected species (>1000), the heterogeneity of feedstock, and the similarity of spectra of some polymers with similar structures (e.g. polyethylene versus polypropylene). It may require additional analysis steps to simplify and retrieve practical information about the unknown plastic samples. The species detected through pyro-DART-HRMS analysis arise from the thermal decomposition and oxidation of the plastic samples. Given the complex mechanisms involved, certain species may appear in the pyro-DART spectrum for multiple plastic types. Consequently, distinguishing which products correspond to a particular monomer type or identifying unknown plastic analytes based on specific m/z values can be challenging. Moreover, the presence of additives and distinct functional groups is also reflected in their mass spectra, leading to additional variations in m/z values. KMDCH2 grouping simplifies this polymer complexity by grouping homologous compounds and visually identifying only related species. Through KMDCH2 grouping, these species can be easily identified and assigned, providing additional information about pyrolysis and ionization mechanisms.The KMDCH2 transformation for detected HRMS features can also be performed for unknown plastic samples. With unknown samples, the enhanced capability of KMDCH2 over monomer-specific KMD was observed. KMDCH2 allows for the fingerprinting of plastic type without having prior knowledge of monomer type or the need for testing many different KMD bases. It also allows for the KMDCH2 grouping with heterogenous plastic feedstocks. In this study, three feedstocks were tested; they were identified as Waste A, Waste B, and Waste C. Waste A was known to be a polyethylene-based sample. Waste B and Waste C were unknown plastic samples that may contain mixed plastic types. Fig. 6 depicts the integrated pyro-(+)DART-HRMS mass spectra and KMDCH2 plots of the three plastic waste samples. HRMS record for Waste A is integrated over 230–430 °C, Waste B 150–500 °C, and Waste C 150–500 °C. These temperatures capture the highest intensity regions where the plastic fragments desorb. Fig. S6 and S7† depict the mass spectra and KMDCH2 plots for the three waste samples acquired at increasing temperatures. The KMDCH2 plot of Waste A is visually similar to polyethylene which demonstrates the ability to compare plastic type through KMDCH2 fingerprinting. The KMDCH2 plot of Waste B appears more complex than Waste A and Waste C. Waste B may contain more than one type of plastic, as indicated by the two sections of KMDCH2 series. One series of peaks with higher KMDCH2 values appears visually similar to polypropylene, and there is also a series of KMDCH2 peaks with a lower mass defect that is aliased. While these species may be polystyrene-related because our study was limited to only four plastic reference materials, the identification of unknowns could be improved by expanding our library by running additional known plastic types by pyro-DART-HRMS. The KMDCH2 plot of Waste B also indicates more species not grouped into long homologous series. These species may be related to additives or contamination present in plastic waste that may or may not be incorporated into the polymer backbone. The KMDCH2 plot of Waste C appears similar to both polyethylene and polypropylene with slightly higher KMDCH2 values compared to Waste A, indicating the challenges with differentiating between plastic types without an objective method of comparison. Additionally, it should be noted that wastes in industrial streams can be more complex than these types, as these are mostly one polymer type and with few contaminants.
Fig. 7 presents the integrated pyro-(−)DART mass spectra and KMDCH2 plots of the three plastic waste samples. The integrated region matches that of the pyro-(+)DART mass spectra. Waste A is integrated over 230–430 °C, Waste B over 150–500 °C, and Waste C over 150–500 °C temperature ranges. Fig. S8 and S9† display the mass spectra and KMDCH2 plots for the three waste samples acquired at increasing temperatures.
Statistical analysis
We developed a statistical analysis of KMDCH2-grouped plastic spectra that established a more objective comparison, which greatly enhanced the ability to assess the identity of the unknown plastic waste. The statistical method is based on the calculations of the Tanimoto Coefficient (TC), a common but highly applicable comparison index used in chemometrics.52 This method is complementary to previously studied approaches such as PCA17,34 and is less computationally intensive. Additionally, it allows for the de-emphasis of comparing individual peaks, as the spectra are compared based on large homologous series. Instead, it highlights the evaluation of similarity among longer homologous series, placing greater emphasis on species that are indicative of the polymer backbone. The TC is the ratio of the intersection of two features A and B to the union of them as shown in eqn (3): | (3) |
For each specific KMDCH2 value, the TC for the KMDCH2 homologous series is determined across all plastic types in the library and the unknown. First, the intensity of all the m/z values in the KMDCH2 series of the unknown is normalized, in order to accommodate for varying intensities in signal and in initial sample mass, and the m/z are binned into sets of m/z with a tolerance of 0.001. Finally, each m/z bin is compared with the other m/z bins in the library. The maximum value in each m/z bin for the unknown and the standard is the union value, as it represents the maximum intensity that is present in that m/z region while the minimum value in the bin is the intersection value, as it represents the lowest intensity or null intensity present. This comparison allows us to integrate the heights of the normalized intensities as a method of mathematical comparison. A more detailed description of this process for a single homologous series is in the ESI in Appendix A.†
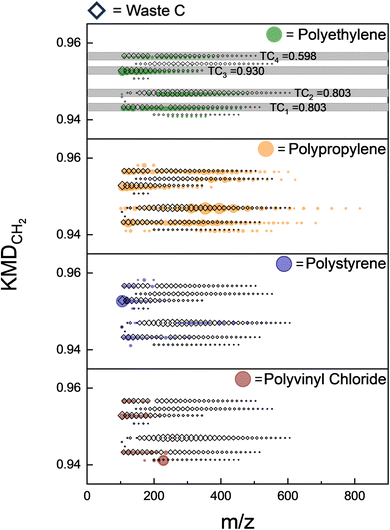
The TCi values are calculated for each homologous series i as defined by the distinct KMDCH2 values and compared to the corresponding records of unknown waste with reference materials. KMDCH2 series that contain at least 3 species are considered for the TCi calculation. This process produces TCi values of 0–1, where higher numbers indicate greater similarity with a given reference material. Fig. 8 depicts the visual process of this calculation by showing the overlap of a few KMDCH2 homologous series in just a small region of the total KMDCH2 space with the plastic reference material series from the selected region of KMDCH2 displayed. The final statistical value includes the summation of these TCi values as well as the rest of the KMDCH2 space. These individual TCi values for each unknown to plastic reference material comparison are then combined by calculating a weighted average of the TCi values based on their intensity as shown in eqn(4):
 | (4) |
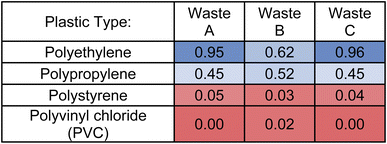
Using TCi quantitative metrics, the three plastic waste samples were compared against the four plastic reference materials. Table 2 illustrates the results of these statistical evaluations, showing the close similarity of Waste samples A and C to polyethylene with TC scores greater than 0.80. Waste B is the most visually complex sample when transformed with KMDCH2 and indicates that there is more than one plastic type present. It is similarly comparable to polypropylene and polyethylene (TC = 0.62 vs. 0.52), but these values are much lower than with Waste A and C illustrating the potential limitations of this statistical method when used with mixed plastics. Upon comparison of the three selected waste samples with polystyrene and PVC using this method, low TCi < 0.05 scores were observed. These scores suggest that the pyro-DART-HRMS data of these samples are dissimilar to those of the reference materials, indicating that they are unlikely to be composed of polystyrene or PVC plastic types. Based on this statistical scoring, we conclude that Waste A and Waste C likely contain a high amount of polyethylene.
The TC statistical analysis was conducted for the negative mode data recorded for waste plastic samples and summarized in Table 3, excluding PVC, in which non-hydrocarbon species are detected exclusively in negative mode. The statistical analysis of yielded results consistent with the positive mode data summarized above, in Table 2. Specifically, Waste A and Waste C exhibit high similarity coefficients with polyethylene (TC = 0.78–0.82), and Waste B displays a lower degree of similarity with all plastic types, potentially due to a mixed plastic composition. None of the three plastics exhibited similarity with polystyrene (TC < 0.05), indicating their absence in the plastic waste samples. However, a larger tolerance was required for the negative mode analysis to maximize the similarity coefficients of the known Waste A sample compared to positive mode (KMDCH2 value of 0.002 versus 0.001) moreover, due to the formation of CuxClx+1− clusters upon PVC thermal decomposition, long KMDCH2 series are absent in the negative mode data for this plastic, leading to an inability to compare with PVC. Therefore, the comparison method with pyro-(+)DART, rather than pyro-(−)DART, serves as the more comprehensive and focused tool for evaluating plastic types.
Through this method, we can identify the plastic type of unknown waste feedstocks of one primary contributor, though it is more difficult to classify mixed waste feedstocks. Fig. S10–S12 and Tables S1–S3† illustrate the use of this statistical method for analysis of laboratory-prepared mixtures of polyethylene/polystyrene, polypropylene/polystyrene, and polystyrene/Waste A at varying mass fractions, performed to evaluate the technique's sensitivity Quantitative assignment of plastic type in these cases is much more challenging, and the comparison scores with the current method are much lower than for single component samples. Expansion of the statistical analysis to decouple overlapping KMDCH2 would be required to analyze mixed samples. However, visually, the presence of both polymers in Fig. S10–S12,† indicating that pyro-DART-HRMS detection is still sensitive to mixtures of <%30 polymer type, despite statistical limitations. Despite this consideration, this method may allow for the comprehensive determination of single component polymer waste samples for screening and recycling purposes.
Additional capabilities include straightforward differentiation between polyethylene and polypropylene waste, despite their visual similarities in KMDCH2 plots and structural resemblances. This distinction is evidenced by the differing similarity scores concerning polyethylene and polypropylene observed for Waste A and Waste C samples. The method will need to be expanded to include the ability to evaluate more complex mixed plastic samples with multiple high-concentration polymer types present. This will require a more extensive computation, as the KMDCH2 plots may contain overlapping CH2 series. However, there will be characteristic CH2 series for all plastic types present in the sample. For the broader application of this method, a more comprehensive library of pyro-DART-HRMS spectra will need to be constructed containing more types of industrial plastics.
Detection of chlorine content in PVC
Fig. 9 shows the pyro-(−)DART high-resolution mass spectra KMDCH2 of PVC integrated from 300–600 °C. Notably, the PVC KMDCH2 pattern demonstrates strong aliasing, as the primary species do not contain carbon atoms, serving as an indication that these peaks are carbon-free. Halogen species are common additives that react during thermal desorption and may lead to a decreased quality in recycled product(s) and form potentially hazardous intermediate compounds. These species are better suited for (−)DART-MS.47,64,65 Negative mode analysis of PVC provides more extensive information due to its chlorine content. The PVC spectra presented in Fig. 4 show clusters of characteristic CuxClx+1− (x = 1–7) ions, appearing at >300 °C, with a separation of 97.8984 m/z between the peaks containing the same Cl isotopes. The isotopic distributions of CuxClx+1− ion groups separated by 1.9971 m/z confirm they contain 35Cl and 37Cl isotopes, as delineated in Fig. S13.† Fig. S14† depicts the comparison of one of these isotope distributions (CuCl2) with a predicted isotope distribution.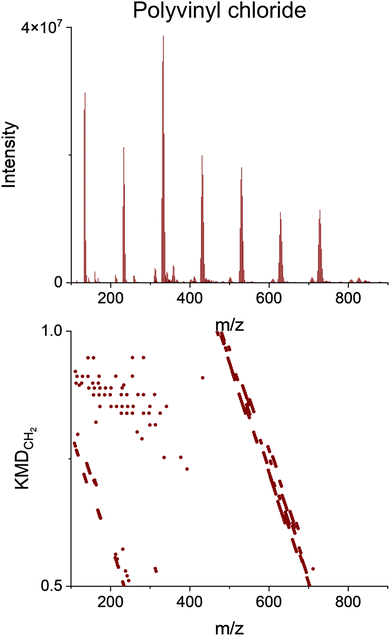 | ||
| Fig. 9 Upper panel: HRMS spectra of PVC obtained from integrated pyro-(−)DART thermograms. Lower panel: CH2-based Kendrick mass defect (KMDCH2) plots. | ||
These species exhibit high intensity and are associated with the presence of PVC in the feedstock. Formed through the reaction of copper substrate with HCl released from PVC pyrolysis, the appearance of these species has been previously documented at high temperatures with the presence of oxidized copper and HCl.66 However, to our knowledge, our reported results mark the first instance of their observations in pyro-DART analysis, along with the specific temperature range of their appearance. The abundant appearance and direct correlation of these species with the pyrolysis of PVC render them valuable indicators of plastic feedstocks with high chlorine content, which can make chemical recycling more difficult and would benefit from prompt identification.67 Additionally, since many chlorine-containing compounds release HCl upon heating, it suggests that the formation of copper chloride species in (−)DART analysis could potentially serve as a method of quantifying chlorine presence in the plastic sample.68 However, further analysis will require the testing of other types of chlorinated plastic to ensure the applicability of this method.
Applications to recycling and future outlook
We highlighted the application of pyro-DART-HRMS for characterizing plastic types that may improve the effectiveness of waste plastic sorting for the recycling industry. We utilized KMDCH2 metrics to develop fingerprints of polymer types and determine the identity of unknown single-component plastic wastes. The statistical TC comparison method allows for an objective, score-based detection of similarity between unknown plastics and reference materials. The methodology can be further improved, including expanding the library of plastic reference materials and developing comparison methods to accommodate the characterization of more complex samples of mixed plastic waste, including those with multiple polymer types and varying levels of contamination. This study focuses on selected examples of complex industrial wastes, which while complex and an important candidate for recycling, have not had significant environmental exposure. Though the impact of surface-level contaminants should be minimized through our application of CH2 grouping to place higher priority on long homologous series related to the polymer backbone, it is necessary to perform further testing on more weathered plastic wastes, which have undergone increased degradation.Through the pyro-(±)DART-HRMS approach, the material composition of unknown plastic streams can be determined with minimal sample preparation, at ambient pressure, and characterized using a robust statistic method. This technique allows for the analysis of a sizable plastic chip at once, consuming the entirety of the loaded sample and mitigating concerns about probing inhomogeneous analyte. Additionally, temperature-resolved information enhances plastic characterization. Experiments using pyro-(−)DART-HRMS can also generate prominent, identifiable copper chloride ions, facilitating rapid identification of chlorine in plastic streams. This information is critical as high chlorine content can affect recyclability and necessitates additional engineering measures to minimize human exposure and prevent the environmental release of HCl. Further research is recommended to explore the broader range of information that pyro-DART-HRMS can provide for characterizing plastic waste, including the potential for quantifying chlorine content through the formation of copper chloride ions. Additionally, HRMS data can be further utilized for analogous KMD groupings and statistical analysis for polymers containing additional elements (O, F, Si).57
The ability to swiftly identify plastic types using this method can help sort waste plastics. Integrating high-throughput pyro-DART-HRMS techniques into the sorting of plastic waste based on its chemical type can provide the quick data needed to improve the efficiency of the sorting process, which may allow for more economically-viable recycling and a move towards a plastic circular economy.
Data availability
Data for this article, including all m/z values, intensity, KMDCH2 values and code used are available at Purdue University Research Repository at https://purr.purdue.edu/projects/plasticdartms/files. A more detailed read me file is also available in the Repository discussing the data provided.Author contributions
E. H. and A. L designed the experiments and overall project framework. E. H., L. H., and C. P. W. conducted experiments. E. H. and Y. L. analyzed data. W. K. and A. M. assisted with data interpretation. E. H. and A. L. wrote the manuscript with contributions from all coauthors.Conflicts of interest
The authors declare that they have no conflict of interest.Acknowledgements
This work was supported by the National Science Foundation through Industry-University Cooperative Research Center for Bioanalytic Metrology under Grant No. IIP-1916691 and by industry partners. We also thank anonymous reviewers for their thoughtful and constructive comments in revision.References
- I. Vollmer, M. J. F. Jenks, M. C. P. Roelands, R. J. White, T. van Harmelen, P. de Wild, G. P. van der Laan, F. Meirer, J. T. F. Keurentjes and B. M. Weckhuysen, Beyond Mechanical Recycling: Giving New Life to Plastic Waste, Angew. Chem., Int. Ed., 2020, 59(36), 15402–15423, DOI:10.1002/anie.201915651.
- M. G. Davidson, R. A. Furlong and M. C. McManus, Developments in the Life Cycle Assessment of Chemical Recycling of Plastic Waste – A Review, J. Cleaner Prod., 2021, 293, 126163, DOI:10.1016/j.jclepro.2021.126163.
- J. Jiang, K. Shi, X. Zhang, K. Yu, H. Zhang, J. He, Y. Ju and J. Liu, From Plastic Waste to Wealth Using Chemical Recycling: A Review, J. Environ. Chem. Eng., 2022, 10(1), 106867, DOI:10.1016/j.jece.2021.106867.
- OECD, Global Plastics Outlook, 2022, https://www.oecd-ilibrary.org/content/publication/de747aef-en.
- J.-P. Lange, Managing Plastic Waste-Sorting, Recycling, Disposal, and Product Redesign, ACS Sustainable Chem. Eng., 2021, 9(47), 15722–15738, DOI:10.1021/acssuschemeng.1c05013.
- J. Hopewell, R. Dvorak and E. Kosior, Plastics Recycling: Challenges and Opportunities, Philos. Trans. R. Soc., B, 2009, 364(1526), 2115–2126, DOI:10.1098/rstb.2008.0311.
- UNEA Resolution 5/14 Entitled “End Plastic Pollution: Towards an International Legally Binding Instrument”, United Nations: Dakar, Senegal, 2022, pp 1–5, https://www.unep.org/inc-plastic-pollution.
- S. S. Foundation, National Geographic Smart Plastics Guide, Natl. Geogr., 2018, 1–2 Search PubMed.
- M. Bolgar, J. Hubball, J. Groeger, and S. Meronek, Handbook for the Chemical Analysis of Plastic and Polymer Additives, CRC Press, Boca Raton, 2nd edn, 2016 Search PubMed.
- Z. O. G. Schyns and M. P. Shaver, Mechanical Recycling of Packaging Plastics: A Review, Macromol. Rapid Commun., 2021, 42(3), 1–27, DOI:10.1002/marc.202000415.
- J. Yu, L. Sun, C. Ma, Y. Qiao and H. Yao, Thermal Degradation of PVC: A Review, Waste Manage., 2016, 48, 300–314, DOI:10.1016/j.wasman.2015.11.041.
- M. I. Jahirul, M. G. Rasul, D. Schaller, M. M. K. Khan, M. M. Hasan and M. A. Hazrat, Transport Fuel from Waste Plastics Pyrolysis – A Review on Technologies, Challenges and Opportunities, Energy Convers. Manage., 2022, 258, 115451, DOI:10.1016/j.enconman.2022.115451.
- C. Mans, S. Hanning, C. Simons, A. Wegner, A. Janβen and M. Kreyenschmidt, Development of Suitable Plastic Standards for X-Ray Fluorescence Analysis, Spectrochim. Acta, Part B, 2007, 62(2), 116–122, DOI:10.1016/j.sab.2007.02.001.
- Q. Zeng, J.-B. Sirven, J.-C. P. Gabriel, C. Y. Tay and J.-M. Lee, Laser Induced Breakdown Spectroscopy for Plastic Analysis, TrAC, Trends Anal. Chem., 2021, 140, 116280, DOI:10.1016/j.trac.2021.116280.
- Q. Wang, X. Wu, L. Chen, Z. Yang and Z. Fang, Plastic Classification with X-Ray Absorption Spectroscopy Based on Back Propagation Neural Network, Appl. Spectrosc., 2017, 71(11), 2538–2548, DOI:10.1177/0003702817706921.
- J. Logemann, E. Oveland, Ø. Bjorøy, w peters, C. Cojocariu and T. Kögel, Pyrolysis-GC-Orbitrap MS – a Powerful Analytical Tool for Identification and Quantification of Microplastics in a Biological Matrix, ThermoFisher Scientific, 2018 Search PubMed.
- X. Zhang, A. Mell, F. Li, C. Thaysen, B. Musselman, J. Tice, D. Vukovic, C. Rochman, P. A. Helm and K. J. Jobst, Rapid Fingerprinting of Source and Environmental Microplastics Using Direct Analysis in Real Time-High Resolution Mass Spectrometry, Anal. Chim. Acta, 2020, 1100, 107–117, DOI:10.1016/j.aca.2019.12.005.
- M. Maric and C. Bridge, Characterizing and Classifying Water-Based Lubricants Using Direct Analysis in Real Time®-time of Flight Mass Spectrometry, Forensic Sci. Int., 2016, 266, 73–79, DOI:10.1016/j.forsciint.2016.04.036.
- T. A. Zughaibi and R. R. Steiner, Differentiating Nylons Using Direct Analysis in Real Time Coupled to an AccuTOF Time-of-Flight Mass Spectrometer, J. Am. Soc. Mass Spectrom., 2020, 31(4), 982–985, DOI:10.1021/jasms.0c00051.
- L. Nagy, T. Nagy, G. Deák, Á. Kuki, B. Antal, M. Zsuga and S. Kéki, Direct Analysis in Real Time Mass Spectrometry (DART-MS) of Highly Non-Polar Low Molecular Weight Polyisobutylenes, J. Mass Spectrom., 2015, 50(9), 1071–1078, DOI:10.1002/jms.3621.
- K. Fouyer, O. Lavastre and D. Rondeau, Direct Monitoring of the Role Played by a Stabilizer in a Solid Sample of Polymer Using Direct Analysis in Real Time Mass Spectrometry: The Case of Irgafos 168 in Polyethylene, Anal. Chem., 2012, 84(20), 8642–8649, DOI:10.1021/ac301759q.
- T. A. Zughaibi and R. R. Steiner, Forensic Analysis of Polymeric Carpet Fibers Using Direct Analysis in Real Time Coupled to an Accutof™ Mass Spectrometer, Polymers, 2021, 13(16), 2687, DOI:10.3390/polym13162687.
- O. Black, R. Cody, D. Edwards and J. V. Cizdziel, Identification of Polymers and Organic Gunshot Residue in Evidence from 3D-Printed Firearms Using DART-Mass Spectrometry: A Feasibility Study, Forensic Chem., 2017, 5, 26–32, DOI:10.1016/j.forc.2017.05.003.
- M. M. Alshehri, Z. A. Alothman, A. Y. Bedjah Hadj Ahmed and T. Aouak, New Method Based on Direct Analysis in Real-Time Coupled with Time-of-Flight Mass Spectrometry (DART-ToF-MS) for Investigation of the Miscibility of Polymer Blends, Polymers, 2022, 14(9), 1644–1664, DOI:10.3390/polym14091644.
- Y. Abe, L. K. Ackerman, M. Mutsuga, K. Sato and T. H. Begley, Rapid Identification of Polyamides Using Direct Analysis in Real Time Mass Spectrometry, Rapid Commun. Mass Spectrom., 2020, 34(S2), e8707, DOI:10.1002/rcm.8707.
- M. Haunschmidt, C. W. Klampfl, W. Buchberger and R. Hertsens, Rapid Identification of Stabilisers in Polypropylene Using Time-of-Flight Mass Spectrometry and DART as Ion Source, Analyst, 2010, 135(1), 80–85, 10.1039/b911040b.
- L. K. Ackerman, G. O. Noonan and T. H. Begley, Assessing Direct Analysis in Real-Time-Mass Spectrometry (DART-MS) for the Rapid Identification of Additives in Food Packaging, Food Addit. Contam.,:Part A, 2009, 26(12), 1611–1618, DOI:10.1080/02652030903232753.
- R. Paseiro-Cerrato, L. Ackerman, L. de Jager and T. Begley, Brominated Flame Retardants (BFRs) in Contaminated Food Contact Articles: Identification Using DART-HRMS and GC-MS, Food Addit. Contam.,:Part A, 2021, 38(2), 350–359, DOI:10.1080/19440049.2020.1853250.
- M. Wu, H. Wang, G. Dong, B. D. Musselman, C. C. Liu and Y. Guo, Combination of Solid-Phase Micro-Extraction and Direct Analysis in Real Time-Fourier Transform Ion Cyclotron Resonance Mass Spectrometry for Sensitive and Rapid Analysis of 15 Phthalate Plasticizers in Beverages, Chin. J. Chem., 2015, 33(2), 213–219, DOI:10.1002/cjoc.201400564.
- T. Rothenbacher and W. Schwack, Rapid and Nondestructive Analysis of Phthalic Acid Esters in Toys Made of Polyvinyl Chloride by Direct Analysis in Real Time Single-Quadrupole Mass Spectrometry, Rapid Commun. Mass Spectrom., 2009, 23(17), 2829–2835, DOI:10.1002/rcm.4194.
- T. Rothenbacher and W. Schwack, Rapid Identification of Additives in Poly(Vinyl Chloride) Lid Gaskets by Direct Analysis in Real Time Ionisation and Single-Quadrupole Mass Spectrometry, Rapid Commun. Mass Spectrom., 2010, 24(1), 21–29, DOI:10.1002/rcm.4350.
- M. C. Bridoux and X. Machuron-Mandard, Capabilities and Limitations of Direct Analysis in Real Time Orbitrap Mass Spectrometry and Tandem Mass Spectrometry for the Analysis of Synthetic and Natural Polymers, Rapid Commun. Mass Spectrom., 2013, 27(18), 2057–2070, DOI:10.1002/rcm.6664.
- E. S. Chernetsova, G. E. Morlock and I. A. Revelsky, DART Mass Spectrometry and Its Applications in Chemical Analysis, Russ. Chem. Rev., 2011, 80(3), 235–255, DOI:10.1070/rc2011v080n03abeh004194.
- T. P. Forbes, J. M. Pettibone, E. Windsor, J. M. Conny and R. A. Fletcher, Rapid Chemical Screening of Microplastics and Nanoplastics by Thermal Desorption and Pyrolysis Mass Spectrometry with Unsupervised Fuzzy Clustering, Anal. Chem., 2023, 95(33), 12373–12382, DOI:10.1021/acs.analchem.3c01897.
- R. B. Cody, T. N. J. Fouquet and C. Takei, Thermal Desorption and Pyrolysis Direct Analysis in Real Time Mass Spectrometry for Qualitative Characterization of Polymers and Polymer Additives, Rapid Commun. Mass Spectrom., 2020, 34(S2), 1–9, DOI:10.1002/rcm.8687.
- K. Sekimoto, Direct Analysis in Real Time; Ambient Ionization Mass Spectrometry in Life Sciences: Principles and Applications, Elsevier Inc., 2019, p 75, DOI:10.1016/B978-0-12-817220-9.00002-3.
- J. H. Gross, Direct Analysis in Real Time-a Critical Review on DART-MS, Anal. Bioanal. Chem., 2014, 406(1), 63–80, DOI:10.1007/s00216-013-7316-0.
- C. P. West, H. M. Brown and P. W. Fedick, Molecular Characterization of the Thermal Degradation of Per- and Polyfluoroalkyl Substances in Aqueous Film-Forming Foams via Temperature-Programmed Thermal Desorption–Pyrolysis–Direct Analysis in Real Time–Mass Spectrometry, Environ. Sci. Technol. Lett., 2023, 10(4), 308–315, DOI:10.1021/acs.estlett.3c00064.
- C. P. West, Y.-J. Hsu, K. T. MacFeely, S. M. Huston, B. P. Aridjis-Olivos, A. C. Morales and A. Laskin, Volatility Measurements of Individual Components in Organic Aerosol Mixtures Using Temperature-Programmed Desorption–Direct Analysis in Real Time–High Resolution Mass Spectrometry, Anal. Chem., 2023, 95(19), 7403–7408, DOI:10.1021/acs.analchem.3c00923.
- G. P. Ashton, L. P. Harding, G. M. B. Parkes and S. E. Pownall, Application of Hot-Stage Microscopy Direct Analysis in Real Time Mass Spectrometry (HDM) to the Analysis of Polymers, Rapid Commun. Mass Spectrom., 2021, 35(S2), e8522, DOI:10.1002/rcm.8522.
- G. P. Ashton, L. P. Harding and G. M. B. Parkes, An Integrated Hot-Stage Microscope-Direct Analysis in Real Time-Mass Spectrometry System for Studying the Thermal Behavior of Materials, Anal. Chem., 2017, 89(24), 13466–13471, DOI:10.1021/acs.analchem.7b03743.
- B. N. Peterson, A. C. Morales, J. M. Tomlin, C. G. W. Gorman, P. E. Christ, S. A. L. Sharpe, S. M. Huston, F. A. Rivera-Adorno, B. T. O'Callahan, M. Fraund, Y. Noh, P. Pahari, A. J. Whelton, P. Z. El-Khoury, R. C. Moffet, A. Zelenyuk and A. Laskin, Chemical Characterization of Microplastic Particles Formed in Airborne Waste Discharged from Sewer Pipe Repairs, Environ. Sci.: Processes Impacts, 2023, 25(10), 1718–1731, 10.1039/D3EM00193H.
- T. Fouquet and H. Sato, Extension of the Kendrick Mass Defect Analysis of Homopolymers to Low Resolution and High Mass Range Mass Spectra Using Fractional Base Units, Anal. Chem., 2017, 89(5), 2682–2686, DOI:10.1021/acs.analchem.6b05136.
- I. K. Dimzon, X. Trier, T. Frömel, R. Helmus, T. P. Knepper and P. de Voogt, High Resolution Mass Spectrometry of Polyfluorinated Polyether-Based Formulation, J. Am. Soc. Mass Spectrom., 2016, 27(2), 309–318, DOI:10.1007/s13361-015-1269-9.
- R. B. Cody and T. Fouquet, “reverse Kendrick Mass Defect Analysis”: Rotating Mass Defect Graphs to Determine Oligomer Compositions for Homopolymers, Anal. Chem., 2018, 90(21), 12854–12860, DOI:10.1021/acs.analchem.8b03413.
- T. N. J. Fouquet, The Kendrick Analysis for Polymer Mass Spectrometry, J. Mass Spectrom., 2019, 54(12), 933–947, DOI:10.1002/jms.4480.
- A. L. Myers, K. J. Jobst, S. A. Mabury and E. J. Reiner, Using Mass Defect Plots as a Discovery Tool to Identify Novel Fluoropolymer Thermal Decomposition Products, J. Mass Spectrom., 2014, 49(4), 291–296, DOI:10.1002/jms.3340.
- T. Fouquet and H. Sato, Improving the Resolution of Kendrick Mass Defect Analysis for Polymer Ions with Fractional Base Units, Mass Spectrom., 2017, 6(1), A0055, DOI:10.5702/massspectrometry.A0055.
- N. Alawani, C. Barrère-Mangote and C. Wesdemiotis, Analysis of Thermoplastic Copolymers by Mild Thermal Degradation Coupled to Ion Mobility Mass Spectrometry, Macromol. Rapid Commun., 2022, 44(1), 2200306, DOI:10.1002/marc.202200306.
- G. Gaiffe, R. B. Cole, A. Sonnette, N. Floch and M. C. Bridoux, Identification of Postblast Residues by DART-High Resolution Mass Spectrometry Combined with Multivariate Statistical Analysis of the Kendrick Mass Defect, Anal. Chem., 2019, 91(13), 8093–8100, DOI:10.1021/acs.analchem.9b00137.
- R. Watanabe, S. Nakamura, A. Sugahara, M. Kishi, H. Sato, H. Hagihara and H. Shinzawa, Revealing Molecular-Scale Structural Changes in Polymer Nanocomposites during Thermo-Oxidative Degradation Using Evolved Gas Analysis with High-Resolution Time-of-Flight Mass Spectrometry Combined with Principal Component Analysis and Kendrick Mass Defect Analysis, Anal. Chem., 2024, 96(6), 2628–2636, DOI:10.1021/acs.analchem.3c05269.
- D. Bajusz, A. Rácz and K. Héberger, Why Is Tanimoto Index an Appropriate Choice for Fingerprint-Based Similarity Calculations?, J. Cheminf., 2015, 7(1), 1–13, DOI:10.1186/s13321-015-0069-3.
- N. Singh, D. Hui, R. Singh, I. P. S. Ahuja, L. Feo and F. Fraternali, Recycling of Plastic Solid Waste: A State of Art Review and Future Applications, Composites, Part B, 2017, 115, 409–422, DOI:10.1016/j.compositesb.2016.09.013.
- Q. Sun, X. Shi, Y. Lin, H. Zhu, X. Wang, C. Cheng and J. Liu, Thermogravimetric-Mass Spectrometric Study of the Pyrolysis Behavior of PVC, J. China Univ. Min. Technol., 2007, 17(2), 242–245 CrossRef CAS.
- P. J. Roach, J. Laskin and A. Laskin, Higher-Order Mass Defect Analysis for Mass Spectra of Complex Organic Mixtures, Anal. Chem., 2011, 83(12), 4924–4929, DOI:10.1021/ac200654j.
- J. Laskin, A. Laskin, P. J. Roach, G. W. Slysz, G. A. Anderson, S. A. Nizkorodov, D. L. Bones and L. Q. Nguyen, High-Resolution Desorption Electrospray Ionization Mass Spectrometry for Chemical Characterization of Organic Aerosols, Anal. Chem., 2010, 82(5), 2048–2058, DOI:10.1021/ac902801f.
- S. Merel, Critical Assessment of the Kendrick Mass Defect Analysis as an Innovative Approach to Process High Resolution Mass Spectrometry Data for Environmental Applications, Chemosphere, 2023, 313, 137443, DOI:10.1016/j.chemosphere.2022.137443.
- M. L. Walser, Y. Desyaterik, J. Laskin, A. Laskin and S. A. Nizkorodov, High-Resolution Mass Spectrometric Analysis of Secondary Organic Aerosol Produced by Ozonation of Limonene, Phys. Chem. Chem. Phys., 2008, 10(7), 1009–1022, 10.1039/B712620D.
- C. L. Beyler, and M. M. Hirschler, Thermal Decomposition of Polymers, In SFPE Handbook of Fire Protection Engineering 2, 2002; pp pp 111–131 Search PubMed.
- J. L. Gurman, L. Baier and B. C. Levin, Polystyrenes: A Review of the Literature on the Products of Thermal Decomposition and Toxicity, Fire Mater., 1987, 11, 109–130 CrossRef CAS.
- R. B. Cody and A. J. Dane, Soft Ionization of Saturated Hydrocarbons, Alcohols and Nonpolar Compounds by Negative-Ion Direct Analysis in Real-Time Mass Spectrometry, J. Am. Soc. Mass Spectrom., 2013, 24(3), 329–334, DOI:10.1007/s13361-012-0569-6.
- F. Gugumus, Physico-Chemical Aspects of Polyethylene Processing in an Open Mixer. Part 17. Effect of Oxygen Availability, Polym. Degrad. Stab., 2006, 91(2), 324–338, DOI:10.1016/j.polymdegradstab.2005.04.045.
- F. Gugumus, Physico-Chemical Aspects of Polyethylene Processing in an Open Mixer. Part 9: Complements to the Experimental Kinetics of Oxidation Product Formation, Polym. Degrad. Stab., 2005, 87(2), 231–243, DOI:10.1016/j.polymdegradstab.2004.08.010.
- M. Paci and F. P. La Mantia, Influence of Small Amounts of Polyvinylchloride on the Recycling of Polyethyleneterephthalate, Polym. Degrad. Stab., 1999, 63(1), 11–14, DOI:10.1016/S0141-3910(98)00053-6.
- R. Figi, P. Lienemann and P. Richner, Determination of Traces of Fluorine, Chlorine, Bromine, Cadmium and Lead in Plastic Materials, Toxicol. Environ. Chem., 1995, 52(1–4), 35–44, DOI:10.1080/02772249509358247.
- M. Hargittai, P. Schwerdtfeger, B. Réffy and R. Brown, The Molecular Structure of Different Species of Cuprous Chloride from Gas-Phase Electron Diffraction and Quantum Chemical Calculations, Chem.—Eur. J., 2003, 9(1), 327–333, DOI:10.1002/chem.200390027.
- S. Kumagai, A. Matsukami, F. Kabashima, M. Sakurai, M. Kanai, T. Kameda, Y. Saito and T. Yoshioka, Combining Pyrolysis–Two-Dimensional Gas Chromatography–Time-of-Flight Mass Spectrometry with Hierarchical Cluster Analysis for Rapid Identification of Pyrolytic Interactions: Case Study of Co-Pyrolysis of PVC and Biomass Components, Process Saf. Environ. Prot., 2020, 143, 91–100, DOI:10.1016/j.psep.2020.06.036.
- M. Pelucchi, A. Frassoldati, T. Faravelli, B. Ruscic and P. Glarborg, High-Temperature Chemistry of HCl and Cl2, Combust. Flame, 2015, 162(6), 2693–2704, DOI:10.1016/j.combustflame.2015.04.002.
Footnote |
| † Electronic supplementary information (ESI) available. See DOI: https://doi.org/10.1039/d4em00501e |
| This journal is © The Royal Society of Chemistry 2025 |


