A green and efficient strategy to utilize spent SCR catalyst carriers: in situ remediation of Cu@TiO2 for photocatalytic hydrogen evolution†
Zhuo
Wang
a,
Ling
Ma
a,
Bingzhang
Chen
a,
Yubo
Zhang
a,
Kai Hong
Wong
b,
Wei
Zhao
c,
Chunxia
Wang
*a,
Guoyong
Huang
 *a and
Shengming
Xu
 d
d
aState Key Laboratory of Heavy Oil Processing, College of New Energy and Materials, China University of Petroleum (Beijing), Beijing 102249, China. E-mail: cxwang@cup.edu.cn; huanggy@cup.edu.cn
bState Key Laboratory of Urban Water Resource and Environment, Harbin Institute of Technology, Harbin 150090, P. R. China
cGreen Living and Innovation Division, Hong Kong Productivity Council, HKPC Building, 78 Tat Chee Avenue, Kowloon 999077, Hong Kong
dBeijing Key Lab of Fine Ceramics, Institute of Nuclear and New Energy Technology, Tsinghua University, Beijing, 100084, China
First published on 26th November 2024
Abstract
The selective utilization of titanium dioxide (TiO2) carriers in spent selective catalytic reduction (SCR) catalysts offers a promising strategy to alleviate environmental pollution and recover high-value resources. Herein, we report a green and sustainable method for the in situ remediation of TiO2 carriers from spent SCR catalysts with a short process using a simple impregnation method to prepare recovered CR-TiO2 with the deposition of Cu. When employed in photocatalytic hydrogen production, CR-TiO2 achieved a hydrogen production rate of 388 μmol g−1 h−1, which was 1.75 times higher than that of C-TiO2 (commercial TiO2). Experimental results and DFT calculations demonstrated that the doping of Cu species broadened the light absorption range of TiO2 and promoted water dissociation, thus enhancing its photocatalytic performance. Finally, the process was evaluated by life cycle assessment (LCA), which showed a nearly 67.8%, 71.8%, 66.5%, and 83.2% reduction in fossil fuel depletion, ozone depletion, carbon dioxide and sulfur dioxide emissions, respectively, compared to the conventional electronic-grade TiO2 synthesis method. This work provides a sustainable way to produce clean, green energy by utilizing titanium resources recovered from spent SCR catalysts. Furthermore, it provides new insights into turning waste into treasure and opens up a new way to alleviate environmental problems.
1. Introduction
Selective catalytic reduction (SCR) catalysts are widely used in power plant decommissioning systems to improve the selective reduction of flue gas (i.e. nitrogen oxides) and are suitable for major industrial scenarios.1–3 However, they are usually deactivated after 3–5 years with a short lifespan due to the existence of heavy metal, therefore, simple disposal of spent SCR catalysts (landfill vs. stockpile) is not an economical solution.4,5 The industry produces about 250![[thin space (1/6-em)]](https://www.rsc.org/images/entities/char_2009.gif) 000 tons of spent SCR catalysts per year, and the environmental pollution caused by their deactivation has become a serious problem.6–8 In this context, the concept of “waste to energy” has generated a great deal of interest in the scientific community by recycling waste to high value-added energy materials.9–12 Lou et al. reduced the high amount of arsenic-containing catalysts to the detection limit by an alkaline-acid leaching recovery process, and the regenerated catalysts showed even higher activity than the commercial catalysts in the NO conversion process after supplementation with active components.13 Mohammad Avis Khan successfully prepared MoS2@CNF electrocatalysts using spent methane reforming catalysts by a hydrothermal method in combination with MoS2, which delivered an overpotential of 128 mV at a current density of 25 mA cm−2.14 In terms of the value-added utilization of spent SCR catalysts, many studies have been carried out by our group. By designing a unique acid leaching process, vanadium recovered from waste materials can be used as a cathode material for aqueous zinc ion batteries, and the discharge capacity of the batteries assembled with VO2 was 204.6 mA h g−1 for the first five cycles.15 Feng et al. used a one-step alkaline leaching method to recover TiO2 as a cathode material for aqueous zinc ion batteries.16 The recycled TiO2 in combination with graphene could be used for lithium-ion battery with good specific capacity and electrochemical performance. As a potential secondary resource, spent SCR catalysts contain 70%–90% of TiO2. Thus, recovering TiO2 from spent SCR catalysts can not only alleviate the pressure on the environment but also improve the utilization of titanium resources from raw materials and reduce the stockpile of deactivated and harmful catalysts. Photocatalytic hydrogen evolution to produce hydrogen energy is considered to be one of the most promising clean energy sources.17,18 The traditional semiconductor photocatalysts, represented by TiO2, have been widely studied by the scientific community because of their high chemical stability, environmental friendliness, good photocatalytic activity and easy preparation.19–22 Moreover, TiO2 is considered the main raw material for green hydrogen energy production by decomposing water under sunlight.23–25 However, the high cost, insufficient redox capacity, severe charge recombination and few surface active sites still limit the large-scale application of TiO2-based photocatalysts.26 Based on these issues, recycling titanium resources from selective catalytic reduction (SCR) catalysts with in situ deposition technology to fabricate highly efficient TiO2 photocatalytic electrocatalysts is a feasible way to solve the present resource utilization and energy problems.
000 tons of spent SCR catalysts per year, and the environmental pollution caused by their deactivation has become a serious problem.6–8 In this context, the concept of “waste to energy” has generated a great deal of interest in the scientific community by recycling waste to high value-added energy materials.9–12 Lou et al. reduced the high amount of arsenic-containing catalysts to the detection limit by an alkaline-acid leaching recovery process, and the regenerated catalysts showed even higher activity than the commercial catalysts in the NO conversion process after supplementation with active components.13 Mohammad Avis Khan successfully prepared MoS2@CNF electrocatalysts using spent methane reforming catalysts by a hydrothermal method in combination with MoS2, which delivered an overpotential of 128 mV at a current density of 25 mA cm−2.14 In terms of the value-added utilization of spent SCR catalysts, many studies have been carried out by our group. By designing a unique acid leaching process, vanadium recovered from waste materials can be used as a cathode material for aqueous zinc ion batteries, and the discharge capacity of the batteries assembled with VO2 was 204.6 mA h g−1 for the first five cycles.15 Feng et al. used a one-step alkaline leaching method to recover TiO2 as a cathode material for aqueous zinc ion batteries.16 The recycled TiO2 in combination with graphene could be used for lithium-ion battery with good specific capacity and electrochemical performance. As a potential secondary resource, spent SCR catalysts contain 70%–90% of TiO2. Thus, recovering TiO2 from spent SCR catalysts can not only alleviate the pressure on the environment but also improve the utilization of titanium resources from raw materials and reduce the stockpile of deactivated and harmful catalysts. Photocatalytic hydrogen evolution to produce hydrogen energy is considered to be one of the most promising clean energy sources.17,18 The traditional semiconductor photocatalysts, represented by TiO2, have been widely studied by the scientific community because of their high chemical stability, environmental friendliness, good photocatalytic activity and easy preparation.19–22 Moreover, TiO2 is considered the main raw material for green hydrogen energy production by decomposing water under sunlight.23–25 However, the high cost, insufficient redox capacity, severe charge recombination and few surface active sites still limit the large-scale application of TiO2-based photocatalysts.26 Based on these issues, recycling titanium resources from selective catalytic reduction (SCR) catalysts with in situ deposition technology to fabricate highly efficient TiO2 photocatalytic electrocatalysts is a feasible way to solve the present resource utilization and energy problems.
Herein, a short process for the in situ remediation of TiO2 carriers from spent SCR catalysts was developed in combination with the simultaneous deposition of a transition metal. A series of well-dispersed copper (Cu)-doped photocatalysts (CR-TiO2) was prepared by using recycled TiO2 from spent SCR catalysts, and the photocatalytic hydrogen evolution performance and underlying mechanism of CR-TiO2 were investigated. It was demonstrated that the Cu–TiO2 interaction could improve the carrier transfer capacity based on experimental and theoretical calculations. Cu–TiO2 has excellent charge transfer ability as well as good hydrogen adsorption ability, which is beneficial for photocatalytic hydrogen production. Finally, the in situ remediation process was evaluated by using life cycle assessment (LCA), which demonstrated the environmental friendliness and feasibility of this process to prepare photocatalysts. This work demonstrates the high value-added utilization of titanium resources from waste SCR catalysts in photocatalytic hydrogen production, which is instructive for the recycling of waste materials to generate clean energy.
2. Experimental
2.1. Chemical and reagents
The waste SCR catalysts used in this study were provided by Anhui Yuanchen Environmental Protection Technology Co. Copper chloride anhydrous (CuCl2) was purchased from Adamas. The deionized water used had a conductivity of 18.2 MΩ cm. All the other chemical reagents were used directly in the experiments without any purification.2.2. Pretreatment process of spent SCR catalysts
The spent SCR catalyst contained TiO2 with a purity of 96.07%, which was recovered by a similar method reported by our group,16 and its main components are as follows: (96.07 wt% TiO2, 3.61 wt% Al2O3, 0.3 wt% SiO2, 0.31 wt% WO3, 0.19 wt% V2O5, 0.18 wt% F2O3, and 0.09 wt% CaO). The original obtained TiO2 is denoted as R-TiO2.2.3. Synthesis of CR-TiO2
In a 100 mL beaker, 40 mL of deionized water and a certain amount of R-TiO2 was added and stirred for 10 min, and then 1% (atomic ratio) of CuCl2 was added to the above suspension under vigorous stirring for 3 h. Subsequently, the obtained mixture was washed and centrifuged three times to obtain a light-green product, which was placed in an oven at 60 °C for 8 h. After drying and grinding, the powder was dispersed uniformly in a ceramic boat and calcined at 450 °C for 2 h, after the completion of the pyrolysis, the powder was cooled in air to obtain the final product of CR-TiO2.2.4. Characterization
The crystal structure of the samples were determined by recording their X-ray diffraction peaks (XRD) using a (D8 Advance) goniometer configured for Cu Kα radiation (λ = 1.54056 Å) in the 2θ scanning range of 5° to 90° at 40 kV and 40 mA Cu Kλ radiation. The surface morphology and microstructure and the lattice fringes of the samples were measured using a scanning electron microscope (SEM, A Quanta 200F) and transmission electron microscope (TEM, F20 field emission scanning electron microscope). XPS photoelectron spectroscopy (XPS) was carried out by using a Thermo Fisher Scientific K-Alpha (USA) to understand the elemental chemical state of the samples. An inductively coupled plasma emission spectrometer (ICP-OES, AVIO 200, Optima 8000) was used to quantify the actual loading of Cu. A fluorescence spectrophotometer (F-4700, Hitachi, Japan) was used to conduct the luminescence measurement, and the excitation wavelength was set at 320 nm at room temperature to obtain the maximum emission wavelength. The UV-visible diffuse reflectance spectral data were collected on a PerkinElmer Lambda 950 spectrophotometer.2.5. Photocatalytic hydrogen evolution
The photocatalytic water-splitting experiments were carried out on an all-glass automatic on-line trace gas analysis system (Labsolar-6A, Beijing Perfect Light Technology Co., Ltd) and a multi-channel photochemical reaction test system (PCX-50C Discover, Perfect Light Ltd). Sacrificial agents are essential in the photocatalytic decomposition of water, given that they can act as electron donors and reduce carrier recombination. Methanol was used as the sacrificial agent in this study. Briefly, 20 mg catalyst was uniformly dispersed in a reactor containing a mixed solution of 80 mL water and 20 mL methanol. The hydrogen production process was carried out by using argon as the carrier gas and methanol as the sacrificial agent, and the reaction was stirred under vacuum for half an hour prior to the reaction. The photocatalytic hydrogen production test started when the reactor vacuum reached 0.3 kPa, effectively excluding the influence of air. Hydrogen production was recorded and analyzed by an on-line gas chromatograph (GC9790II (PLF-01)) with a 300 W Perfect Light PLS-SXE300C xenon lamp. The chiller temperature was set at 5 °C. A 300 W Xe lamp was used as the light source for full-light irradiation without cutoff filters.2.6. Photoelectrochemical measurements
An electrochemical workstation (CHI760E, China) was used to obtain the transient photocurrent response with electrochemical impedance data. The electrolyte used was a 0.2 M sodium sulfate solution. The workstation consists of a working electrode, a counter electrode (platinum sheet) and a reference electrode. The working electrode was prepared as follows: 2 mg of catalyst was added to a mixture of 1 mL of ethanol and 40 μL of Nafion solution (5 wt%), sonicated for half an hour so that the slurry was uniformly coated on the surface of FTO conductive glass with a size of 2.0 cm × 2.0 cm (conductive side), and dried in the air for 3 h before testing.2.7. Theoretical calculations
The density functional theory (DFT) calculations carried out in this study were processed by using the VASP simulation software. To simulate the real environment, a TiO2 block model containing 108 atoms, 36 Ti atoms and 72 O atoms was created. A vacuum layer of 15 Å was added to eliminate layer-to-layer interactions. The coulombic interactions between local electrons were considered, and the U of the Ti element was set to 5 eV. The truncation energy ENCUT = 520 eV was used in the calculations, and the minimum energy convergence criterion during the geometry optimization process was 1 × 10⁻⁵ eV. The K-point network was set to 5 × 5 × 2.3. Results and discussion
Given that the spent SCR catalyst has a variety of non-homogeneous elements, the types and specific contents of various elements were determined before and after the recycling process, and the results are shown in Tables S1 and S2.† The content of TiO2 after the recycling process was 96.07%, which is referred to as R-TiO2. As shown in Fig. 1, a large amount of TiO2 carriers in the waste SCR catalysts was generated by industrial consumption, and a short-flow in situ remediation method was used to remediate the waste TiO2 carriers to produce CR-TiO2, which was then applied in the field of photocatalytic hydrogen production to achieve resource reutilization.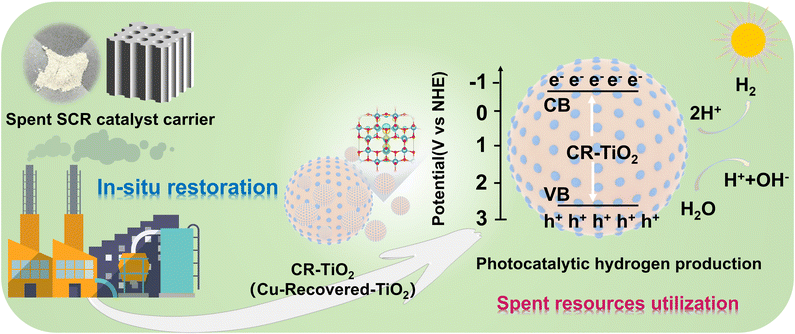 | ||
| Fig. 1 Schematic illustration of the synthesis process of CR-TiO2 for photocatalytic hydrogen production. | ||
The surface morphology of the photocatalysts was characterized by high-resolution transmission electron microscopy (HR-TEM) and scanning electron microscopy (SEM). The TEM image clearly showed the lattice stripe of CR-TiO2, which was estimated to be 0.348 nm and is consistent with the anatase crystalline (101) facet of TiO2 (Fig. 2a), indicating the excellent crystallinity of CR-TiO2. In addition, the selected area electron diffraction (SAED) images show clear diffraction rings with CR-TiO2 (Fig. 2b), respectively, which also correspond to the (101), (112), and (200) facets of anatase TiO2. From Fig. 2c, it can be clearly seen that CR-TiO2 exhibits a spherical morphology. As shown in Fig. 2d–f, the EDS mapping revealed the presence and uniform distribution of Ti, O, and Cu in CR-TiO2, indicating that Cu is uniformly dispersed on the surface of TiO2, which provides evidence for the synergistic interaction between TiO2 and Cu. The crystal structure of CR-TiO2 was characterized by X-ray diffraction (XRD) spectroscopy, as shown in Fig. 3a. The strong diffraction peaks at around 25.3° in the XRD spectrum are attributed to the formation of TiO2 in the standard anatase crystal form. The R-TiO2 recovered from the spent SCR material also showed the standard TiO2 diffraction peaks in its XRD pattern.27,28 We found out that negligible difference in the crystal structure of CR-TiO2 compared to C-TiO2 (commercial TiO2) can be observed. The XRD peaks for CR-TiO2 did not show any signals with respect to Cu, which can be attributed to the low concentration of Cu. This phenomenon suggests that small amounts of Cu do not cause changes in the XRD diffraction peaks of TiO2.29–31 The comprehensive analysis of the morphology and crystal structure indicates that the CR-TiO2 photocatalyst was successfully prepared in this study.
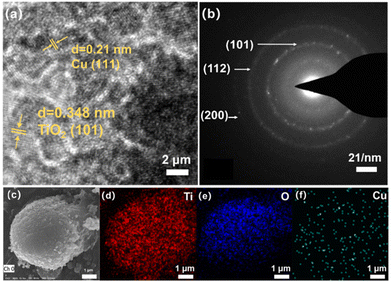 | ||
| Fig. 2 (a) HR-TEM images of CR-TiO2. (b) SAED images of CR-TiO2. (c) SEM image of CR-TiO2. (d–f) SEM-EDS mapping of CR-TiO2. | ||
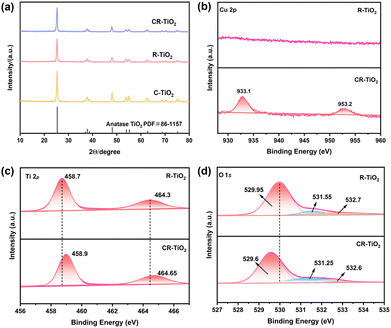 | ||
| Fig. 3 (a) XRD patterns of C-TiO2, R-TiO2 and CR-TiO2. XPS spectra of Cu 2p (b), (c) Ti 2p, and (d) O 1s, respectively. | ||
The chemical state of Ti, O and Cu in the catalyst were also confirmed using X-ray photoelectron spectroscopy (XPS). As shown in Fig. 3b, the Cu 2p of R-TiO2 did not show signals for Cu species. The two peaks at 933.1 eV and 953.2 eV in the spectra of CR-TiO2 correspond to Cu 2p3/2 and Cu 2p1/2 of Cu2+, respectively, compared to that of R-TiO2, which is attributed to the successful loading of Cu on TiO2.32,33 The Ti 2p spectrum of R-TiO2 shows peaks corresponding to Ti 2p3/2 and Ti 2p1/2 at 458.7 eV and 464.3 eV, respectively, and the energy difference between the spin orbitals of 5.6 eV confirms the presence of Ti4+.34 The Ti 2p binding energies of CR-TiO2 shifted towards higher energies compared to that of R-TiO2, suggesting that the introduction of Cu species changed the electron density of the Ti 2p orbitals.35 The electrons tend to move towards Ti species with a higher charge density, leading to a lower binding energy.36 The XPS spectrum of O 1s of CR-TiO2 was decomposed into three peaks at 529.6 eV, 531.25 eV, and 532.6 eV, belonging to lattice oxygen, vacancy oxygen, and adsorbed oxygen, respectively.37,38 Compared with the R-TiO2 catalyst, the O 1s characteristic peak of CR-TiO2 showed a slightly blue-shifted binding energy of the oxygen vacancy by 0.3 eV. In addition, the concentration of oxygen vacancies in CR-TiO2 (18.26%) is much higher than that in R-TiO2 (8.29%), which may be due to the fact that Cu doping led to a lattice mismatch, which increased the proportion of oxygen vacancies.39 Combined with the above-mentioned analyses, we infer that doping with low concentrations of Cu species may improve the photocatalytic ability of R-TiO2.
4. Photocatalytic hydrogen evolution
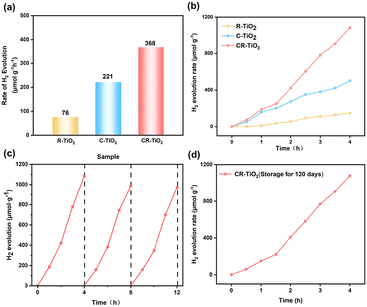
One of the primary objectives of the in situ remediation of spent TiO2 carriers is to establish photocatalytic activity centers through Cu deposition to increase hydrogen production.40 We performed a 4 h photocatalytic hydrogen production cycle test and a stability test for 12 h under full-spectrum conditions with a 300 W Xe lamp. Methanol was used as the sacrificial agent in this study according to previous reported literature.41,42 The hydrogen production performance is shown in Fig. 4. The wide band gap of TiO2 and the susceptibility of photogenerated electron pairs to complexation has a negative effect on its photocatalytic performance.43,44 Thus, as expected, R-TiO2 showed a moderate hydrogen production capacity with a performance of 76 μmol g−1 h−1. Alternatively, CR-TiO2 showed the highest photocatalytic hydrogen production capacity of 368 μmol g−1 h−1, which is 4.84 times and 1.5 times higher than that of R-TiO2 and C-TiO2 (221 μmol g−1 h−1), as displayed in Fig. 4a and b, respectively. The photocatalytic activity of the CR-TiO2 catalyst is superior to previously reported photocatalysts (Table S4†). This phenomenon suggests that the modification of Cu species can effectively increase the utilization of photogenerated carriers and significantly improve the water hydrolysis performance of TiO2.45Moreover, CR-TiO2 also showed excellent stability without significant decrease in its hydrogen production performance during the 12 h long cycle experiment (Fig. 4c). In addition, XRD tests were performed on CR-TiO2 after the long cycle test. As shown in Fig. S1,† CR-TiO2 showed the standard TiO2 diffraction peaks, which proves that the crystalline structure of CR-TiO2 was not destroyed after the long-time testing, indicating its good stability. It should be mentioned that CR-TiO2 maintained good hydrogen production activity (above 90%) after 120 days of storage at room temperature (as shown in Fig. 4d), proving its excellent stability.
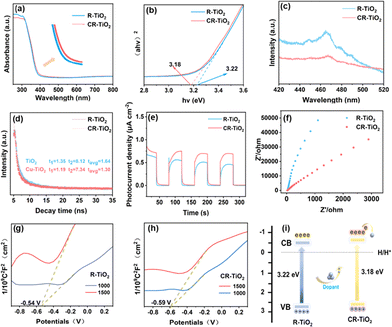
The optical absorption property of a catalyst is one of the factors affecting its activity, and thus we characterized the optical properties of R-TiO2 and CR-TiO2 by UV-vis absorption spectroscopy. Pure TiO2 has a band gap width of around 3.2 eV, and generally only absorbs in the UV region.46 As shown in Fig. 5a and the enlarged area (Fig. 5a, inset), it can be seen that the absorption edges of CR-TiO2 slightly red-shifted compared to R-TiO2, which indicates that the absorbance of CR-TiO2 expands towards the long wavelength absorption region.47,48 This is probably because Cu doping can change the electronic structure of TiO2, resulting in a narrower band gap between its conduction and valence bands, which is responsible for its increased light absorption range.49Fig. 5b shows the fitted Tauc plot, from which it can be seen that the band gap of R-TiO2 is 3.22 eV, while the band gap of CR-TiO2 is reduced to 3.18 eV, and this decreased band gap drove the improvement in the photocatalytic activity of CR-TiO2. The rate of photogenerated electron–hole pair complexation is an important assessment of catalyst efficiency. Using steady-state photoluminescence (PL) and time-resolved decay spectroscopy (TRPL), the carrier transfer mechanism of CR-TiO2 and R-TiO2 could be investigated to quantify their corresponding charge transfer ability. As shown in Fig. 5c, the higher peak intensities in the spectra indicate higher electron–hole recombination ratios and higher energies required for the excited molecules to return to the ground state. Pure TiO2 showed the highest peak around 468 nm, where there is a clear charge recombination process. Alternatively, CR-TiO2 showed a significantly lower peak intensity. Therefore, we can infer that the recombination of holes and electrons in CR-TiO2 can be suppressed and the charge separation efficiency is significantly improved.
The lifetime (τavg) of R-TiO2 and CR-TiO2 (τ1 = 1.35 ns, τ2 = 8.12 ns and τavg = 3.64 ns for R-TiO2; τ1 = 1.19 ns, τ2 = 7.34 ns and τavg = 1.30 ns for CR-TiO2) was obtained from the data fitting of the time resolution photoluminescence (TRPL) decay curves, as demonstrated in Fig. 5d. This phenomenon suggests that Cu loading can lead to a decrease in the PL lifetime of R-TiO2. After the calculation, CR-TiO2 has the highest rate constant Kct for charge transfer, Kct = 1.59 × 10⁻⁸ s−1, which indicates that the electron transfer ability between TiO2 and Cu species can be effectively enhanced. CR-TiO2 has an effective charge transfer efficiency (ηET) of 20.74%, suggesting that this material has the optimal charge transfer capability. This is consistent with its hydrogen production performance, indicating that the doping of Cu species effectively improved the charge transfer ability in hydrogen production.
Carrier migration is governed by the carrier transfer kinetics, which directly affects the smooth progress of redox reactions, and the performance of a photocatalyst depends on the carrier behavior of the material itself. Therefore, to observe the photoelectric properties of catalyst carriers more intuitively and study their charge transfer separation ability, transient photocurrent response and electrochemical impedance spectroscopy (EIS) were employed. As shown in Fig. 5e, the photocurrent response strength of CR-TiO2 significantly increased compared to that of R-TiO2, which implies that the synergistic effect between Cu and R-TiO2 led to the enhanced separation of electrons and holes. As shown in Fig. 5f. It can be clearly seen that the Nyquist radius of CR-TiO2 is lower than that of R-TiO2. The smaller radius indicates the stronger electron migration ability, and this phenomenon proves that CR-TiO2 shows more favorable charge transport than R-TiO2. Based on the above-mentioned results, we can conclude that the doping of Cu species greatly improved the electron-hole separation and electron transfer ability of TiO2 and promoted the rapid production of hydrogen. To confirm the energy band structure of the materials, we verified the band edge positions of R-TiO2 and CR-TiO2 by the XPS-Vb method. As shown in Fig. S2,† the valence band positions of R-TiO2 and CR-TiO2 were determined to be 2.69 V and 2.70 V, respectively. To further validate the energy band structures, the energy band positions of R-TiO2 and CR-TiO2 were also investigated using Mott–Schottky diagrams. The Mott–Schottky (M–S) plot enables the determination of the flat-band potentials and the valence band or conduction band values. As in shown in Fig. 5g and h, the positive slopes of CR-TiO2 and R-TiO2 indicate that they are both n-type semiconducting materials. By observing the intersection of the tangent line with the X-axis, the conduction band potentials of CR-TiO2 and R-TiO2 are −0.59 and −0.54 V, respectively. According to the UV-converted Tauc-plots, the band gaps of CR-TiO2 and R-TiO2 were calculated to be 3.18 and 3.22 eV, respectively. Therefore, by using the empirical formula ECB = EVB − Eg, their valence band potentials are 2.59 and 2.63 V, respectively. The results show that compared with R-TiO2, Cu doping led to a lower conduction band (CB) position for CR-TiO2. As the band gap decreases, the electron leaps easier, and more photogenerated carriers can participate in the reaction, thus improving the photocatalytic activity.
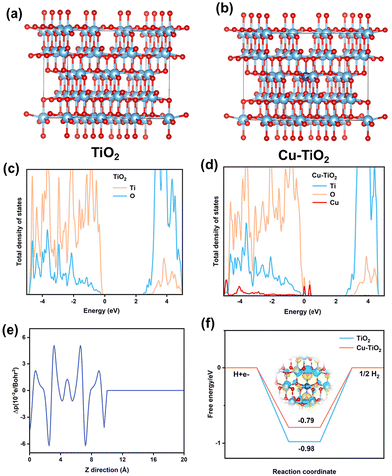
We established the structures of TiO2 and Cu–TiO2 to investigate the photocatalytic mechanism in real environments (Fig. 6a and b, respectively). The change in DOS is caused by the introduction of Cu (Fig. 6c and d), suggesting that Cu doping can optimize the electronic structure of TiO2, which can significantly improve the electron transfer ability and enable the migration of photogenerated electrons from Cu 3d to Ti 3d. The electrons in TiO2 can easily jump from the valence band to the conduction band, and thus effectively inhibit the rapid complexation of the electron–hole pairs.50,51 To further explain the reason for the difference in material properties, the system work function of TiO2 and Cu–TiO2 was calculated, which is usually used as a measure of the ease of electron mobility of a material. As shown in Fig. S3,† the work function for the TiO2 and Cu–TiO2 surfaces were determined to be 7.26 eV and 7.10 eV, respectively, indicating that Cu effectively enhances the mobility of the photogenerated carriers. In addition, the charge difference density was visualized to study the effect of Cu doping on the electron distribution (Fig. 6e). The planar charge difference density clearly shows the redistribution of electrons after Cu doping as well as the change in the electron density of atoms around Cu.
According to Fig. 6f (inset), it can clearly be seen that the electron density of the Ti atoms and O atoms decreased around the Cu atoms (yellow areas in the differential charge diagram represent electrons gained and blue areas represent electrons lost), and the electrons converge from the Ti site to the Cu site. By comparing the Gibbs free energy of hydrogen adsorption (GH*), it is possible to analyze the hydrogen evolution kinetics. The free energy diagram (Fig. 6f) shows that the ΔGH* of the Cu–TiO2 structural model is −0.79 eV, while the ΔGH* of TiO2 was estimated to be −0.98 eV, sugeesting good hydrogen adsorption ability with a lower energy barrier of Cu–TiO2, which are beneficial for the photocatalytic hydrogen production.
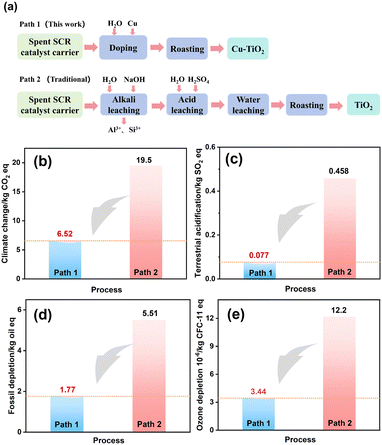
The preparation process has a significant impact on the ecosystem, and thus it is necessary to assess the viability of the system from multiple perspectives. Consumption and production (gas, liquid, solid, hazardous waste, etc.) during the preparation process can cause changes in the ecosystem. Accordingly, to analyze the environmental impact of the in situ remediation of TiO2 carriers from spent SCR catalysts into photocatalysts and assess the economical value of the process, two systems were constructed by using life cycle assessment (LCA) to compare our synthetic process (Path 1) and the traditional electronic grade TiO2 (purity >99.0%) recycling process (Path 2). As shown in Fig. 7a, Path 1 produced CR-TiO2via the in situ remediation of waste TiO2 carriers through calcination. Path 2 produced high-purity TiO2 through alkaline leaching and acid leaching and other processes.52,53 Accordingly, four factors including fossil fuel depletion value, ozone depletion, terrestrial acidification and climate change were selected for analysis. As shown in Fig. 7b–e, the fossil fuel depletion value (2.87 kg/kg), ozone depletion (3.8 × 10⁻⁷ kg/kg), CO2 (10.1 kg/kg) and SO2 gas emissions (0.093 kg/kg) in Path 1 are much lower than that in Path 2. The reductions were 47.91%, 68.85%, 48.2% and 79.69%, respectively. This indicates that Path 1 shows a lower the environmental impact than that of Path 2. Moreover, the photocatalytic hydrogen production performance of the CR-TiO2 is higher than that of commercial TiO2 (purity >99%). This work highlights the environmental advantages and significance of turning waste catalysts into novel photocatalytic energy materials.
5. Conclusion
In summary, we developed a new strategy for the high-value utilization of spent SCR catalysts in the field of sustainable energy production. The TiO2 carriers in spent SCR catalysts were subjected to a short process of in situ remediation to form CR-TiO2 photocatalytic nanomaterials with an excellent hydrogen production performance. CR-TiO2 exhibited a high photocatalytic hydrogen production capacity up to 368 μmol g−1 h−1, which is 1.5 times higher than that of C-TiO2 (221 μmol g−1 h−1). Its high performance was attributed to the Cu–Ti intermetallic interaction, which reduced the band gap and the electron–hole pair complexation rate. Compared with C-TiO2, CR-TiO2 exhibited lower electrical resistance and a higher degree of photoresponsiveness, suggesting that CR-TiO2 can be directly applied in photocatalytic hydrogen production systems. Furthermore, the theoretical calculation results revealed that Cu–TiO2 has excellent charge transfer ability and good hydrogen adsorption ability, which are beneficial for photocatalytic hydrogen production. In addition, an economic evaluation of the whole process was systematically performed, which showed that the fossil fuel depletion value, ozone depletion, terrestrial acidification and climate change are much lower than that of the conventional recycling process, proving the feasibility of this process. This work is instructive for the recycling of waste materials to generate clean energy and provides new insights to alleviate environmental pollution.Data availability
The data supporting this article have been included as part of the ESI.†Conflicts of interest
The authors declare no conflict of interest.Acknowledgements
This project was supported by National Key Research and Development Program of China (No. 2021YFC2901100), the National Natural Science Foundation of China (No. 22478425 and 52274307), Science Foundation of China University of Petroleum, Beijing (No. 2462022QZDX008, 2462021QNX2010), State Key Laboratory of Heavy Oil Processing (HON-KFKT2022-10). Supported by Open Project of State Key Laboratory of Urban Water Resource and Environment, Harbin Institute of Technology (No. ESK202401).References
- H. Zhou, P. Ma, Z. Lai, Y. Zuo, Y. Xing, H. Shi and K. Cen, J. Cleaner Prod., 2020, 275, 122954 CrossRef CAS.
- L. Wang, S. Su, M. Qing, Z. Dai, Z. Sun, L. Liu, Y. Wang, S. Hu, K. Xu and J. Xiang, Fuel, 2019, 252, 164–171 CrossRef CAS.
- X. Yang, K. Liu, X. Han, J. Xu, M. Bian, D. Zheng, H. Xie, Y. Zhang and X. Yang, J. Hazard. Mater., 2023, 459, 132209 CrossRef CAS PubMed.
- C. Wang, L. Liu, W. Hu, C. Wang, X. Hou and H. Li, Sep. Purif. Technol., 2025, 352, 127991 CrossRef CAS.
- H. Xiao, L. Chen, Z. Qin, R. Yin, D. Weng, Z. Wang and D. Luo, Waste Manage., 2022, 150, 301–309 CrossRef CAS PubMed.
- Y. Wei, D. Li, J. Qiao and X. Guo, J. Environ., 2023, 11, 110104 CAS.
- J. Liu, C. Wang, Y. Sun, X. Wang, H. Li, J. Tian, W. Hu and L. Liu, Fuel, 2024, 366, 131298 CrossRef CAS.
- M. Li, B. Liu, X. Wang, X. Yu, S. Zheng, H. Du, D. Dreisinger and Y. Zhang, Chem. Eng. J., 2018, 342, 1–8 CrossRef CAS.
- K. Yue, S. Liu, S. Yan, D. Bi, Z. Liu and S. Xu, Sep. Purif. Technol., 2024, 344, 127302 CrossRef CAS.
- J. Liu, C. Wang, X. Hou, H. Li, X. Wang, W. Hu, T. Ge, J. Zhang, G. Zhu and H. Xie, J. Environ. Manage., 2023, 347, 119107 CrossRef CAS.
- X. Liang, J. Tang, L. Li, Y. Wu and Y. Sun, J. Cleaner Prod., 2022, 376, 134108 CrossRef CAS.
- J. Jan, C.-L. Chang and S.-m. Chang, J. Hazard. Mater., 2024, 472, 134497 CrossRef CAS PubMed.
- W. Lou, Y. Zhang, S. Zheng, P. Li, Y. Zhang, Y. Zhang, B. Zhao, Z. Li and W. Jin, Hydrometallurgy, 2019, 187, 45–53 CrossRef CAS.
- M. A. Khan, M. T. Mehran, S. R. Naqvi, A. H. Khoja, F. Shahzad, U. Sikander, S. Hussain, R. Khan, B. Sarfaraz and M. M. Baig, ACS Omega, 2021, 6, 21316–21326 CrossRef CAS.
- J. Wen, X. Hou, M. Yao, J.-a. Chen, M. Tian, E. Feng, G. Huang and S. Xu, J. Cleaner Prod., 2023, 390, 136151 CrossRef CAS.
- E. Feng, D. Gao, F. Yu, J. Chen, Z. Xu, W. Zhang, C. Wang, Y. Gao, J. Wen, G. Huang and S. Xu, J. Cleaner Prod., 2024, 444, 141120 CrossRef CAS.
- V.-H. Dang, T.-A. Nguyen, M.-V. Le, D. Q. Nguyen, Y. H. Wang and J. C. S. Wu, Chem. Eng. J., 2024, 484, 149213 CrossRef CAS.
- R. Han, K. Wang, Q. Jiang, G. Zhang, Q. Lu and E. Guo, J. Colloid Interface Sci., 2024, 671, 680–691 CrossRef CAS PubMed.
- G. Yu, B. Tang, Q. Luo, H. Chen, Z. Yin, Z. Zhang, Z. Wang, B. Lv and S. Shan, Int. J. Hydrogen Energy, 2024, 78, 236–243 CrossRef CAS.
- H. Tada, A. Akita and S.-i. Naya, Catal. Sci. Technol., 2023, 13, 4581–4589 RSC.
- F. Xiao, T. Xiao, L. Zhao and X. He, Renewable Energy, 2024, 230, 120778 CrossRef CAS.
- L. Guo, Y.-L. Liu, Q. Zeng, C. Zhang, Y. Wen, Q. Zhang, G. Tang, Q. Zhang and Q. Zeng, J. Hazard. Mater., 2024, 465, 133415 CrossRef CAS.
- M. Gao, J. Ma, Y. Li, X. Lin, L. Wu, Y. Zou and Y. Deng, ACS Appl. Mater. Interfaces, 2024, 16, 17563–17573 CrossRef CAS.
- Z. Luo, X. Han, Z. Ma, B. Zhang, X. Zheng, Y. Liu, M. Gao, G. Zhao, Y. Lin, H. Pan and W. Sun, Angew. Chem., Int. Ed., 2024, 32, e202406728 Search PubMed.
- Y.-S. Ouyang, S.-T. Zheng, G.-W. Guan and Q.-Y. Yang, ACS Appl. Energy Mater., 2022, 5, 14455–14465 CrossRef CAS.
- S. Hu, B. Wang, M. Zhu, Y. Ma, Z. Lv and H. Wang, Appl. Surf. Sci., 2017, 403, 126–132 CrossRef CAS.
- T. K. Rahul, M. Mohan and N. Sandhyarani, ACS Sustainable Chem. Eng., 2018, 6, 3049–3059 CrossRef CAS.
- J.-W. You, K. Vikrant, D.-H. Lim, S. Verma, D. Kukkar, H. Anwer and K.-H. Kim, J. Cleaner Prod., 2022, 371, 133487 CrossRef CAS.
- B. Xiao, C. Shen, Z. Luo, D. Li, X. Kuang, D. Wang, B. Zi, R. Yan, T. Lv, T. Zhou, J. Zhang and Q. Liu, Chem. Eng. J., 2023, 468, 143650 CrossRef CAS.
- K. Zhang, G. Lu, F. Chu and X. Huang, Catal. Sci. Technol., 2021, 11, 7060–7071 RSC.
- Y. Liu, S. Sun, M. Ma, X. Zhong, F. Gao, G. Hai and X. Huang, J. Mater. Chem. A, 2024, 12, 23577–23589 RSC.
- C. Chen, T. Wang, K. Yan, S. Liu, Y. Zhao and B. Li, Inorg. Chem. Front., 2022, 9, 4753–4767 RSC.
- T. Wang, L. Chen, C. Chen, M. Huang, Y. Huang, S. Liu and B. Li, ACS Nano, 2022, 16, 2306–2318 CrossRef CAS PubMed.
- X. Liang, L. Shi, Y. Liu, H. Chen, R. Si, W. Yan, Q. Zhang, G.-D. Li, L. Yang and X. Zou, Angew. Chem., Int. Ed., 2019, 58, 7631–7635 CrossRef CAS.
- H. Chen, Z. Yang, X. Wang, F. Polo-Garzon, P. W. Halstenberg, T. Wang, X. Suo, S.-Z. Yang, H. M. Meyer, III, Z. Wu and S. Dai, J. Am. Chem. Soc., 2021, 143, 8521–8526 CrossRef CAS PubMed.
- T. Lv, B. Xiao, S. Zhou, J. Zhao, T. Wu, J. Zhang, Y. Zhang and Q. Liu, Chem. Commun., 2021, 57, 9704–9707 RSC.
- Z. Xiu, M. Guo, T. Zhao, K. Pan, Z. Xing, Z. Li and W. Zhou, Chem. Eng. J., 2020, 382, 123011 CrossRef CAS.
- Y. Zhao, Y. Zhao, R. Shi, B. Wang, G. I. N. Waterhouse, L.-Z. Wu, C.-H. Tung and T. Zhang, Adv. Mater., 2019, 31, 1806482 CrossRef.
- H. Lee, Y.-H. Suh, X.-B. Fan, L. Ni, J. Yang, Y. Kim, J.-W. Jo, H. W. Choi, S.-M. Jung, D.-W. Shin, S. Lee and J. M. Kim, J. Mater. Chem. C, 2022, 10, 10708–10718 RSC.
- J. Si, Y. Wang, X. Xia, S. Peng, Y. Wang, S. Xiao, L. Zhu, Y. Bao, Z. Huang and Y. Gao, J. Power Sources, 2017, 360, 353–359 CrossRef CAS.
- U. Caudillo-Flores, G. Agostini, C. Marini, A. Kubacka and M. Fernández-García, Appl. Catal., B, 2019, 256, 117790 CrossRef.
- M. Shahrezaei, S. M. H. Hejazi, H. Kmentova, V. Sedajova, R. Zboril, A. Naldoni and S. Kment, ACS Appl. Mater. Interfaces, 2023, 15, 37976–37985 CrossRef CAS.
- N. Rahimi, R. A. Pax and E. M. Gray, Prog. Solid State Chem., 2016, 44, 86–105 CrossRef CAS.
- N. E. Sunny, S. S. Mathew, N. Chandel, P. Saravanan, R. Rajeshkannan, M. Rajasimman, Y. Vasseghian, N. Rajamohan and S. V. Kumar, Chemosphere, 2022, 300, 134612 CrossRef CAS PubMed.
- B. Yan, L. Zhang, Z. Tang, M. Al-Mamun, H. Zhao and X. Su, Appl. Catal., B, 2017, 218, 743–750 CrossRef CAS.
- J. Lian, Y. Chai, Y. Qi, X. Guo, N. Guan, L. Li and F. Zhang, Chin. J. Catal., 2020, 41, 598–603 CrossRef CAS.
- R. Shen, C. Jiang, Q. Xiang, J. Xie and X. Li, Appl. Surf. Sci., 2019, 471, 43–87 CrossRef CAS.
- N. R. Reddy, U. Bharagav, M. M. Kumari, K. K. Cheralathan, M. V. Shankar, K. R. Reddy, T. A. Saleh and T. M. Aminabhavi, J. Environ. Manage., 2020, 254, 109747 CrossRef CAS PubMed.
- X. Li, K. Zhang, X. Huang, Z. Wu, D. Zhao and G. Wang, Nanoscale, 2021, 13, 19671–19681 RSC.
- P. S. Basavarajappa, S. B. Patil, N. Ganganagappa, K. R. Reddy, A. V. Raghu and C. V. Reddy, Int. J. Hydrogen Energy, 2020, 45, 7764–7778 CrossRef CAS.
- X. Sun, X. Luo, X. Zhang, J. Xie, S. Jin, H. Wang, X. Zheng, X. Wu and Y. Xie, J. Am. Chem. Soc., 2019, 141, 3797–3801 CrossRef CAS PubMed.
- X. Bai, X. Shang, H. Wan, Y. Che, B. Yang, J. He and J. Song, J. Energy Chem., 2021, 58, 557–563 CrossRef CAS.
- K. Cheng, Y. Yu, B. Mei, Y. Li and L. Xu, Sustainability, 2022, 14, 10284 CrossRef CAS.
Footnote |
| † Electronic supplementary information (ESI) available. See DOI: https://doi.org/10.1039/d4gc04806g |
| This journal is © The Royal Society of Chemistry 2025 |

