
 Open Access Article
 This Open Access Article is licensed under a
 Creative Commons Attribution 3.0 Unported Licence
Correlation of sonochemical activities measured via dosimetry and an area-selective analysis of sono(chemi)luminescence†
Yucheng
Zhu
ab,
Xueliang
Zhu
b,
Xuhai
Pan
*a,
Lian X.
Liu
 b and
Madeleine J.
Bussemaker
*b
b and
Madeleine J.
Bussemaker
*b
aCollege of Safety Science and Engineering, Nanjing Tech University, Nanjing, China. E-mail: xuhaipan@njtech.edu.cn
bDepartment of Chemical and Process Engineering, University of Surrey, Guildford, UK. E-mail: m.bussemaker@surrey.ac.uk
First published on 25th March 2025
Abstract
Ultrasonic industrial applications require theoretical support and practical guidance from a comprehensive understanding of sonochemical reaction dynamics. The influence of acoustic factors (frequency and pressure amplitude) and external parameters (liquid height) on sonochemical activity were researched. The phenomenon of sonoluminescence (SL), sonochemiluminescence (SCL) and potassium iodide (KI) dosimetry were investigated at 114 different settings. The settings included electrical loading-power of 10, 20, 30, and 40 W, 10 frequencies ranging from 22 to 2000 kHz, and reactor volumes of 200, 300, and 400 ml. A new area selection image processing technique was used to conduct a systematically quantitative analysis of SL and SCL across a broader frequency range. The sonochemical activity could be categorised into three zones based on the ultrasonic frequency (22 to 2000 kHz): f < 200 kHz, 200 kHz ≤ f ≤ 1000, and 1000 kHz ≤ f ≤ 2000 kHz. The Pearson and Spearman correlation coefficients were used to discuss the correlation between SL, SCL, reactive oxidant species (ROS) and hydrogen peroxide yields. The findings indicate that the influence of liquid height on cavitation activity within the reactor is mostly manifested in the power density. The ultrasonic oxidation capacity (as indicated by the yield of ROS) exhibits a strong positive relationship with SL intensity. A divergence of correlation between SL and I3− yield was observed. There was a lack of correlation between sonochemical activities (e.g. SCL and ROS yield). The poor correlation highlighted the importance of considering chemical mechanisms and reaction locations concerning the collapsing bubble.
1. Introduction
The ultrasonic-driven cavitation bubbles go through generation, growth, and a quasi-collapse process, which can effectively produce extreme energies that can drive high temperatures (>800 K), high pressures (several hundred bar),1 and generation of reactive oxidative species (ROS),2,3 and aqueous electrons.4,5 Moreover, acoustic cavitation not only involves radical chemistry but also induces significant mechanical effects, such as microjets, shock waves, and shear forces.6 These localized mechanical stresses resemble the action modes observed in mechanochemistry, giving acoustic cavitation the dual characteristics of sonochemistry and mechanochemistry. Therefore, sonochemistry can be regarded as a specialized form of mechanochemistry, as both share intersections in energy transfer mechanisms and reaction initiation pathways, offering new possibilities for developing mechanically driven chemical reactions.7–9 These, ultrasonically-driven phenomena can contribute to degradation of organic pollutants and elimination of pathogenic microorganisms in water.5,10,11 Hence, acoustic cavitation is recognized as a chemical-free and green advanced water and wastewater treatment process (WWTP).5,12–16 Existing efforts have typically focused on the degradation and elimination of a single pollutant or microorganism under specific sono-operating conditions,15,17–19 or rudimentary comparison of ultrasonic processes with traditional non-ultrasonic processes. These works had already confirmed the effectiveness of ultrasonic method in green chemistry, and reported the sono-purification will be significantly influenced by cavitation effects and acoustic parameters.16,20 Nevertheless, such limited approaches lead to conclusions under specific parameters, which are not necessarily generally applicable and are often insufficient to be applied to optimised employment of acoustic technology.The diameter of the transient cavitation bubble continues to grow until the energy from ultrasound can no longer be absorbed.21 When the bubble reaches a critical size, the force acting on it dominates, leading to a violent and quick collapse.21–23 The fragmentation of the transient cavitation bubble is an important cause of acoustic cavitation phenomena and sonochemical reactions.24–26 Both are the significant mechanisms possibly responsible for microorganisms' destruction and chemical pollutant degradation.5,27–29 The sonochemical reaction and cavitation phenomena are significantly influenced by the various characteristics that affect the energy transfer within the ultrasonic system. The parameters include acoustic frequency, amplitude, energy transfer distance, as well as the viscosity of the liquid and the concentration and diffusion of gas.4,21,30,31 Furthermore, the dissipation and effectiveness of the ultrasonic energies are inherently problematic due to impedance-reducing energy transfer and existing secondary effects (e.g. flow, acoustic field attenuation, reactor corrosion, noise generation and overall mixing, etc.).14,22
The resonance size of the bubbles is inversely proportional to the frequency applied to the acoustic field, with smaller bubbles being produced at higher frequencies.4,32 Due to the shortened oscillation cycle, collapse and fragmentation happen rapidly, more fragmented bubbles are produced in a short duration, the collapse intensity is reduced, and more ROS (e.g. hydroxyl (˙OH), hydrogen peroxide (H2O2)) are released out of the bubbles before undergoing any reaction.33–35 At lower frequencies, larger-sized bubbles are produced, collapse is strong, bubble surface instability is increased, and free radicals within the bubbles have enough time to follow reaction pathways analogous to flame chemistry.33,36 As a key component in organic pollutant removal during sonochemical process, the hydroxyl radical production and the afore-mentioned factors are not always positively correlated with acoustic field frequency.37–39 Many studies have shown the existence of optimal frequencies for ultrasound-introduced chemical processes to obtain the highest sonochemical efficiency.28,39–42 In general, the pressure amplitude is strongly related to the power transferred into the liquid and has effects on the number of cavitation bubbles and the strength of the collapse.4 Within the effective range of pressure amplitudes, higher amplitudes result in larger size bubbles.36 The increase of compression and rarefaction forces can result in more violent collapse, which can contribute to sonochemical activity.43–45 The intensity of ultrasonic waves decrease with distance from emission source as they propagate through a medium. There are viscous interactions between liquid molecules while liquid molecules vibrate under the sonic waves.46 Existence of reflection, refraction, diffraction and scattering of waves result in the attenuation of sound in liquid.21 In addition, the conversion of some amount of mechanical energy into heat can also lead to attenuation in the system, thereby affecting the sonochemical activity.21,47 For a plate transducer ultrasonic reaction system, the liquid height can reflect the maximum distance from the sound source.
Ultrasound has been extensively researched and employed as a valuable tool in green chemistry and WWTP, including a broad range of topics such as removing algae from water,48,49 water disinfection,13 and the degradation and removal of contaminants.50–52 Nevertheless, these studies have frequently been carried out with a focus on individual contaminants, and the acquired acoustic sets are highly specialised. The primary degradation process in WWTP is the presence of ˙OH in the sonolysis system with degradation efficiency directly influenced by ˙OH concentration.53 Hence, it is crucial to have a thorough and methodical comprehension of how acoustic parameters impact bubble behaviour and sonochemical activity, specifically the yield of ROS, as well as the interconnections between these factors. This information is essential for obtaining generalizable results and achieving effective ultrasound-assisted green chemistry and WWTP.
As mentioned, most studies on ultrasonic parameters have primarily investigated the impact of individual factors on the acoustic effect without considering the complex interplay of multiple variables. Thus, the presented work attempts to elucidate the impact of liquid height (reactor volume) and electric power on the ultrasonic cavitation effect throughout a wide frequency range. Three different cavitation characteristics were obtained from systematic experiments using 114 reaction settings with distinct parameter combinations. The chemical oxidation within the acoustic system was assessed by quantifying the production of ROS, including iodide oxidation radicals (IORS) and hydrogen peroxide (H2O2) yield. Spatial distribution and quantification of chemical activity were investigated through the sonoluminescence (SL) and sonochemiluminescence (SCL) for activity inside the bubbles or in the bulk, respectively. We present a systematic and intuitive demonstration of the dispersion of active bubbles and the efficiency of sonochemical oxidation under multi-parameters by modified hotspot maps and composite histograms. The relationship between different typical indicators of sonochemical activity was discussed by two correlation coefficients (Pearson's correlation coefficient and Spearman's rank correlation coefficient) for the first time. A new image processing method relying on luminesce area selection and greyscale value was introduced to address the issue of misleading data caused by photograph noise and the reflection of light from a glass reactor during the digitisation of SL/SCL images.
2. Materials and methods
2.1 Chemicals
All chemical reagents were direct used in the studies without undergoing further purification after acquisition. Luminol (5-amino-2,3-dihydro-1,4-phthalazinedione, purity ≥ 98.0%), ammonium molybdate tetrahydrate ((NH4)6Mo7O24, purity ≥ 99.0%), and sodium hydroxide (NaOH, purity ≥ 98.0%) were acquired from Sigma-Aldrich. Potassium iodide (KI, purity ≥ 99.0%) was acquired from Fisher Scientific Ltd. All solutions were prepared using distilled water from Milli-Q water (18.2 MΩ).2.2 Sonoreactor configuration
The acoustic reaction system comprises a cooling-jacketed glass cylinder with an internal diameter 67 mm and an interchangeable plate transducer (Fig. 1). The glass reactor was custom-designed and made by the University of Southampton's Scientific Glassblowing Service. Cooling water was supplied via the reactor jacket by a 20 L Cole-Palmer PolyScience MX open bath circulation system. All the plate transducers of a given frequency (22, 44, 98, 128, 200, 400, 500, 760, 1000, and 2000 kHz) were purchased from Honda electronics Co. Ltd. Each transducer comprised a 50 mm PZT piezo-electric ceramic, connected to a 100 mm diameter stainless steel vibration plate. The transducer was powered by the T&C Power Conversion AG 1006 amplifier. This amplifier model enables monitoring forward power, loading-power (10, 20, 30, and 40 W), and corresponding reflected power values. The amplifier operated in load power mode, automatically boosting power to offset any reflected power. The frequency was adjusted to minimise the resistance between the amplifier and transducer to decrease the reflected power values. A low-frequency RF impedance transformer from T&C Power Conversion functioned as a step-up transformer (SUT) and assisted in this process.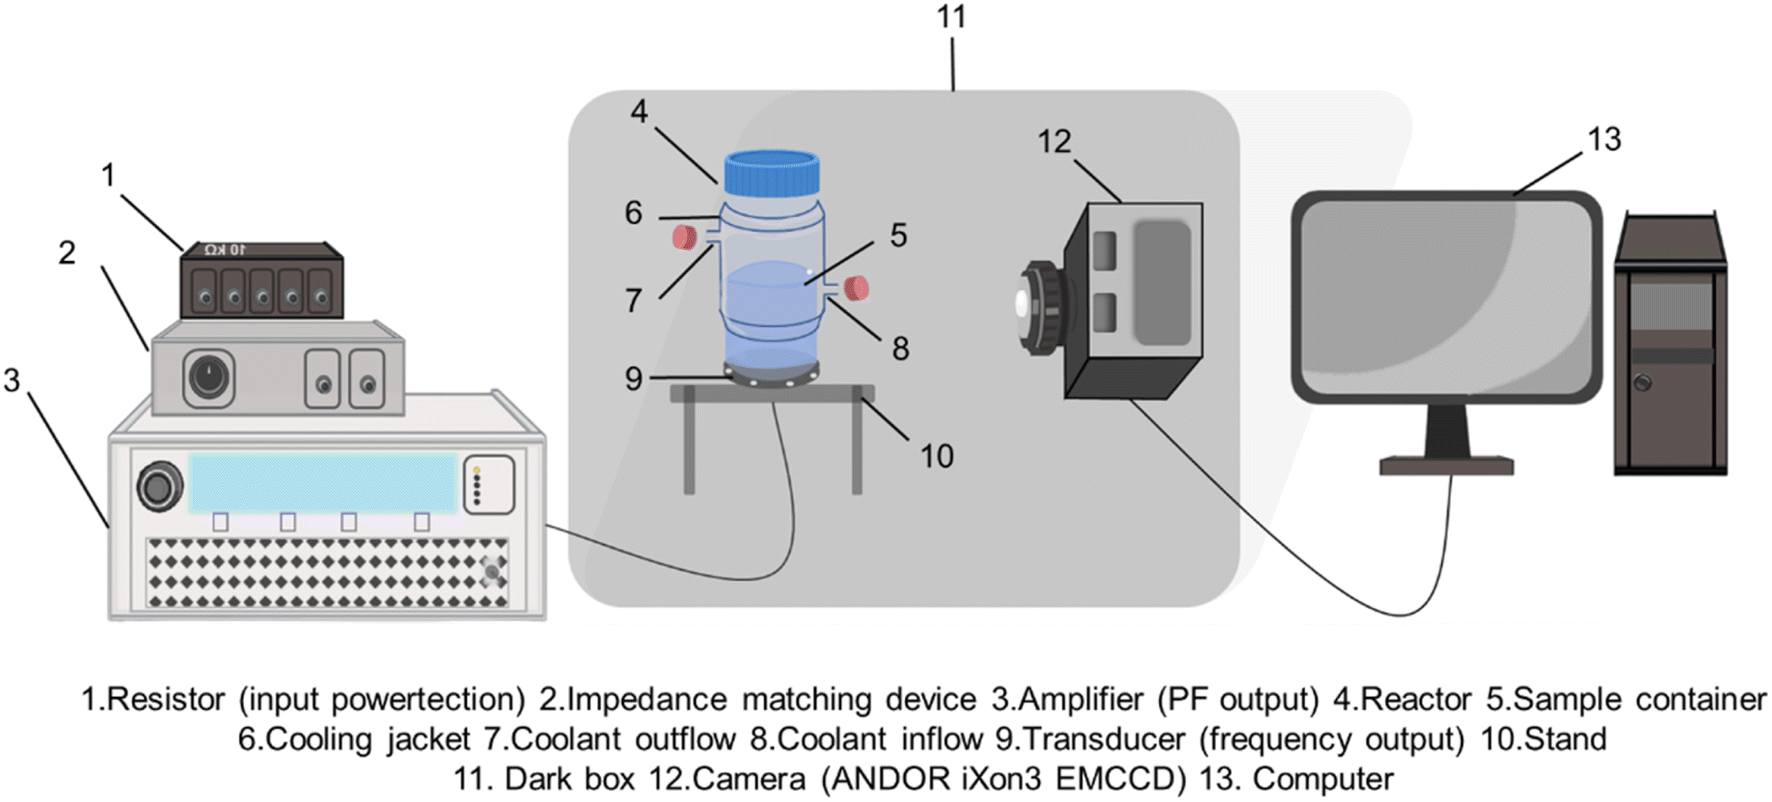 | ||
| Fig. 1 Schematic diagram of the ultrasonic system and shooting system. | ||
2.3 Experimental and analytical methods
The camera associated ANDOR software (ANDOR SOLIS for Imaging X-7827) was used as per conventional methods to perform pixel analysis on the entire captured photograph.4,29,55 In the subsequent section, this method will be referred as the ‘entirety method’ as its quantitative data is based on the whole picture. We introduced another image processing method for SL/SCL, based on a MATLAB program, to minimise subjectivity in noisy pixel data processing and eliminate the impact of reflections from glass instruments on the data (Fig. 2). The self-amending codes are provided in the ESI (Appendix A).† An analysis-threshold setting was adopted to better exclude irrelevant regions.56 Luminous areas are introduced based on binary images (Fig. 2(c)).57 The efficiency of the acoustic chemical activity in the reactor can be quantified to a certain degree through the grayscale value in the selected area (SA). The novel approach will be referred to as the ‘selective method’. A comparison of entirety method and selective method was conducted.
 | ||
| Fig. 2 Image processing based on (a) raw image, (b) photo without noise (denoised), (c) binarized photo, and (d) selected area in red. | ||
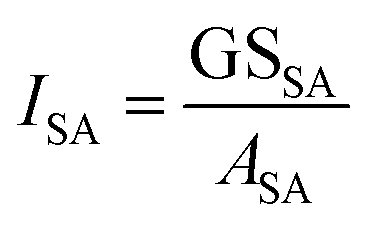
The effective luminescence area proportion was calculated from the area data by the selective method, and this outcome used to indicate the collapse effectiveness of each reactor (eqn (1)).
 | (1) |
The average luminescence intensity inside the active region was calculated viaeqn (2).
 | (2) |
The oxidation of KI under ultrasound is generally considered to be the result of the following reaction with OH radicals:
| 2˙OH + 2I− → I2 + 2OH− | (3) |
However, it is worth noting that KI as a chemical probe is limited in its selectivity for ˙OH. Several works pointed out that the primary oxidant in the sonochemical reaction may not always be the ˙OH radical, but sometimes the O radical,58 and pointed out that the O radical may react in the KI oxidation reaction:59,60
| O + 2I− + 2H+ → I2 + H2O | (4) |
Additionally, when the subject is studied under an open system in an air environment.4 The limited selectivity results from the generation of nitrous acid from dissolved nitrogen during sonication, which oxidises iodide ions.61,62 Taking into account the potential of the ultrasonic oxidation and the experimental atmosphere, the determined yield of I3− was used to signify the overall IORS production, excluding H2O2 introduced to the KI solution by ultrasonic irradiation and without pointing solely to ˙OH.
The generation rate of ROS during the ultrasonic process adheres to a zero-order reaction kinetics model, meaning the data point obtained after 10 minutes of irradiation is sufficient to determine the rate constant.29,60 Here, for the measurement of the relative concentration of IORS, 0.1 M KI solution was irradiated under the same conditions as for SL/SCL, and 2 ml samples were taken and tested by UV-vis (Thermo Scientific Evolution 201 UV-visible spectrometer) at 350 nm wavelength after each 10-min irradiation. IORS yield was calculated using the Beer–Lambert Law with a cuvette length of 1 cm and a molar absorptivity coefficient (ε) of 26![[thin space (1/6-em)]](https://www.rsc.org/images/entities/char_2009.gif) 303 L mol−1 cm−1.17 Each experiment was repeated at least 3 times.
303 L mol−1 cm−1.17 Each experiment was repeated at least 3 times.
H2O2 produced during sonication reacts slowly with the iodide in the KI solution; thus a catalyst is required for reaction (eqn (5)) to occur28,63
| H2O2 + 2I− → I2 + 2OH− | (5) |
Hence, 0.5 mM ammonium molybdate was used as the catalyst in 0.1 M KI solution to account for the generation of total ROS (H2O2 and IORS). The measurement and calculation principles align with the pathway to obtain the IORS yields in pure KI under the acoustic process. The H2O2 yield could be derived by subtracting the IORS yield in pure KI from the total ROS.28
The Pearson correlation coefficient, commonly represented as r, is a statistical metric that quantifies the magnitude and direction of a linear association between two variables (eqn (6)).65
 | (6) |
![[x with combining macron]](https://www.rsc.org/images/entities/i_char_0078_0304.gif) , ȳ = the average value of variable x and variable y.
, ȳ = the average value of variable x and variable y.
The variable ‘r’ ranges from −1 to 1. A value of r = 1 implies a linear increase that follows a strong positive correlation. A value of r = −1 shows a strong negative correlation. A value of r = 0 shows the absence of any linear correlation. The Pearson correlation coefficient is appropriate for quantifying linear associations.
Considering, the intricate nonlinear characteristics of the ultrasound process may result in complex nonlinear interactions among numerous acoustic measurements, rather than straightforward linear ones.66,67 Spearman's rank correlation coefficient, symbolised as ρ, not supposing a linear relationship between variables68 may be more appropriate for elucidating the correlations among SL, SCL, and ROS, as well as their responses to variations in acoustic circumstances. The derived monotonicity results may elucidate complex connections in sonochemical processes and offer direction for experimental improvement. The calculation of this metric relies on the ranking of variables rather than the raw data, making it suited for non-linear yet monotonic connections (eqn (7)).
 | (7) |
The ρ ranges from −1 to 1. A value of ρ = 1 implies a complete positive correlation, meaning that the variables have identical ranks. A value of ρ = −1 implies an exact negative correlation, meaning that the variables have precisely opposite rankings. A value of ρ = 0 implies the absence of a monotonic relationship between the two variations. Spearman's rank correlation coefficient is computed from the ranks of the observations and is unaffected by the data's distribution. It is less affected by extreme values and is appropriate for non-normally distributed data.
3. Results and discussion
3.1 Validation of the novel image processing method (selective method)
The intensity of SL emission is related to the highest temperature achieved by a collapsing cavitation bubble, and associated luminescent species.69 The intensity of SCL emission is caused by the reaction between luminol molecules and superoxide anion radicals (˙O2−) or ˙OH.4,70 Bubble characteristics are often assessed by measuring the emission intensity of SL and SCL.28,71,72Initially, the ANDOR camera and its accompanying software, ANDOR SOLIS for Imaging X-7827 was used for all processing. The software was configured to a scale mode ranging from 293 to 3159 to accurately reflect all pixel values in the photo. The image size, measured in pixels, is 1005 pixels wide and 1002 pixels high. No further adjustments were made. The SL and SCL photographs' total counts obtained from ANDOR system was exhibited under all testing ultrasonic input parameters (Fig. 3). The data collection indicates higher values at ultrasound frequencies below 200 kHz (excluding 200 kHz).
 | ||
| Fig. 3 The luminescence (a) SL and (b) SCL intensities measured from complete photo (entirety method). | ||
Fig. 4 shows the qualitative comparison of SL and SCL intensity and spatial distribution at 300 ml reactor volume (images for the 200 and 400 ml are presented in Fig. S1 and S2,† respectively). The systematic photos clearly illustrate that both SL and SCL demonstrate greater intensity at ultrasonic frequencies ranging from 200 to 760 kHz. This outcome is incongruous with the direct digitalization of images given via the ANDOR software. The brightness digitization process is distorted by the noise signals found in the image with the lower real brightness, leading to misleading results.
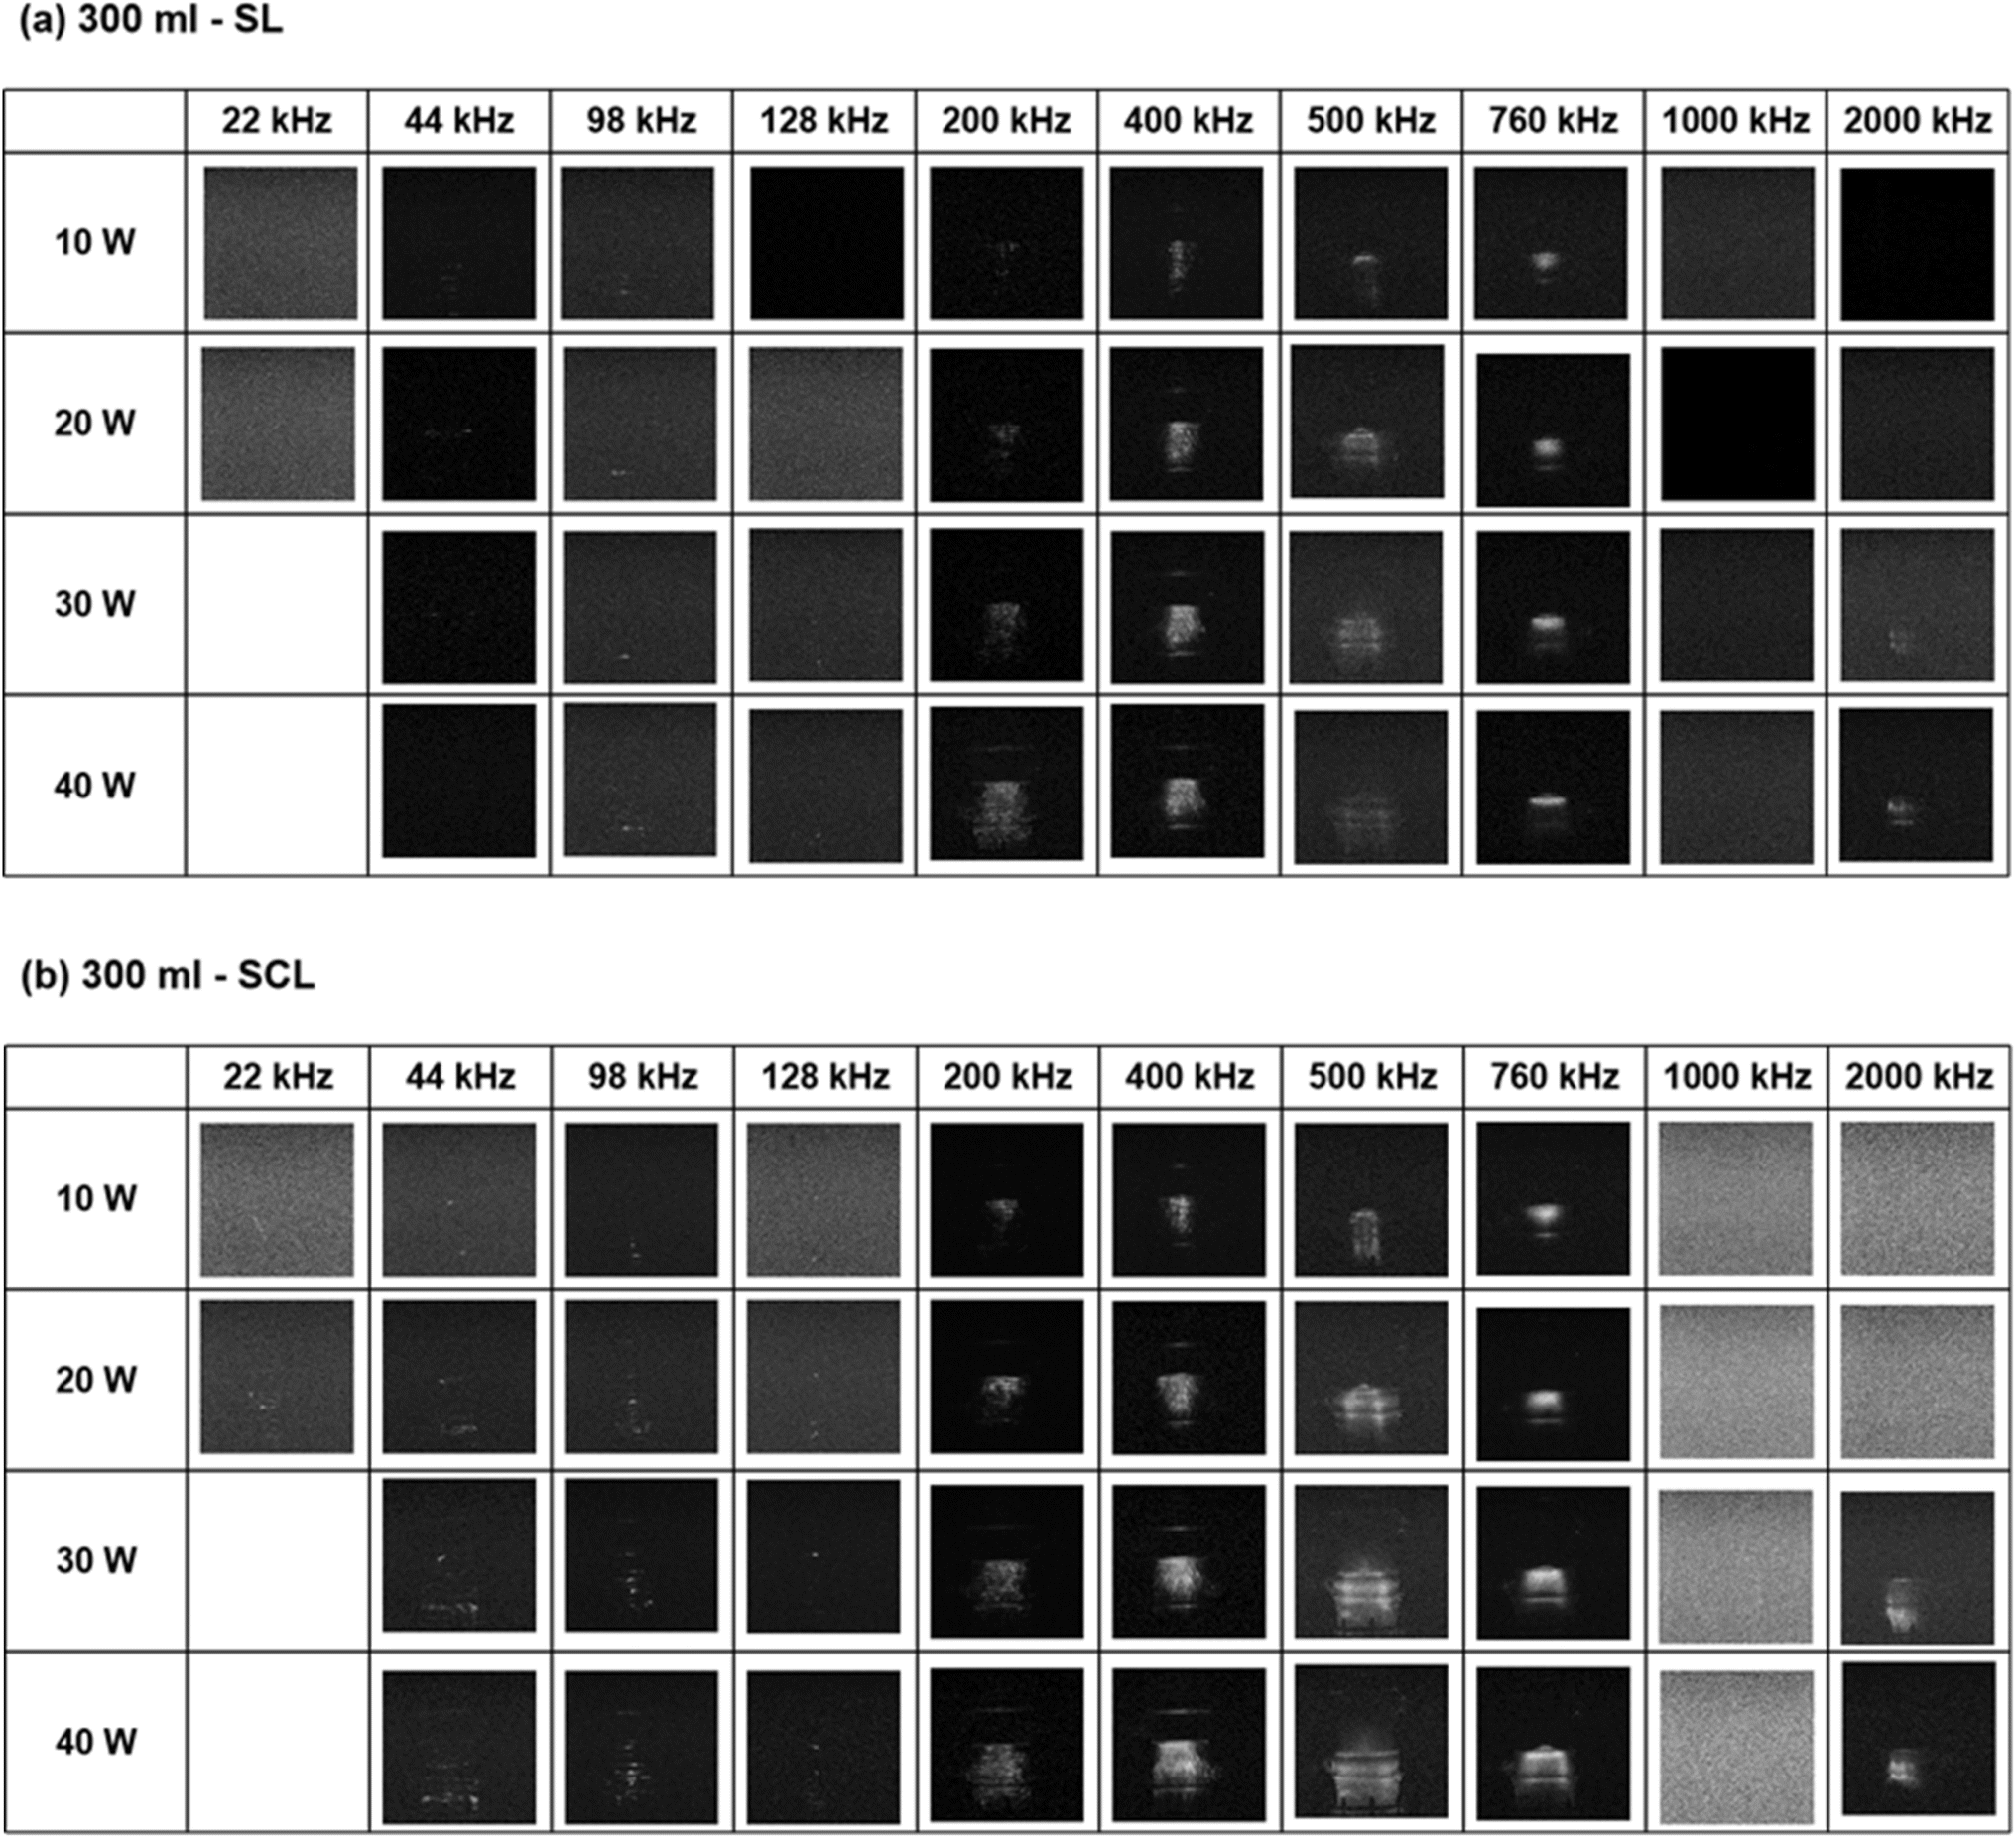 | ||
| Fig. 4 Sono-/sonochemi-luminescence intensity distribution for all testing frequencies and powers at 300 ml reactor volume: (a) SL and (b) SCL. | ||
Four main factors cause noise in photographs captured under low-light conditions, commonly seen in normal photography.73,74 (1) The camera's increasing photosensitivity (ISO). To capture more accurate data graphs and more detailed information, the ISO of the camera is typically increased. However, this also amplifies noisy signals while enhancing small signals. (2) The signal-to-noise ratio (SNR) diminishes. When there is less light, the intensity of the image weakens, causing an increase in the visibility of random noise. (3) The emergence of thermal noise. Thermal noise occurs when the camera sensor's increased temperature causes electrons to move randomly and more vigorously, especially during longer exposure durations or while employing high ISO settings. (4) Amplification effects intensify the noise in image regions that have a weak signal, such as dark areas and shadows.
The camera's sensitivity remains the same during the shooting process. The ANDOR camera, as a high-performance device, is equipped with an advanced cooling system that efficiently controls the sensor's temperature, thus reducing the generation of thermal noise. Accordingly, the main reason for deceiving noise data in SL and SCL images is the poor signal-to-noise ratio and the amplification effect of low light emission.
We sought to introduce a methodology that could enhance the accuracy of quantitative results through noise reduction. Based on the reference method,56,57 we define the grayscale value as 0 to 255 to reflect brightness differences. Furthermore, this method starts with intelligent pre-noise reduction of the complete image through MATLAB built-in programme statements (Fig. 2(b)).75 Then the appropriate range of luminance in the image is selected based on the binarised image (Fig. 2(c and d)). The specified area captured the grayscale values, theoretically improving the object's quantitative precision.
The images' pixel values obtained from the ANDOR approach and the selective method were compared for all testing conditions in SL and SCL (Fig. 5). In contrast to the data collected through the original methodology, the region selection method's findings show greater digital values above 200 kHz, indicating a higher intensity of both SL and SCL at frequencies under these sonic conditions. This matches the findings of visuals taken within an enclosed dark box (Fig. 4, S1 and S2†). Empirical evidence suggests that selective methods are more reliable for quantitative studies across a broad range of parameters.
 | ||
| Fig. 5 Image digitalization date of sono(chemical) luminescence intensity from the selective method ((a) SL and (c) SCL) and entire method ((b) SL and (d) SCL). | ||
To evaluate the suitability of the selective method, a subset of SCL images were selected to extract digital values and conduct a more detailed analysis (loading-power 40 W, volume 400 ml, Fig. 6 and 7). The displayed images are subjected to colour inversion to enhance visibility, where greater pixel values correlate to darker regions of the image (Fig. 7). This pathway could also potentially enhance our perception of the original image's signal to noise ratio. The SCL emission intensities at 40 W and 300 ml showed notable differences at low (44, 98, and 128 kHz), medium (200, 400, 500, and 760 kHz), and high (1000 and 2000 kHz) frequencies using separate approaches. According to the findings provided by the entirety method, the intensity of SCL emission at low frequencies seems comparable to that at medium frequencies (Fig. 7). Nevertheless, the findings obtained by applying the selective method better match the actual scenario (Fig. 6(a–g) and 7 (red)). The subset of SCL images, consisting of colour-reversal format photographs, illustrates that the light emission images at five distinct frequencies (44, 98, 128, 500, and 1000 kHz) exhibit elevated levels of greyscale in the empty region (Fig. 6). The presence of disruptive signals in the silent sections led to errors in the quantification process of the data from the whole photo, both at low and high frequencies (Fig. 7 (blue)). The distortion was especially noticeable at 1000 kHz (Fig. 6(h) and 7). Thus, it is reasonable to conclude that the results obtained through the selective method demonstrate acceptable reliability.
 | ||
| Fig. 6 SCL emission at 40 W loading-power, 400 ml reactor volume, and frequencies with (a–c) f < 200 kHz, (d–g) 200 kHz ≤ f < 1000 kHz, and (h and i) f ≥ 1000 kHz. Image colour-reversal. | ||
 | ||
| Fig. 7 Extracted digital value from the selective (red) and entirety (blue) methods for SCL intensity under 40 W and 400 ml. | ||
When high-quality luminescence photographs can be acquired, typically at mid-frequency (200 kHz ≤ f ≤ 760 kHz), the quantitative data collected through both procedures demonstrated an identical variation tendency (Fig. 5 and 7). The selective method can enhance accurate data acquisition in a broader variety of experimental settings by circumventing misleading signals. Thus, for the following study of emission intensity for SL and SCL, quantitative analyses uses image digitation through the selective method.
3.2 SCL, SL and ROS measurements
The subsequent section presents the findings of the SCL/SL activity and KI dosimetry. All the powers mentioned in the results are loading-powers (PL). The loading-power density (PDL) were calculated through eqn (8) | (8) |
 | ||
| Fig. 8 Relationship between SL intensity with frequencies, power and reactor volume ((a) 200 ml, (b) 300 ml and (c) 400 ml). | ||
 | ||
| Fig. 9 Relationship between SCL intensity with frequencies, power and reactor volume ((a) 200 ml, (b) 300 ml and (c) 400 ml). | ||
Frequencies 400 and 500 kHz seem to be the most effective for SL. These frequencies of irradiation not only generate the most intense luminescence but also encompass a broad, effective area of sonoluminescence. This phenomenon could be attributed to the resonance conditions of the bubbles being well-matched to the properties of the acoustic waves at these frequencies.76 As a result, there is an efficient conversion of energy and a broad variety of cavitation effects. The increase in power density results in an increasing influx of energy into the bubble core, which benefits SL activities. The positive impact of power on overall SL intensity becomes more significant at frequencies of 200 kHz compared to lower frequencies. One reason is that as the irradiation frequency increases, the number of bubbles in the reactor also increases. Additionally, the boundary or attenuation effects in cavitation caused by excessive energy input should not be ignored.1 The adverse impact of extra high-power loads is demonstrate by the average luminous intensity or effective luminous area of the SL at lower frequencies. In a 44 kHz system, an increase in power will invariably result in a drop of at least one unit in the effective luminous area or average brightness of the SL. In a 98 kHz system, the average emission intensity of the SL consistently diminishes with increasing power. The data for effective luminous area are presented in the appendix (Tables S3 and S4†).
The frequency of 500 kHz is the optimal choice for SCL in these conditions, since it consistently demonstrates a significant intensity and luminescent area across various liquid heights and power settings (Fig. 9). Under conditions of high-power density, frequencies of 400 and 760 kHz also demonstrate favourable outcomes. The SCL frequency that have high brightness and active area are in the medium frequency (200 kHz ≤ f ≤ 760 kHz) range, gaining similar outcomes to SL. Augmenting power can greatly amplify the intensity of SCL and expand the area of luminescence. The increasing of SCL overall intensity with increasing power is typical.77 No attenuation from the extra power input, distinguish to those shown in the SL results, were detected at frequencies ranging from 22 to 128 kHz. In general, increasing the volume can result in a wider area of luminescence and enhance the overall SCL intensity (Fig. 5(c)). Nevertheless, as the volumes increase, the proportion of the SCL area to the entire reactor decreases (Fig. 10). Throughout the entire test frequency range, as the liquid level height increases, the SCL region consistently remains close to the liquid surface, exhibiting elongation and narrowing in the vertical direction. A representative set of SCL images is shown in Fig. 11. As the solution volume increases, the SCL zone moves farther away from the bottom of the reactor, resulting in a decrease in the proportion of the luminescence region in the total reactor. The same regular situation was observed in the tests of SCL under other conditions (Fig. 4(b), S1(b) and S2(b)†).
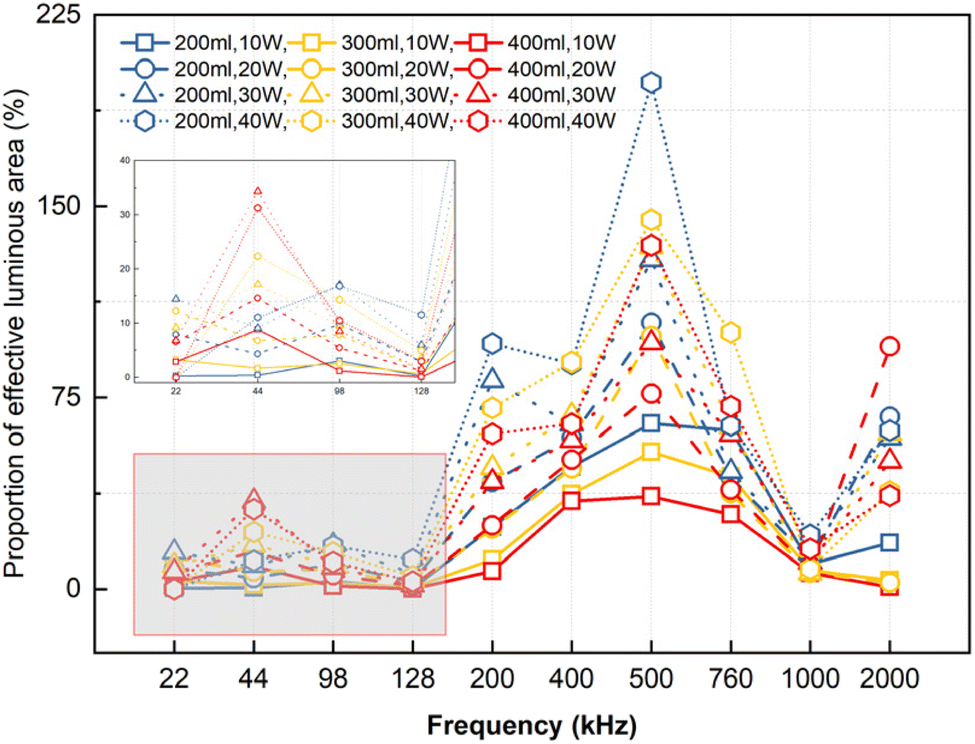 | ||
| Fig. 10 The variation of effective SCL area with frequency, power, and volume. | ||
 | ||
| Fig. 11 SCL distribution in different solution volumes under 44 kHz (a–c), 500 kHz (d–f) and 200 kHz (g–i). | ||
There are a few noteworthy findings from SCL results. The effective area of SCL at 44 kHz increases with increasing liquid height (Fig. 10 and 11(a–c)). This differs from the results at other frequencies. At liquid levels of 200 and 300 ml in the reaction system, the SCL exhibited a nearly complete distribution of effective luminescence across the reactor at a frequency of 500 kHz (Fig. 11(d and e)). In the travelling wave field, the resonant bubbles with SCL characteristics were directed towards the liquid surface by radiation force.66 The radiation force also induces deformation at the liquid–air contact. At low intensity, the deformation resembles a concentric annulus (Fig. 11(a–c) and (g–i)); at high intensity, an auditory fountain manifests as droplets erupt forcefully (Fig. 11(d–f)).78,79 Consequently, under specific working conditions, the effective area of the SCL exceeds 100% (Fig. 10). These findings suggest that each frequency of ultrasound will have an associated ideal solution height to maximise efficiency and provide a more uniform sonication process.
Based on the findings from both SL and SCL, alterations in the luminescent area had a more significant influence on the total sono(chemi)luminescent activity and efficiency levels compared to changes in the average luminescence intensity (Fig. 5(a and c), and Tables S3 and S5†). According to these results, we classify the area of sono-active bubble behaviour into three separate ranges of ultrasonic frequencies: f < 200 kHz, 200 kHz ≤ f ≤ 760 kHz, and 1000 kHz ≤ f ≤ 2000 kHz, in this reactor set-up.
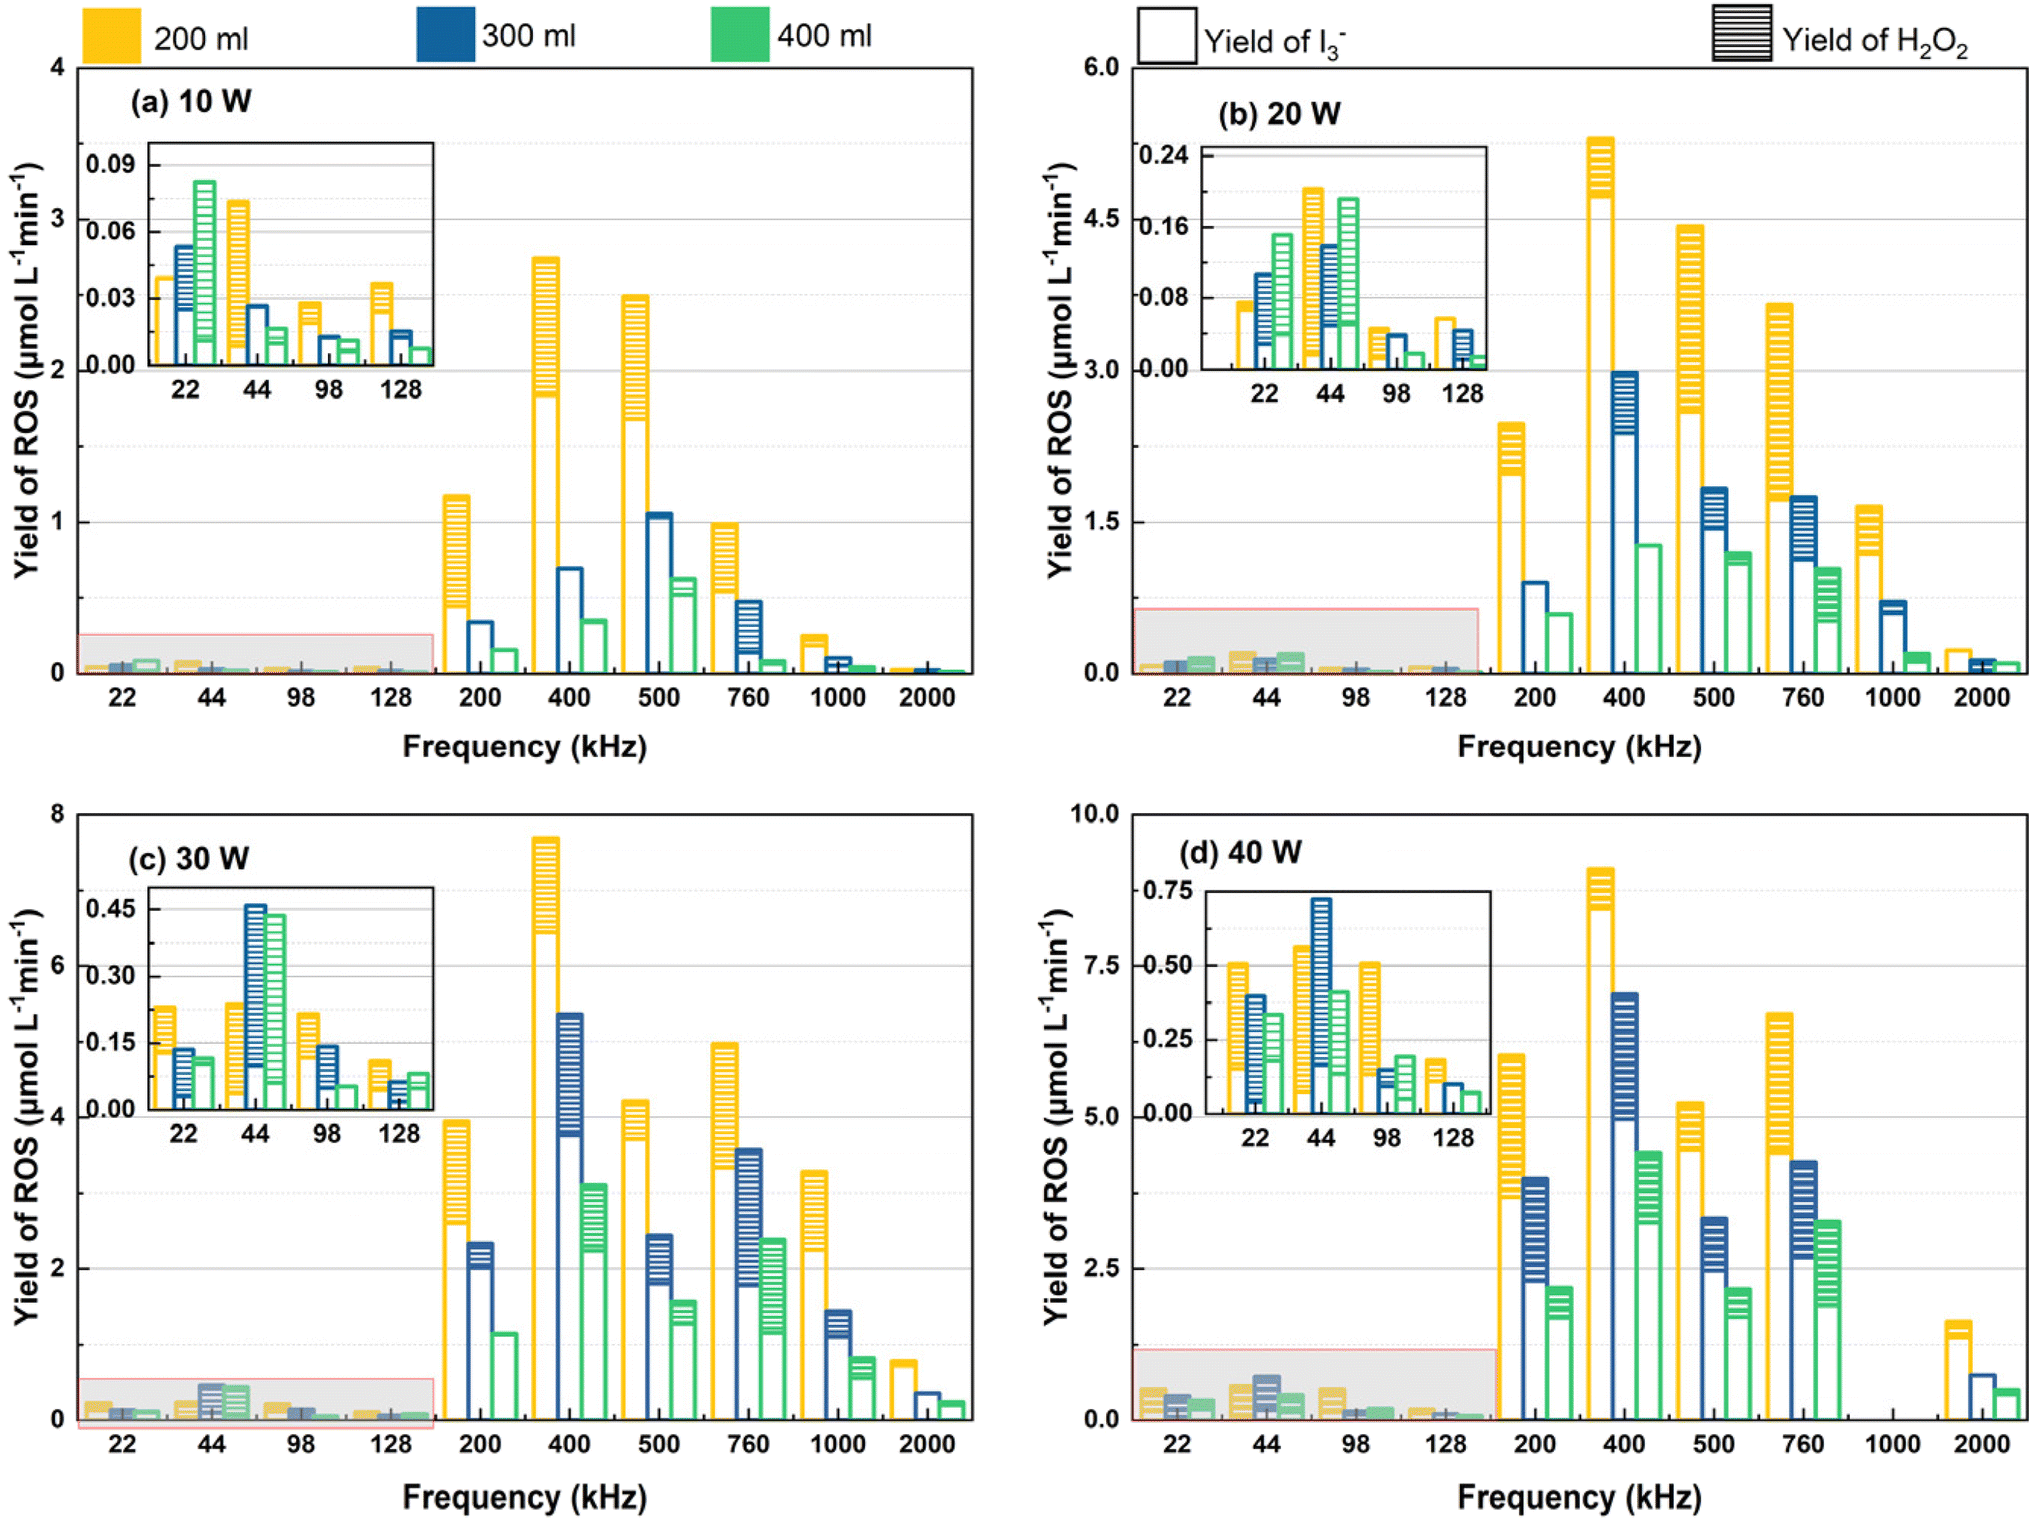 | ||
| Fig. 12 The dosimetry results for quantification of IORS, H2O2 and total ROS with different frequencies and solution volume: (a) 10 W, (b) 20 W, (c) 30 W and (d) 40 W. | ||
The overall production of ROS is greater at 400 and 500 kHz, whatever the operating conditions. Nevertheless, the application of greater amplitude (power ≥ 20 W) at a frequency of 760 kHz significantly enhances the reaction system's oxidising capability. The oxidant ability almost aligns with the three distinct frequency intervals discussed in sono(chemi)luminescence. The systems with medium frequency (200 kHz ≤ f ≤ 760 kHz) ultrasound can generate higher concentrations of ROS than low and high-frequency irradiated systems.
At low frequencies (22 kHz ≤ f ≤ 128 kHz), the primary ROS generated are H2O2 (Fig. 12). However, as the system frequency reaches 200 kHz, the proportion of IORS in the overall ROS rises. The ROS (mainly ˙OH) are dispersed through two pathways into the liquid. The majority of ROS are released into the medium through the collapsing bubble, while some diffuses into the solution through the bubble wall.25 Bubbles generated with low-frequency irradiation have larger critical dimensions due to extended expansion durations and compared to those formed at higher frequencies.81 This phenomenon enables bubbles formed at low frequencies to reach higher temperatures and to vaporise a greater number of water molecules before collapsing.82,83 The ˙OH that is confined within the bubble for a longer duration experiences a recombination reaction, leading to a greater H2O2 proportion of a lower total ROS in liquids exposed to low-frequency ultrasound (Fig. 13).
 | ||
| Fig. 13 H2O2 proportion of total ROS yield with different frequencies and solution volume: (a) 10 W, (b) 20 W, (c) 30 W and (d) 40 W. | ||
The system's oxidative characteristics are significantly enhanced by increasing power, and this improvement is primarily shown in the total ROS generation (Fig. 12). The liquid's level affects the energy distribution and propagation path of sound waves within the ultrasonic system using the plate transducer. The correlation between ROS yield and variations in liquid height at a power density of 100 W L−1 is shown in Fig. 14. As the liquid height increases, the yield of ROS exhibits a marginal decline in the medium frequency (200 to 760 kHz) and a rise in the low-frequency range (22 to 128 kHz). This alteration trend is associated with the frequency-dependent cavitation threshold.84 In contrast to the influence of volume on power density or energy distribution, the impact of liquid height on energy transfer is comparatively less. Within a similar reactor, the restricted influence of height on sonochemical activity was previously observed.5
 | ||
| Fig. 14 Correlation between liquid height and ROS yield at different frequencies with same power density (100 W L−1). | ||
3.3. Correlation between sonochemical/luminescent activities
Visualisation of the distribution of activity, and active bubbles are achieved through sono(chemi)luminescence, and chemical processes measured via SCL and ROS. Through a comprehensive analysis of the impact of ultrasonic frequency, power, and liquid height on sono(chemi)luminescent activity and ROS yield, we have determined that adjusting these acoustic parameters is essential in building an efficient acoustic system. The activity of SL and SCL and the production of ROS of the sonicated reaction system were increased in the middle-frequency range, particularly at 400 and 500 kHz. The cavitation effect was optimised, resulting in a substantial increase in the chemical activity of the reaction system, particularly when operating at high power and with low liquid levels. To better understand these phenomena, an analysis will be conducted on the interrelationships among these sonochemical features. | ||
| Fig. 15 The correlation coefficients between I3− yield, H2O2 yield, total ROS yield, SL intensity and SCL intensity. | ||
The correlation coefficient evaluation revealed an extremely strong positive association between the yield of I3− and the total generation of ROS, i.e. ρtotal ROS yield vs. I3− yield = 0.98, and rtotal ROS yield vs. I3− yield = 0.99. This indicates that most of the ROS generated in the reaction cell from ultrasonic irradiation could be measured using potassium iodide dosimetry, even without the use of a catalyst. Hydrogen peroxide (H2O2) is a significant by-product of the secondary reaction involving the ˙OH follow the reaction as
| ˙OH + ˙OH → H2O2 | (9) |
The amount of H2O2 generated depends on the amount of ˙OH released and the efficiency of the subsequent recombination reaction.85 Typically, the powerful oxidising ability of the hydroxyl radical causes its yield to substantially impact the efficiency of chemical reaction, including but not limited to pollutant degradation/water disinfection achieved via ultrasound treatments.86–88 In water mediated reaction, the bulk of IORS are mainly explained by the hydroxyl radical yield, which is based on the theory of molecular sonolysis, denoted ‘)))’, as28,89
| H2O + ))) → ˙OH + ˙H | (10) |
The positive correlation between changes in I3− yield and changes in SL intensity was stronger than that of SCL, but the change was not strictly monotonically linear, i.e. ρtotal ROS yield vs. SL intensity = 0.78 > ρtotal ROS yield vs. SCL intensity = 0.72, and rtotal ROSs yield vs. SL intensity = 0.70 > rtotal ROS yield vs. SCL intensity = 0.48. These results explain why some studies acknowledge a strong link between ROS yield and SL intensity,54 whereas other investigations provide results that do not align with this observed trend.4,28 Different test parameters always produce different findings, which is why this inherent correlation is always predicated on those differences. Based on the systematic test results of the present investigation, it can be concluded that there is a positive relationship between ROS yield and SL in most circumstances. Nevertheless, it is important to thoroughly investigate the presence of exceptional circumstances.
 | ||
| Fig. 16 The correlation between I3− and SCL generated during sonication (testing frequencies are labelled (kHz)): (a–c) 40 W, (d–f) 30 W, (g–i) 20 W and (j–l) 10 W. | ||
The disparities could be attributed to the mechanism of sonochemistry, which is directly influenced by the rate at which the active species is transferred to the solution.90 The abrupt implosion of cavitation bubbles undergoes non-linear growth during the ultrasonic process, which can result in extreme scenarios where heat and mass transmission deviate from the linear model.54,90 Additionally, the luminescence mechanism of SCL is formed by a chemical reaction between luminal molecules and ˙O2− and ˙OH radicals produced within the cavitation bubble.70 The luminol molecule comprises polar and nonpolar elements. Polar elements, such as amino and carbonyl groups, render the molecule hydrophilic, whereas nonpolar components, like the benzene ring, tend to avoid polar water molecules and prefer interaction with nonpolar atmospheres. At the gas–liquid interface, the hydrophobic segment of the luminol molecule may orient toward the gas phase. This amphiphilic molecule may autonomously move to the gas–liquid boundary, reducing the exposure of the hydrophobic portion to the liquid while maintaining the interaction of the hydrophilic portion with the liquid phase.91 Luminol's activities follow amphiphilic molecular characteristics, indicating an affinity for the bubble's surface.92,93 Therefore, we theorise that the sonochemical activity triggered by SCL is primarily concentrated in the vicinity of the bubble surface.94 The complex variations in acoustic pressure cause intricate non-linear characteristics in the waveform and affect the dynamics of the gas–liquid interface through the absorption and release of energy by cavitation bubbles.95,96 However, KI dosimetry measures the response of ROS (mainly ˙OH and H2O2) by assessing the formation of iodine complexes in the entire solution. Dosimetry results demonstrate the oxidation that sonication imparts into the entire reaction.
Besides the variation in the reaction's location, SCL and KI dosimetry may exhibit distinct excitation conditions. In Fig. 16, each row depicts a system with the same power input but decreasing power densities and increased volume (left to right). As the liquid height increased/power density decreased, SCL intensity increased (x-axis) rose dosimetry yields declined (y-axis). This suggests that with an ultrasonic system, SCL is more likely to happen than dosimetry.
 | ||
| Fig. 17 The correlation between I3− and SL generated during sonication (testing frequencies are labelled (kHz)): (a–c) 40 W, (d–f) 30 W, (g–i) 20 W and (j–l) 10 W. | ||
The production of both ROS and SL are affected by the number of active bubbles and collapse intensity in multi bubble system, which is complex. Both are influenced by the interaction between the multi-parametric effects, i.e. driving effects, physical force and so on.22 The maximum temperature of the active bubbles is thought to be the primary determinant of SL intensity54 whereas the average temperature inside the bubble might represent the primary factor influencing the generation of most radicals represented by ˙OH.97 Once the temperature exceeds the optimal temperature for radical yield, the oxidation reactions will be diminished through secondary processes, such as nitrogen oxidation or super-oxidation reaction.98 Power density seems to be an important factor influencing the SL and I3− yield's positive correlation divergence point. In our settings, the oxidative characteristics of the reaction induced by ultrasound at a power density of 50 W L−1 result in I3− yields practically identical at 400 and 500 kHz (Fig. 17(i and j)). This slight difference may stem from variations in axial direction energy attenuation attributable to the liquid level's height.99 In the studied system, the divergence points of the SL and I3− correlations consistently occur at 400 kHz for PDL > 50 W L−1 (Fig. 14(a–h)), and at 500 kHz for PDL < 50 W L−1 (Fig. 14(k and l)). The effect of the liquid height appears to be more reflected in the impact of the reactor volume on power density. 500 kHz systems have greater quasi-acoustic and acoustic streaming compared to 400 kHz system.22,66 This liquid flow pattern, which facilitates bubble de-conglomeration and oscillation and enhances free radical release, has the potential to facilitate the sonochemical activity under low pressures for cavitation.89,100
The ultrasonic system can be categorized into three main regions for chemical reactions, inside the bubble core, at the interfacial region and in the bulk solution. The intense environmental conditions in the bubble core play a crucial role in the breakdown of gas molecules, generating free radicals.25 Simultaneously, a portion of the generated radicals will also experience reforming reactions (Fig. 12). This result is confirmed by the high correlation between ROS generation and SL intensity. A high intensity of SCL indicates that more reactions occur at the interface between the gas and liquid phases. However, this reactivity observed at the gas–liquid interface is not consistent with the reactivity of the entire solution (bulk). At 500 kHz, the SL output demonstrates optimal results, indicating effective cavitation oscillation and collapse within the system. The equivalent outcomes of the SCL corroborate this. Nevertheless, the dosimetry data did not exhibit consistency, and the results revealed a lower oxidation of iodine ions at 500 kHz. The dosimetry data demonstrated effective iodide oxidation in the system with 400 or 760 kHz, unlike the optimal SCL (i.e. at 500 kHz). According to the preceding discussion, systems that favour one activity (SCL/SL/ROS etc.) may not be beneficial for another as previously observed.4 Although such interactions must be based on the adequate cavitation level within the specified system. Therefore, the sonochemical activity that drives SCL is likely different from the ultrasonic oxidation by ROS.
4. Conclusions
Varying parameter configurations can result in variations in the bubble properties of the reaction system. Sono(chemi)luminescence and KI dosimetry allow for the visualization and quantification of these changes and reflect the acoustic process. This work introduces a novel method for digitizing sono(chemi)luminescence images, which allows for the quantification of SL and SCL data across a broader range by selectively targeting regions.The extensive experimental data and correlation coefficients were used to examine the variations in the behaviour of bubbles created by ultrasound under different operating settings. Based on the results of three types of sonochemical characteristics (SL, SCL and ROS), the sonic reactivity is categorized into three distinct zones according to the frequency of irradiation (low-frequency: 22 kHz ≤ f ≤ 128 kHz, medium-frequency: 200 kHz ≤ f ≤ 760 kHz and high-frequency: 1000 kHz ≤ f). It has been verified that acoustic systems exposed to intermediate frequencies (200 kHz ≤ f ≤ 760 kHz) typically exhibit greater total cavitation intensity and reactivity.
The results of independent cavitation characteristics gained under varied operating parameters were used for the computation of correlation coefficients (r and ρ) to explore their relationship. The distinction between the varieties of sonochemical reactions was validated through the low coefficient value, like rI3− yield vs. SCL intensity = 0.46 and rH2O2 yield vs. SCL intensity = 0.41. This difference can be attributed to variation in the reaction's location, and alternate reaction energies and mechanisms.
The Spearman's rank correlation coefficient of 0.78 between total ROS generation and SL intensity suggests a robust positive correlation between these two cavitation characteristics. The ρI3− yield vs. SL intensity = 0.82 > ρH2O2 yield vs. SL intensity = 0.56 indicates that this positive connection mostly arises from the positive relationship between I3− yield and SL intensity. IORS are the primary ROS generated by ultrasonic irradiation, as corroborated by the correlation coefficient values (rI3− yield vs. ROS = 0.99 and ρI3− yield vs. ROS = 0.98). This positive correlation consistently diverges at a point dependent on the system parameters, which in our experimental configuration may occur at 400 or 500 kHz, based on each system's power density.
Data availability
Data will be made available on request.Conflicts of interest
There are no conflicts to declare.Acknowledgements
The authors would like to thank Ben Gibbons, Yusuf EI-Hassan, and Matthew Crick, laboratory technicians from the University of Surrey's School of Chemistry and Chemical Engineering, for their assistance in finishing this project. This work was partially supported by the University of Surrey-Nanjing Tech University joint PhD training program.References
- D. Meroni, R. Djellabi, M. Ashokkumar, C. L. Bianchi and D. C. Boffito, Sonoprocessing: from concepts to large-scale reactors, Chem. Rev., 2021, 122(3), 3219–3258, DOI:10.1021/acs.chemrev.1c00438.
- M. Zupanc, T. Kosjek, M. Petkovšek, M. Dular, B. Kompare and B. Širok, et al., Shear-induced hydrodynamic cavitation as a tool for pharmaceutical micropollutants removal from urban wastewater, Ultrason. Sonochem., 2014, 21(3), 1213–1221, DOI:10.1016/j.ultsonch.2013.10.025.
- N. A. Fernandez, L. Rodriguez-Freire, M. Keswani and R. Sierra-Alvarez, Effect of chemical structure on the sonochemical degradation of perfluoroalkyl and polyfluoroalkyl substances (PFASs), Environ. Sci.:Water Res. Technol., 2016, 2(6), 975–983 RSC . https://rsc.66557.net/en/content/articlehtml/2016/ew/c6ew00150e.
- R. J. Wood, J. Lee and M. J. Bussemaker, Disparities between sonoluminescence, sonochemiluminescence and dosimetry with frequency variation under flow, Ultrason. Sonochem., 2019, 58, 104645, DOI:10.1016/j.ultsonch.2019.104645.
- T. Sidnell, J. Hurst, J. Lee and M. J. Bussemaker, Increasing efficiency and treatment volumes for sonolysis of per-and poly-fluorinated substances, applied to aqueous film-forming foam, Ultrason. Sonochem., 2024, 106866 CrossRef CAS PubMed . https://www.sciencedirect.com/science/article/pii/S1350417724001147.
- M. Ashokkumar, F. Cavalieri, F. Chemat, K. Okitsu, A. Sambandam, K. Yasui and B. Zisu, Handbook of Ultrasonics and Sonochemistry, Springer Singapore, 2016 Search PubMed.
- K. S. Suslick, Mechanochemistry and sonochemistry: concluding remarks, Faraday Discuss., 2014, 170, 411–422 RSC . https://rsc.66557.net/en/content/articlehtml/2014/fd/c4fd00148f.
- X. Liu, Y. Li, L. Zeng, X. Li, N. Chen and S. Bai, et al., A review on mechanochemistry: approaching advanced energy materials with greener force, Adv. Mater., 2022, 34(46), 2108327, DOI:10.1002/adma.202108327.
- G. Cravotto, E. C. Gaudino and P. Cintas, On the mechanochemical activation by ultrasound, Chem. Soc. Rev., 2013, 42(18), 7521–7534 RSC . https://rsc.66557.net/en/content/articlehtml/2013/cs/c2cs35456j.
- Z. Xie, V. Mahendran, U. S. Jonnalagadda, Q. Fan, X. Su and A. F. Fischer, et al., Boosting energy efficiency and selectivity of glucose oxidation to glucuronic acid in high frequency ultrasound using multicavity CuO catalytic cavitation agents, Green Chem., 2024, 573–585 Search PubMed , https://rsc.66557.net/en/content/articlehtml/2024/gc/d4gc03775h.
- E. Gonze, L. Fourel, Y. Gonthier, P. Boldo and A. Bernis, Wastewater pretreatment with ultrasonic irradiation to reduce toxicity, Chem. Eng. J., 1999, 73(2), 93–100 CrossRef CAS . https://www.sciencedirect.com/science/article/pii/S1385894799000212.
- Ž. Pandur, J. Zevnik, D. Podbevšek, B. Stojković, D. Stopar and M. Dular, Water treatment by cavitation: Understanding it at a single bubble-bacterial cell level, Water Res., 2023, 236, 119956 CrossRef PubMed . https://www.sciencedirect.com/science/article/pii/S0043135423003925.
- G. Matafonova and V. Batoev, Dual-frequency ultrasound: Strengths and shortcomings to water treatment and disinfection, Water Res., 2020, 182, 116016 CAS . https://www.sciencedirect.com/science/article/pii/S0043135420305534.
- H. Yap, Y. Pang, S. Lim, A. Abdullah, H. Ong and C.-H. Wu, A comprehensive review on state-of-the-art photo-, sono-, and sonophotocatalytic treatments to degrade emerging contaminants, Int. J. Sci. Environ. Technol., 2019, 16, 601–628, DOI:10.1007/s13762-018-1961-y.
- A. Hassani, A. Khataee, S. Karaca, C. Karaca and P. Gholami, Sonocatalytic degradation of ciprofloxacin using synthesized TiO2 nanoparticles on montmorillonite, Ultrason. Sonochem., 2017, 35, 251–262 CAS . https://www.sciencedirect.com/science/article/pii/S135041771630339X.
- C. Y. Teh, T. Y. Wu and J. C. Juan, An application of ultrasound technology in synthesis of titania-based photocatalyst for degrading pollutant, Chem. Eng. J., 2017, 317, 586–612, DOI:10.1016/j.cej.2017.01.001.
- R. J. Wood, A. Bertin, J. Lee and M. J. Bussemaker, The application of flow to an ultrasonic horn system: Phenol degradation and sonoluminescence, Ultrason. Sonochem., 2021, 71, 105373, DOI:10.1016/j.ultsonch.2020.105373.
- L. Wang, D. Luo, O. Hamdaoui, Y. Vasseghian, M. Momotko and G. Boczkaj, et al., Bibliometric analysis and literature review of ultrasound-assisted degradation of organic pollutants, Sci. Total Environ., 2023, 876, 162551, DOI:10.1016/j.scitotenv.2023.162551.
- I. D. Manariotis, H. K. Karapanagioti and C. V. Chrysikopoulos, Degradation of PAHs by high frequency ultrasound, Water Res., 2011, 45(8), 2587–2594 CAS . https://www.sciencedirect.com/science/article/pii/S0043135411000650.
- S. S. Kalra, B. Cranmer, G. Dooley, A. J. Hanson, S. Maraviov and S. K. Mohanty, et al., Sonolytic destruction of Per-and polyfluoroalkyl substances in groundwater, aqueous Film-Forming Foams, and investigation derived waste, Chem. Eng. J., 2021, 425, 131778 Search PubMed . https://www.sciencedirect.com/science/article/pii/S1385894721033593.
- M. Draye, M. Chevallier, V. Quinty, C. Besnard, A. Vandeponseele and G. Chatel, Sustainable Activation of Chemical Substrates under Sonochemical Conditions, Royal Society of Chemistry, 2021 Search PubMed.
- R. J. Wood, J. Lee and M. J. Bussemaker, A parametric review of sonochemistry: Control and augmentation of sonochemical activity in aqueous solutions, Ultrason. Sonochem., 2017, 38, 351–370, DOI:10.1016/j.ultsonch.2017.03.030.
- H. Flynn, Physics of acoustic cavitation in liquids, Phys. Acoust., 1964, 1(Part B), 57–172 Search PubMed.
- E. Neppiras, Acoustic cavitation thresholds and cyclic processes, Ultrasonics, 1980, 18(5), 201–209 Search PubMed . https://www.sciencedirect.com/science/article/pii/0041624X80901201.
- B. D. Storey and A. J. Szeri, Water vapour, sonoluminescence and sonochemistry, Proc. R. Soc. London, Ser. A, 2000, 456(1999), 1685–1709, DOI:10.1098/rspa.2000.0582.
- K. Yasui, Influence of ultrasonic frequency on multibubble sonoluminescence, J. Acoust. Soc. Am., 2002, 112(4), 1405–1413, DOI:10.1121/1.1502898.
- M. Zupanc, Ž. Pandur, T. S. Perdih, D. Stopar, M. Petkovšek and M. Dular, Effects of cavitation on different microorganisms: The current understanding of the mechanisms taking place behind the phenomenon. A review and proposals for further research, Ultrason. Sonochem., 2019, 57, 147–165, DOI:10.1016/j.ultsonch.2019.05.009.
- M. Zare, P. Alfonso-Muniozguren, M. J. Bussemaker, P. Sears, E. A. Serna-Galvis, R. A. Torres-Palma and J. Lee, A fundamental study on the degradation of paracetamol under single-and dual-frequency ultrasound, Ultrason. Sonochem., 2023, 94, 106320, DOI:10.1016/j.ultsonch.2023.106320.
- M. Zare, M. J. Bussemaker, E. A. Serna-Galvis, R. A. Torres-Palma and J. Lee, Impact of sonication power on the degradation of paracetamol under single-and dual-frequency ultrasound, Ultrason. Sonochem., 2023, 99, 106564, DOI:10.1016/j.ultsonch.2023.106564.
- Y. Son, Y. No and J. Kim, Geometric and operational optimization of 20-kHz probe-type sonoreactor for enhancing sonochemical activity, Ultrason. Sonochem., 2020, 65, 105065 CrossRef CAS PubMed . https://www.sciencedirect.com/science/article/pii/S1350417720301772.
- G. Kozmus, J. Zevnik, M. Hočevar, M. Dular and M. Petkovšek, Characterization of cavitation under ultrasonic horn tip–Proposition of an acoustic cavitation parameter, Ultrason. Sonochem., 2022, 89, 106159 CrossRef CAS PubMed . https://www.sciencedirect.com/science/article/pii/S1350417722002553.
- T. Leighton, The Acoustic Bubble, Academic press, 2012 Search PubMed.
- C. Petrier, A. Jeunet, J. L. Luche and G. Reverdy, Unexpected frequency effects on the rate of oxidative processes induced by ultrasound, J. Am. Chem. Soc., 1992, 114(8), 3148–3150, DOI:10.1021/ja00034a077.
- S. Merouani, H. Ferkous, O. Hamdaoui, Y. Rezgui and M. Guemini, A method for predicting the number of active bubbles in sonochemical reactors, Ultrason. Sonochem., 2015, 22, 51–58 CrossRef CAS PubMed . https://www.sciencedirect.com/science/article/pii/S1350417714002521.
- R. Mettin, I. Akhatov, U. Parlitz, C. Ohl and W. Lauterborn, Bjerknes forces between small cavitation bubbles in a strong acoustic field, Phys. Rev. E: Stat. Phys., Plasmas, Fluids, Relat. Interdiscip. Top., 1997, 56(3), 2924, DOI:10.1103/PhysRevE.56.2924.
- Sonoluminescence and sonochemistry, 1997 IEEE Ultrasonics Symposium Proceedings, ed. K. S. Suslick, IEEE, 1997 Search PubMed.
- Z. Eren and N. H. Ince, Sonolytic and sonocatalytic degradation of azo dyes by low and high frequency ultrasound, J. Hazard. Mater., 2010, 177(1–3), 1019–1024 CrossRef CAS PubMed . https://www.sciencedirect.com/science/article/pii/S0304389410000373.
- M. A. Beckett and I. Hua, Impact of ultrasonic frequency on aqueous sonoluminescence and sonochemistry, J. Phys. Chem. A, 2001, 105(15), 3796–3802, DOI:10.1021/jp003226x.
- M. Capocelli, E. Joyce, A. Lancia, T. J. Mason, D. Musmarra and M. Prisciandaro, Sonochemical degradation of estradiols: incidence of ultrasonic frequency, Chem. Eng. J., 2012, 210, 9–17 CAS . https://www.sciencedirect.com/science/article/pii/S1385894712011497.
- M. Ashokkumar, D. Sunartio, S. Kentish, R. Mawson, L. Simons, K. Vilkhu and C. K. Versteeg, Modification of food ingredients by ultrasound to improve functionality: A preliminary study on a model system, Innovative Food Sci. Emerging Technol., 2008, 9(2), 155–160 CAS . https://www.sciencedirect.com/science/article/pii/S1466856407001221.
- R. Pflieger, T. Ouerhani, T. Belmonte and S. I. Nikitenko, Use of NH (A 3 Π–X 3 Σ−) sonoluminescence for diagnostics of nonequilibrium plasma produced by multibubble cavitation, Phys. Chem. Chem. Phys., 2017, 19(38), 26272–26279 CAS . https://rsc.66557.net/en/content/articlehtml/2017/cp/c7cp04813k.
- M. Ashokkumar and M. Ashokkumar, Ultrasonic Synthesis of Functional Materials, Springer, 2016 Search PubMed.
- A. I. Eller and L. A. Crum, Instability of the motion of a pulsating bubble in a sound field, J. Acoust. Soc. Am., 1970, 47(3B), 762–767 Search PubMed . https://pubs.aip.org/asa/jasa/article-abstract/47/3B/762/636955/Instability-of-the-Motion-of-a-Pulsating-Bubble-in.
- M. L. Calvisi, O. Lindau, J. R. Blake and A. J. Szeri, Shape stability and violent collapse of microbubbles in acoustic traveling waves, Phys. Fluids, 2007, 19(4), 047101 Search PubMed , https://pubs.aip.org/aip/pof/article/19/4/047101/256173.
- S. K. Bhangu and M. Ashokkumar, Theory of sonochemistry, in Topics in Cerrent Chemistry Collection, ed. W.-Y. W. Massimo Olivucci, 2017, pp. 1–28 Search PubMed.
- B. G. Pollet, Let's not ignore the ultrasonic effects on the preparation of fuel cell materials, Electrocatalysis, 2014, 5, 330–343, DOI:10.1007/s12678-014-0211-4.
- J.-P. Goddard, M. Malacria and C. Ollivier, Activation Methods: Sonochemistry and High Pressure, John Wiley & Sons, 2020 Search PubMed.
- Y. Huang, W. Zhang, L. Li, X. Wei, H. Li, N. Gao and J. Yao, Evaluation of ultrasound as a preventative algae-controlling strategy: degradation behaviors and character variations of algal organic matter components during sonication at different frequency ranges, Chem. Eng. J., 2021, 426, 130891 CrossRef CAS . https://www.sciencedirect.com/science/article/pii/S138589472102475X.
- Y. Peng, X. Yang, B. Ren, Z. Zhang, X. Deng and W. Yin, et al., Algae removal characteristics of the ultrasonic radiation enhanced drinking water treatment process, J. Water Process Eng., 2023, 55, 104154 CrossRef . https://www.sciencedirect.com/science/article/pii/S2214714423006748.
- L. Yang, J. Xue, L. He, L. Wu, Y. Ma and H. Chen, et al., Review on ultrasound assisted persulfate degradation of organic contaminants in wastewater: Influences, mechanisms and prospective, Chem. Eng. J., 2019, 378, 122146 CrossRef CAS.
- N. H. Ince, Ultrasound-assisted advanced oxidation processes for water decontamination, Ultrason. Sonochem., 2018, 40, 97–103 CrossRef CAS PubMed . https://www.sciencedirect.com/science/article/pii/S1350417717301669.
- E. A. Serna-Galvis, A. M. Botero-Coy, D. Martínez-Pachón, A. Moncayo-Lasso, M. Ibáñez, F. Hernández and R. A. Torres-Palma, Degradation of seventeen contaminants of emerging concern in municipal wastewater effluents by sonochemical advanced oxidation processes, Water Res., 2019, 154, 349–360 CrossRef CAS PubMed . https://www.sciencedirect.com/science/article/pii/S0043135419300995.
- M. Doosti, R. Kargar and M. Sayadi, Water treatment using ultrasonic assistance: A review, Proc. Int. Acad. Ecol. Environ. Sci., 2012, 2(2), 96 CAS.
- P. Kanthale, M. Ashokkumar and F. Grieser, Sonoluminescence, sonochemistry (H2O2 yield) and bubble dynamics: frequency and power effects, Ultrason. Sonochem., 2008, 15(2), 143–150 CrossRef CAS PubMed . https://www.sciencedirect.com/science/article/pii/S1350417707000569.
- T. Sidnell, A. J. C. Cobos, J. Hurst, J. Lee and M. J. Bussemaker, Flow and temporal effects on the sonolytic defluorination of perfluorooctane sulfonic acid, Ultrason. Sonochem., 2023, 101, 106667 CrossRef CAS PubMed . https://www.sciencedirect.com/science/article/pii/S1350417723003796.
- N. Otsu, A threshold selection method from gray-level histograms, IEEE Trans. Syst. Man Cybern., 1979, 9(1), 62–66 Search PubMed . https://dspace.tul.cz/server/api/core/bitstreams/36abcc1c-cd72-4569-90ed-607017063124/content.
- X. Zhu, X. Pan, Y. Mei, J. Ma, H. Tang and Y. Zhu, et al., Thermal nonequilibrium and mechanical forces induced breakup and droplet formation of superheated liquid jets under depressurized release, Appl. Therm. Eng., 2023, 221, 119826, DOI:10.1016/j.applthermaleng.2022.119826.
- K. Yasui, Production of O radicals from cavitation bubbles under ultrasound, Molecules, 2022, 27(15), 4788, DOI:10.3390/molecules27154788.
- K. Yasui, Unsolved problems in acoustic cavitation, Handbook of Ultrasonics and Sonochemistry, Springer, 2016, pp. 259–292 Search PubMed.
- E. J. Hart and A. Henglein, Free radical and free atom reactions in the sonolysis of aqueous iodide and formate solutions, J. Phys. Chem., 1985, 89(20), 4342–4347, DOI:10.1021/j100266a038.
- C. A. Abeledo and uI. Kolthoff, The reaction between nitrite and iodide and its application to the iodimetric titration of these anions, J. Am. Chem. Soc., 1931, 53(8), 2893–2897, DOI:10.1021/ja01359a008.
- T. Ouerhani, R. Pflieger, W. Ben Messaoud and S. I. Nikitenko, Spectroscopy of sonoluminescence and sonochemistry in water saturated with N2–Ar mixtures, J. Phys. Chem. B, 2015, 119(52), 15885–15891, DOI:10.1021/acs.jpcb.5b10221.
- H. Zhao, G. Zhang and Q. Zhang, MnO2/CeO2 for catalytic ultrasonic degradation of methyl orange, Ultrason. Sonochem., 2014, 21(3), 991–996, DOI:10.1016/j.ultsonch.2013.12.002.
- J. Lee Rodgers and W. A. Nicewander, Thirteen ways to look at the correlation coefficient, Am. Statistician, 1988, 42(1), 59–66, DOI:10.1080/00031305.1988.10475524.
- K. V. I. I. Pearson, Note on regression and inheritance in the case of two parents, Proc. R. Soc. London, 1895, 58(347–352), 240–242, DOI:10.1098/rspl.1895.0041.
- J. Lee, M. Ashokkumar, K. Yasui, T. Tuziuti, T. Kozuka, A. Towata and Y. Iida, Development and optimization of acoustic bubble structures at high frequencies, Ultrason. Sonochem., 2011, 18(1), 92–98 CrossRef CAS PubMed . https://www.sciencedirect.com/science/article/pii/S1350417710000489.
- K. Kerboua and O. Hamdaoui, Numerical investigation of the effect of dual frequency sonication on stable bubble dynamics, Ultrason. Sonochem., 2018, 49, 325–332 CrossRef CAS PubMed . https://www.sciencedirect.com/science/article/pii/S1350417718304383.
- C. Spearman, The Proof and Measurement of Association between Two Things, 1961, DOI:10.1037/11491-005.
- K. Suslick, W. McNamara Iii and Y. Didenko, Hot spot conditions during multi-bubble cavitation, Sonochemistry and Sonoluminescence, Springer, 1999, pp. 191–204 Search PubMed.
- H. McMurray and B. Wilson, Mechanistic and spatial study of ultrasonically induced luminol chemiluminescence, J. Phys. Chem. A, 1999, 103(20), 3955–3962, DOI:10.1021/jp984503r.
- Z. Dong, C. Delacour, K. Mc Carogher, A. P. Udepurkar and S. Kuhn, Continuous ultrasonic reactors: design, mechanism and application, Mater, 2020, 13(2), 344 CrossRef CAS PubMed . https://www.mdpi.com/1996-1944/13/2/344.
- J. Choi and Y. Son, Quantification of sonochemical and sonophysical effects in a 20 kHz probe-type sonoreactor: Enhancing sonophysical effects in heterogeneous systems with milli-sized particles, Ultrason. Sonochem., 2022, 82, 105888 CrossRef CAS PubMed . https://www.sciencedirect.com/science/article/pii/S1350417721004302.
- Physics-guided iso-dependent sensor noise modeling for extreme low-light photography, Proceedings of the IEEE/CVF Conference on Computer Vision and Pattern Recognition, ed. Y. Cao, M. Liu, S. Liu, X. Wang, L. Lei and W. Zuo, 2023 Search PubMed.
- X. Liang, X. Chen, K. Ren, X. Miao, Z. Chen and Y. Jin, Low-light image enhancement via adaptive frequency decomposition network, Sci. Rep., 2023, 13(1), 14107 CrossRef CAS PubMed . https://www.nature.com/articles/s41598-023-40899-8.
- C.-W. Kok and W.-S. Tam, Digital Image Denoising in MATLAB, John Wiley & Sons, 2024 Search PubMed.
- M. Ashokkumar, The characterization of acoustic cavitation bubbles–an overview, Ultrason. Sonochem., 2011, 18(4), 864–872 CrossRef CAS PubMed . https://www.sciencedirect.com/science/article/pii/S1350417710002312.
- SdL. R. d'Auzay, J.-F. Blais and E. Naffrechoux, Comparison of characterization methods in high frequency sonochemical reactors of differing configurations, Ultrason. Sonochem., 2010, 17(3), 547–554 CrossRef PubMed . https://www.sciencedirect.com/science/article/pii/S1350417709001886.
- J.-L. Laborde, A. Hita, J.-P. Caltagirone and A. Gerard, Fluid dynamics phenomena induced by power ultrasounds, Ultrasonics, 2000, 38(1–8), 297–300 CrossRef CAS PubMed . https://www.sciencedirect.com/science/article/pii/S0041624X99001249.
- Z. Xu, K. Yasuda and X. Liu, Simulation of the formation and characteristics of ultrasonic fountain, Ultrason. Sonochem., 2016, 32, 241–246, DOI:10.1016/j.ultsonch.2016.03.016.
- K. Yasui, The reducing agents in sonochemical reactions without any additives, Molecules, 2023, 28(10), 4198, DOI:10.3390/molecules28104198.
- D. Sunartio, M. Ashokkumar and F. Grieser, Study of the coalescence of acoustic bubbles as a function of frequency, power, and water-soluble additives, J. Am. Chem. Soc., 2007, 129(18), 6031–6036, DOI:10.1021/ja068980w.
- R. Tronson, The Effect of Surface Active Solutes and Ultrasound Frequency on Sonoluminescence in Aqueous Solutions, University of Melbourne, School of Chemistry, 2004 Search PubMed.
- K. S. Suslick, D. A. Hammerton and R. E. Cline, Sonochemical hot spot, J. Am. Chem. Soc., 1986, 108(18), 5641–5642, DOI:10.1021/ja00278a055.
- T. T. Nguyen, Y. Asakura, S. Koda and K. Yasuda, Dependence of cavitation, chemical effect, and mechanical effect thresholds on ultrasonic frequency, Ultrason. Sonochem., 2017, 39, 301–306 CrossRef PubMed . https://www.sciencedirect.com/science/article/pii/S1350417717302018.
- K. S. Suslick, Sonochem. Sci., 1990, 247(4949), 1439–1445, DOI:10.1126/science.247.4949.1439.
- V. Naddeo, A. Cesaro, D. Mantzavinos, D. Fatta-Kassinos and V. Belgiorno, Water and wastewater disinfection by ultrasound irradiation-a critical review, Global NEST J., 2014, 16(3), 561–577, DOI:10.5555/20143336631.
- J. J. Pignatello, E. Oliveros and A. MacKay, Advanced oxidation processes for organic contaminant destruction based on the Fenton reaction and related chemistry, Crit. Rev. Environ. Sci. Technol., 2006, 36(1), 1–84, DOI:10.1080/10643380500326564.
- J. L. Wang and L. J. Xu, Advanced oxidation processes for wastewater treatment: formation of hydroxyl radical and application, Crit. Rev. Environ. Sci. Technol., 2012, 42(3), 251–325, DOI:10.1080/10643389.2010.507698.
- M. Zhou, N. S. M. Yusof and M. Ashokkumar, Correlation between sonochemistry and sonoluminescence at various frequencies, RSC Adv., 2013, 3(24), 9319–9324 RSC . https://rsc.66557.net/en/content/articlehtml/2013/ra/c3ra41123k.
- S.-i Hatanaka, H. Mitome, K. Yasui and S. Hayashi, Single-bubble sonochemiluminescence in aqueous luminol solutions, J. Am. Chem. Soc., 2002, 124(35), 10250–10251, DOI:10.1021/ja0258475.
- J. N. Israelachvili, Intermolecular and Surface Forces, Academic press, 2011 Search PubMed.
- J. M. Sangster, Octanol-water Partition Coefficients: Fundamentals and Physical Chemistry, John Wiley & Sons, 1997 Search PubMed.
- M. J. Rosen and J. T. Kunjappu, Surfactants and Interfacial Phenomena, John Wiley & Sons, 2012 Search PubMed.
- T. Sidnell, R. J. Wood, J. Hurst, J. Lee and M. J. Bussemaker, Sonolysis of per-and poly fluoroalkyl substances (PFAS): A meta-analysis, Ultrason. Sonochem., 2022, 87, 105944 CrossRef CAS PubMed . https://www.sciencedirect.com/science/article/pii/S1350417722000372.
- M. S. Plesset and A. Prosperetti, Bubble dynamics and cavitation, Annu. Rev. Fluid. Mech., 1977, 9(1), 145–185, DOI:10.1146/annurev.fl.09.010177.001045.
- M. Ashokkumar and F. Grieser, The effect of surface active solutes on bubbles in an acoustic field, Phys. Chem. Chem. Phys., 2007, 9(42), 5631–5643 RSC . https://rsc.66557.net/en/content/articlehtml/2007/cp/b707306m.
- K. Yasui, T. Tuziuti and Y. Iida, Optimum bubble temperature for the sonochemical production of oxidants, Ultrasonics, 2004, 42(1–9), 579–584, DOI:10.1016/j.ultras.2003.12.005.
- T. J. Mason, Sonochemistry: uses of ultrasound in chemistry and related disciplines, Ultrasound Angioplasty, Springer, 1996, pp. 25–54 Search PubMed.
- K. Thangavadivel, K. Okitsu, G. Owens, P. J. Lesniewski and R. Nishimura, Influence of sonochemical reactor diameter and liquid height on methyl orange degradation under 200 kHz indirect sonication, J. Environ. Chem. Eng., 2013, 1(3), 275–280, DOI:10.1016/j.jece.2013.05.005.
- M. S. Longuet-Higgins, Viscous streaming from an oscillating spherical bubble, Proc. R. Soc. London, Ser. A, 1998, 454(1970), 725–742, DOI:10.1098/rspa.1998.0183.
Footnote |
| † Electronic supplementary information (ESI) available. See DOI: https://doi.org/10.1039/d5mr00006h |
| This journal is © The Royal Society of Chemistry 2025 |