 Open Access Article
Synthesis of magnetic NiFe2O4/g-C3N4 heterojunction photocatalysts for boosting dye degradation performance under visible-light irradiation†
Loan Thi To
Nguyen
 a,
Anh Thi Tu
Duong
a,
Nguyen Duc
Bui
a,
Viet Thi Mai
Ngo
a,
Hai Quang
Nguyen
a,
Hang Thi Thuy
Nguyen
b,
Giang Thanh
Tran
c and
Thuan Van
Tran
a,
Anh Thi Tu
Duong
a,
Nguyen Duc
Bui
a,
Viet Thi Mai
Ngo
a,
Hai Quang
Nguyen
a,
Hang Thi Thuy
Nguyen
b,
Giang Thanh
Tran
c and
Thuan Van
Tran
 *c
*c
aFaculty of Chemistry, Thai Nguyen University of Education, Thai Nguyen 240000, Vietnam
bFaculty of Automotive and Power Machinery Engineering, Thai Nguyen University of Technology, Thai Nguyen 24000, Vietnam
cInstitute of Applied Technology and Sustainable Development, Nguyen Tat Thanh University, 298-300A Nguyen Tat Thanh, District 4, Ho Chi Minh City 755414, Vietnam. E-mail: tranvt@ntt.edu.vn; tranuv@gmail.com; Fax: +84-028-39-404-759; Tel: +84-028-3941-1211
First published on 5th December 2024
Abstract
Water pollution from dyes in wastewater is a critical global issue, as these stable organic dyes resist biodegradation, posing serious threats to aquatic ecosystems. To address this situation, advanced photocatalysts have been developed. Here, NiFe2O4/g-C3N4 was synthesized for the photocatalytic degradation of Rhodamine B (RhB) dye in the presence of H2O2 and visible light. Physicochemical analysis results showed NiFe2O4 nanoparticles dispersed in the g-C3N4 matrix, with an upward trend in the saturation magnetization of CNFx as NiFe2O4 content rose. The surface area of CNF30 was 62.3 m2 g−1, outperforming both NiFe2O4 (23.2 m2 g−1) and g-C3N4 (48.5 m2 g−1). NiFe2O4/g-C3N4 could be reused up to four cycles, and efficiently catalyzed the degradation of nearly 98% RhB dye, showing a decreased rate of up to 95% COD. Through scavenger studies, the main role of ˙OH was demonstrated. Therefore, highly efficient and recyclable NiFe2O4/g-C3N4 can be a potential photocatalyst for degradation of dyes.
1. Introduction
The expansion of industries and growing population have intensified environmental and health concerns, especially with the extensive use of synthetic dyes across various sectors, which significantly contributes to water pollution.1 Many of these dyes are either slow to biodegrade or are entirely non-biodegradable, making them challenging to treat using conventional wastewater methods.1,2 Additionally, their toxicity can severely disrupt the metabolism of living organisms, posing risks such as mutagenicity and carcinogenicity.3,4 Without timely intervention, these pollutants may cause irreversible harm to ecosystems, underscoring the need for sustainable and effective solutions to mitigate these environmental hazards.Currently, the variety of available wastewater treatment processes provides a robust basis for selecting the most effective methods for specific pollutants. Advanced physical techniques such as sedimentation, ion exchange, and membrane filtration, for instance, achieve high-efficiency removal of organic and inorganic solids from water.5 Additionally, bioremediation of textile wastewater using different organisms, e.g., bacteria, fungi, algae, enzymes, and mixed cultures under aerobic and anaerobic conditions has proven particularly effective as it decomposes organic contaminants and converts dissolved organic matter into biomass.6 Furthermore, physicochemical treatments, including coagulation–flocculation, activated carbon-based adsorption, photocatalysis, electrochemical methods, and advanced oxidation processes, have also shown strong performance in removing pollutants.7 Notably, among these, advanced oxidation processes are extensively regarded as the most effective for degrading dye molecules in wastewater.8
Over the last two decades, two-dimensional graphitic carbon nitride (g-C3N4) has emerged as one of the most prominent photocatalysts for physicochemical applications due to its favorable thermochemical stability, cost-effectiveness, ease of synthesis, narrow band gap energy (2.9 eV), and abundant charge carriers within its tri-s-triazine and triazine units.9–11 However, the photocatalytic performance of g-C3N4 is hindered by obstacles such as a low surface area, rapid recombination of photogenerated electron–hole pairs, and limited absorption efficiency (≤450 nm).12 To overcome these issues, researchers have explored modifications with elements such as sulfur, phosphorus, potassium, and sodium, which have shown to enhance the photocatalytic activity of g-C3N4.13 Additionally, combining with other semiconductors, such as magnetic spinel ferrite, offers a promising approach due to its ability to broaden the absorption spectrum, reduce bandgap energy, improve thermochemical stability, and increase charge separation, thereby boosting photocatalytic efficiency.9 Nickel ferrite (NiFe2O4), with band gaps of 1.5–1.7 eV and greater absorption within the visible spectrum, serves as a beneficial component to enhance photocatalytic applications.14 Thus, the presence of NiFe2O4 in binary semiconductors helps form Z-scheme or S-scheme heterojunctions in minimizing charge recombination and enhancing photocatalytic activity.
Numerous studies on NiFe2O4/g-C3N4 have demonstrated high effectiveness in photodegrading various pollutants in water, underscoring its strong potential as a key material for wastewater treatment.15–17 The NiFe2O4/g-C3N4 composite has photodegradation potential to degrade a broad range of pharmaceutical substances, such as ofloxacin, cephalexin, and tetracycline hydrochloride, along with harmful dyes such as methylene blue, methyl orange, and rhodamine B.15,18–21 Remarkably, NiFe2O4/g-C3N4 achieved removal rates 30–50% higher than those obtained with individual components (g-C3N4 and NiFe2O4). However, moderate degradation rate and long treatment duration using the NiFe2O4/g-C3N4 composite might be the major drawbacks in these studies. Importantly, NiFe2O4/g-C3N4 stability and recyclability as well as the photocatalytic mechanism for RhB degradation were not clarified insightfully. Necessary tests such as chemical oxygen demand to monitor the amount of oxygen in the treated water were rarely conducted.
Here, several improvements in experimental conditions are implemented to enhance the RhB photodegradation performance using the NiFe2O4/g-C3N4 composite, offering a deeper analysis compared to prior studies. These novel points may distinguish this research on RhB elimination using NiFe2O4/g-C3N4 composites. These advancements aim to distinguish our findings on RhB degradation with this composite. Firstly, unlike previous studies relying on direct solar irradiation, which varies in photon intensity, the photodegradation process was achieved by irradiation using a stable photon source of LED light, ensuring consistent photon energy throughout the process.21,22 Secondly, a chemical oxygen demand (COD) experiment for measuring the total organic matter after the reaction was conducted. Thirdly, a plausible and detailed mechanism for RhB photodegradation by the NiFe2O4/g-C3N4 composite was proposed through incorporating recent insights on semiconductor heterojunction mechanisms. This addressed the gap left by prior studies,21 which did not confirm whether the mechanism was a type-II heterojunction or an S-scheme. Our proposed mechanism provides a more comprehensive understanding, confirming that the S-scheme mechanism best describes the photodegradation process.
2. Materials and methods
2.1. Synthesis of g-C3N4
First, 10 g of urea was added into a ceramic crucible and capped carefully. The solid was calcined at 500 °C with a heating rate of 5 °C min−1 for 2 h to obtain g-C3N4. Afterward, the g-C3N4 solid was ground finely, washed with 0.1 M HNO3 solution, and distilled water many times. Finally, the sample was dried at 110 °C to obtain pure g-C3N4.2.2. Synthesis of NiFe2O4
In this study, urea acted as a fuel for the combustion method. First, 8.0 g urea was dissolved in 20 mL distilled water. 5.82 g Ni(NO3)2·6H2O and 16.2 g of Fe(NO3)3·9H2O were added into this solution. The mixture was magnetically stirred on a heating machine at 70 °C for 4 h. The sample was dried in an oven, and then transferred into a ceramic crucible. The solid was calcined at 500 °C for 3 h to obtain the NiFe2O4 sample. The chemical equation for the reaction can be described as follows:| 3Ni(NO3)2 + 6Fe(NO3)3 + 20(NH2)2CO → 3NiFe2O4 + 32N2 + 20CO2 + 40H2O |
2.3. Synthesis of the NiFe2O4/g-C3N4 composite
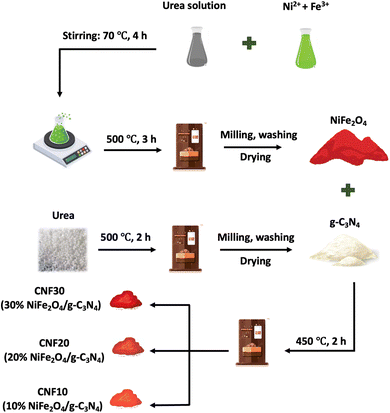
Fig. 1 shows the synthesis procedure of the NiFe2O4/g-C3N4 composite. In detail, 0.01 g of the synthesized NiFe2O4 was elaborately mixed with 0.09 g of g-C3N4, and transferred into a ceramic crucible. Then, the mixture was calcined at 450 °C for 2 h. The solid was washed with distilled water, and dried to obtain the NiFe2O4/g-C3N4 material, denoted as CNF10. The number “10” means that the weight of NiFe2O4 accounted for 10% of the total weight of NiFe2O4 and g-C3N4. Similarly, composite samples with 20% NiFe2O4 (CNF20) and 30% NiFe2O4 (CNF30) were prepared by adjusting the proportions accordingly. The synthesis of these samples was conducted similar to that of the CNF10 sample.2.4. Photocatalytic experiments
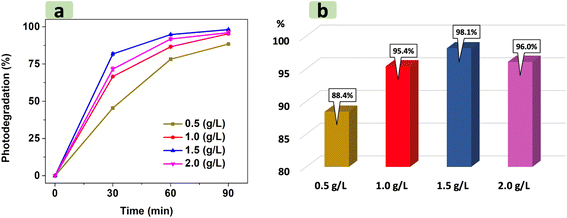
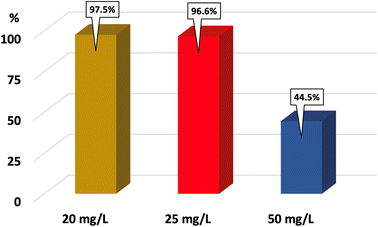
For a typical run, 0.1 g of the catalyst was added into 100 mL RhB dye solution (20 mg L−1). The adsorption was carried out under dark conditions for 90 min to reach equilibrium. Note that after every 30 min, the solution was sampled (2 mL) and centrifuged to monitor the UV-Vis absorption spectra. After 90 min of adsorption, a volume of 30% H2O2 was added into the solution to obtain an [H2O2] of 0.2 M. The mixture was stirred under illumination using LED light. Every 30 min, the solution was sampled with 2 mL to monitor the absorbance. The maximum absorbance of RhB was determined at approximately 500 nm.3. Results and discussion
3.1. Characterization
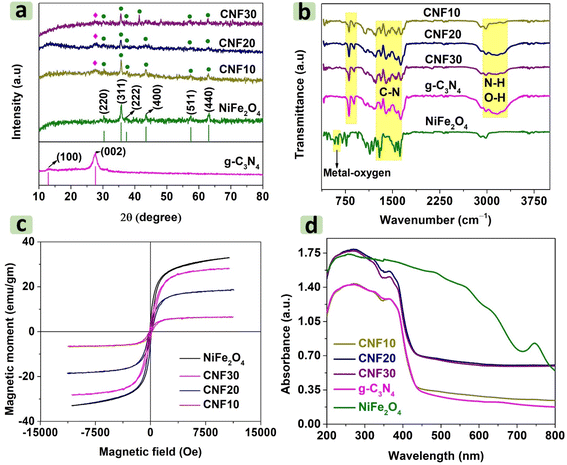
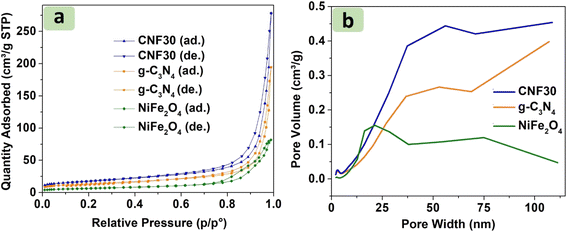
![[double bond, length as m-dash]](https://www.rsc.org/images/entities/char_e001.gif) C or C–N bonds. These impurities likely result from using urea as a combustion agent in the synthesis process. The spectra of CNFx (x = 10, 20, 30) composites inherit peaks from both g-C3N4 and NiFe2O4. A noticeable increase in the intensity of the metal–oxygen vibration peaks is observed when the NiFe2O4 grafted on g-C3N4 sheet is increased.
C or C–N bonds. These impurities likely result from using urea as a combustion agent in the synthesis process. The spectra of CNFx (x = 10, 20, 30) composites inherit peaks from both g-C3N4 and NiFe2O4. A noticeable increase in the intensity of the metal–oxygen vibration peaks is observed when the NiFe2O4 grafted on g-C3N4 sheet is increased.
To access the separation efficiency of photo-generated electron–hole (e−–h+) pairs of g-C3N4 and CNF30 composite, photoluminescence (PL) spectra at a wavelength range of 400–600 nm were recorded. According to Fig. S1,† g-C3N4 has an emission peak at around 438 nm, compared with the 434 nm of CNF30. Moreover, the PL intensity of g-C3N4 is considerably decreased in comparison to that of CNF30, indicating the migration of e−–h+ pairs between g-C3N4 and NiFe2O4. Therefore, the e−–h+ recombination rate of CNF30 decreased, likely increasing its photocatalytic performance.
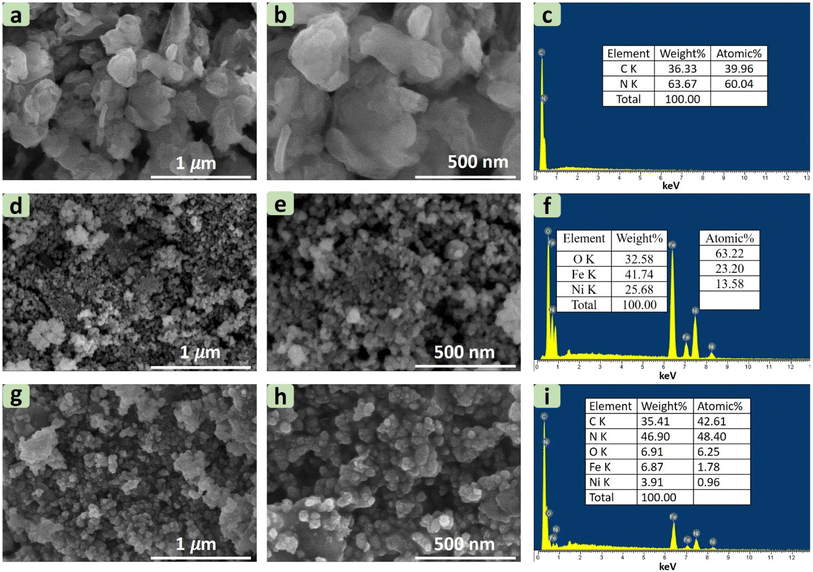 | ||
| Fig. 3 SEM images of g-C3N4 (a and b) and EDX analysis (c). SEM images of NiFe2O4 (d and e) and EDX analysis (f). SEM images of CNF30 (g and h) and EDX analysis (i). | ||
The elemental composition and percentage of elements in g-C3N4, NiFe2O4, and CNF30 composite are presented through EDX analysis in Fig. 3. The obtained data confirm the presence of main elements in g-C3N4, NiFe2O4, and CNF30. Notably, the double calcination of g-C3N4 led to a change in the C/N ratio in the g-C3N4 and CNF30 samples. In pure g-C3N4, the atomic ratio of C/N was 0.67, compared with 0.88 of CNF30. This finding indicates a decrease in the nitrogen content after two successive heating at 500 °C and 450 °C due to the deamination process.26
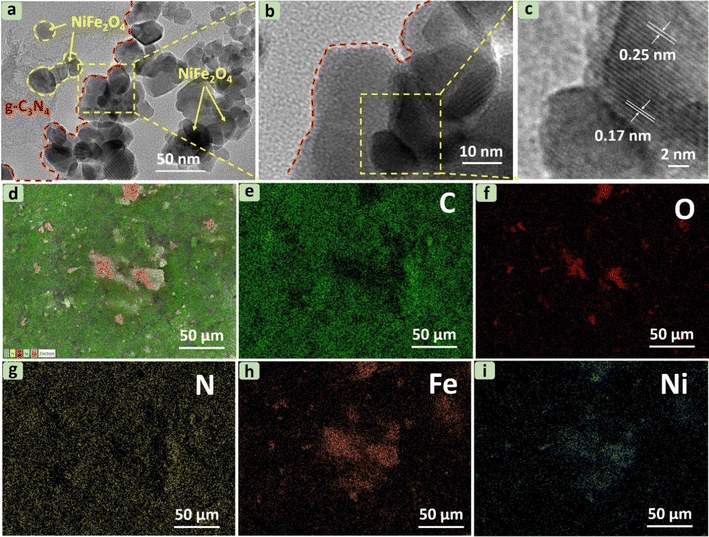
The internal structure of g-C3N4 in Fig. S2† reflects the thin flat shape of irregular 2D nanosheets as reported previously.39 For the composite, HRTEM images in Fig. 4a and b show NiFe2O4 particles with an average size of about 50 nm embedded in g-C3N4 nanosheets in CNF30, agreeable with previous studies.19,21 Decoration of NiFe2O4 by g-C3N4 at the edge is also observed in Fig. S3.† Two distinct lattice fringes at 0.17 nm (440) and 0.25 nm (311) in Fig. 4c are attributable to lattices of NiFe2O4, suggesting the presence of NiFe2O4 in the CNF30 heterojunction.40 Moreover, EDS mapping of CNF30 in Fig. 4d–i shows good distribution of C, O, N, Fe and Ni in CNF30, which was consistent with the EDX analysis results.
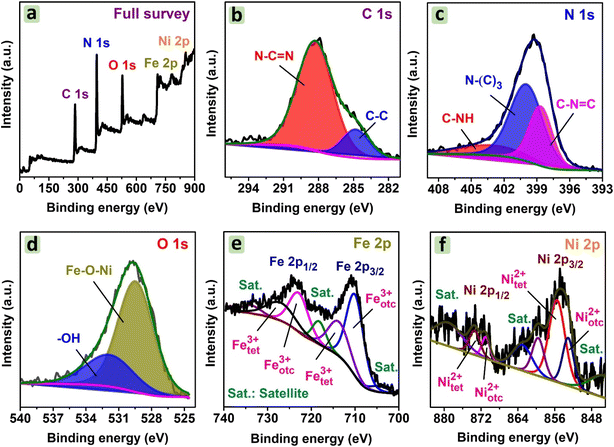
![[double bond, length as m-dash]](https://www.rsc.org/images/entities/char_e001.gif) N bonds. Meanwhile, Fig. 6c shows three deconvoluted N1s peaks at 398.7 eV, 400.0 eV, and 403.4 eV, corresponding to C–N
N bonds. Meanwhile, Fig. 6c shows three deconvoluted N1s peaks at 398.7 eV, 400.0 eV, and 403.4 eV, corresponding to C–N![[double bond, length as m-dash]](https://www.rsc.org/images/entities/char_e001.gif) C, N–(C)3, and C–NH groups. These bonds belong to g-C3N4, as reported previously.41,42 For O1s, Fig. 6d suggests the presence of oxygen–metal bonds in NiFe2O4 particles at 529.5 eV. Another peak at 532.0 eV can be hydroxyl groups, which resulted from water adsorbed in CNF30.21 For Fe 2p, the spectrum in Fig. 6e highlights two regions including Fe 2p3/2 at 710.2 eV and 714.2 eV, and Fe 2p1/2 at 723.3 eV and 727.8 eV. Moreover, the deconvolution indicates two Fe3+ states in the octahedral and tetrahedral sites.43 Similarly, the deconvolution of Ni 2p3/2 at 853.1 eV and 855.6 eV, and Ni 2p1/2 at 871.0 eV and 873.5 eV can be observed in Fig. 6f.
C, N–(C)3, and C–NH groups. These bonds belong to g-C3N4, as reported previously.41,42 For O1s, Fig. 6d suggests the presence of oxygen–metal bonds in NiFe2O4 particles at 529.5 eV. Another peak at 532.0 eV can be hydroxyl groups, which resulted from water adsorbed in CNF30.21 For Fe 2p, the spectrum in Fig. 6e highlights two regions including Fe 2p3/2 at 710.2 eV and 714.2 eV, and Fe 2p1/2 at 723.3 eV and 727.8 eV. Moreover, the deconvolution indicates two Fe3+ states in the octahedral and tetrahedral sites.43 Similarly, the deconvolution of Ni 2p3/2 at 853.1 eV and 855.6 eV, and Ni 2p1/2 at 871.0 eV and 873.5 eV can be observed in Fig. 6f.
The cyclic voltammetric curves of NiFe2O4 and CNF30 at a scan rate of 50 mV s−1 are shown in Fig. S5.† Both photocatalysts exhibited typical redox voltammogram loops. Moreover, specific capacitance (Cp) can be calculated as follows, (eqn (1)).45
 | (1) |
 can be calculated as the area of the cyclic voltammetric curve. Based on Fig. S5,† the specific capacitance (Cp) values were measured at 61.48 and 83.70 F g−1 for NiFe2O4 and CNF30, respectively. Decoration of NiFe2O4 with g-C3N4 might increase the number of electrochemical active sites and lower band gap, accelerating ionic diffusion and improving specific capacitance.46 As a result, CNF30 proved to be a potential photocatalyst for capturing and retaining the charge under visible-light irradiation.
3.2. Photocatalytic degradation
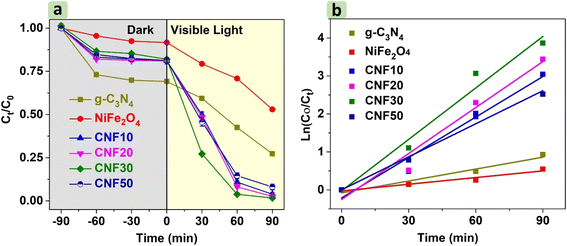 | ||
| Fig. 7 Photocatalytic degradation of RhB by g-C3N4, NiFe2O4, and CNFx (x = 10, 20, 30, 50) (a), and photodegradation kinetics fitted by the pseudo-first-order model (b). | ||
The photolysis of RhB (without the catalyst) exhibited a minimal decline of nearly 5% in 90 min. The degradation efficiency of RhB by CNF30 showed the highest value at 97.9%, while CNF10 and CNF20 achieved photodegradation efficiencies of 95.2% and 96.8%, respectively. Increasing NiFe2O4 content (50%) did not lead to increased degradation efficiency of CNF50 since the value was found at 91.9%. The superiority of all CNFx (x = 10, 20, 30, 50) compared to g-C3N4 (60.6%) and NiFe2O4 (42.2%) was attributed to the formation of heterojunctions within the CNFx composites, which led to efficient charge transfer.48 The absorption of photon energy allowed the CNFx heterojunctions to generate a large and stable number of electrons through the excitation process. These electrons moved to the conduction band more easily, reducing electron–hole recombination. Several studies also reported that the NiFe2O4/g-C3N4 composites offered better photodegradation efficiency against antibiotics and dyes compared to single photocatalysts.19,29,49
To clearly evaluate the kinetic degradation of RhB by g-C3N4, NiFe2O4, and CNFx (x = 10, 20, 30, 50), the pseudo-first-order model was applied. Fig. 7b shows that all models for describing photodegradation are reliable, with R2 values ranging from 0.93 to 0.96. Table S2† also reveals that CNF30 exhibits the highest reaction rate constant (k1) at 0.045 min⁻1. Due to its remarkable photodegradation efficiency and rate, CNF30 was chosen as the optimal catalyst for the photodegradation of RhB.
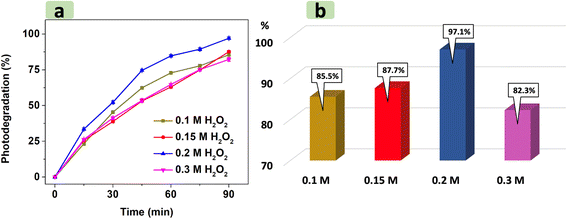
Fig. 9 illustrates that increasing H2O2 concentration from 0.1 M to 0.2 M increases photodegradation efficiency from 85.5% to 97.1%. This trend was attributed to the higher density of H2O2 in RhB solution, which acted as an effective scavenger by trapping electrons from the conduction band of CNF30 to create more hydroxyl radicals.57 When H2O2 concentration exceeds the optimal level (0.2 M), however, the RhB photodegradation yield significantly declines to 82.3%. In addition to scavenging electrons, excessive H2O2 amount also generates hydroxyl (˙OH) and hydroperoxyl (˙OOH) radicals.55,56,58 The reaction between these two radicals to form H2O and O2 may reduce the availability of radicals necessary for the photodegradation process.
| EVB = χ − Ec + 0.5Eg | (2) |
| ECB = EVB − Eg | (3) |
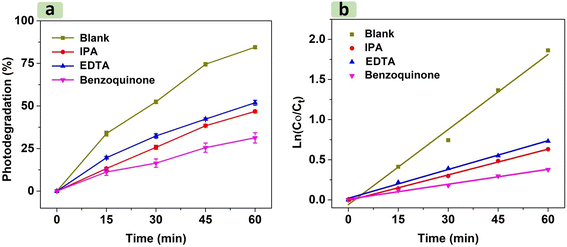
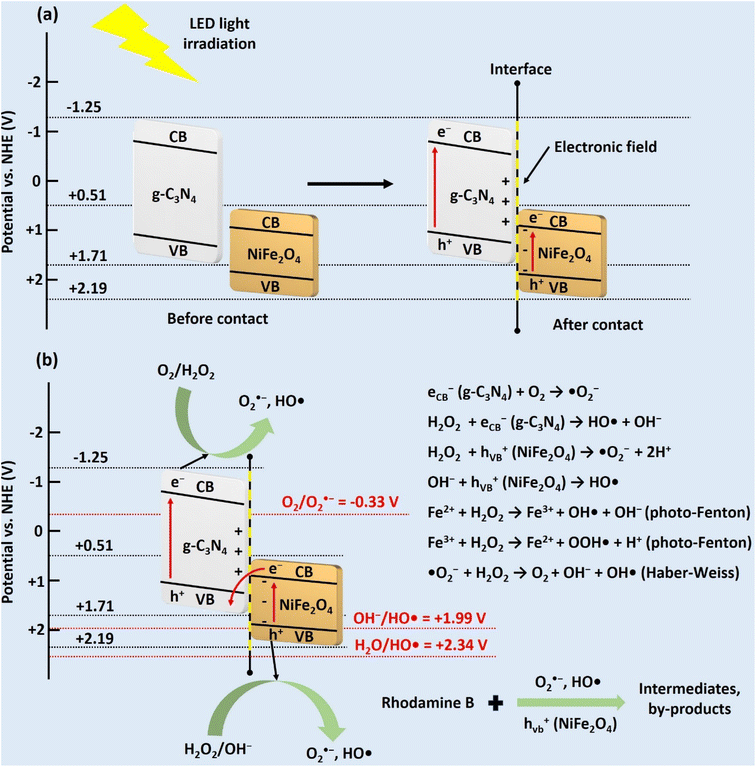
For NiFe2O4 NPs, the calculated VB and CB edge positions are 2.19 and 0.51 V vs. NHE, respectively. For g-C3N4 microsheets, the calculated VB and CB edge positions are 1.71 and −1.25 V vs. NHE, respectively. The trapping experiment results show that (˙OH), (˙O2−) and (h+) species participate in the RhB degradation. Evaluating the photocatalytic degradation of CNF30 based on the type-II heterojunction mechanism reveals several drawbacks, suggesting that it is not suitable to explain the degradation of RhB or is not the main mechanism. After photon irradiation from an LED light, electron/hole pairs form. In a type-II heterojunction, electrons move from the CB of g-C3N4 to the CB of NiFe2O4 since the CB of g-C3N4 (−1.25 eV) is more negative than that of NiFe2O4 (0.51 V). Simultaneously, holes transfer from the VB of NiFe2O4 (2.19 V) to the VB of g-C3N4 (1.71 V) due to the higher positive VB of g-C3N4. However, at the CB of NiFe2O4 (0.51 V), the standard reduction potential (O2/O2˙−) (E0 = −0.33 V vs. NHE) is more negative than the CB of NiFe2O4; therefore, superoxide radicals cannot be created.62 Furthermore, the standard oxidation potential (OH−/HO˙) (E0 = +1.99 V vs. NHE) is also more positive than the VB of g-C3N4 (1.71 V); therefore, hydroxyl radicals cannot be created.63 Due to these obstacles in the formation of hydroxyl and superoxide radicals, the type-II heterojunction mechanism is not the main mechanism in the degradation process.
On the other hand, the photocatalytic degradation of RhB through the S-scheme mechanism can explain the treatment process by CNF30 as illustrated in Fig. 12. After photon irradiation, g-C3N4 and NiFe2O4 semiconductors contact each other via Fermi level alignment. This electron migration leads to upward bending of g-C3N4 (positive) and downward bending of NiFe2O4 (negative).15 This process generates inbuilt electric fields at the interface of the two semiconductors, coulombic repulsion, and band bending, which inhibit the transfer of electrons from the CB of g-C3N4 to that of NiFe2O4 as well as the transfer of holes from the VB of NiFe2O4 to that of g-C3N4 (in the type-II heterojunction path).27 Consequently, the electrons with less negative charge at the CB of NiFe2O4 can combine with holes with less positive charge at the VB of g-C3N4. Next, the reduction reaction occurs to form O2˙− at the highest energy potential of the CB of g-C3N4 (−1.25 V) due to the potential being more negative than the standard reduction potential (O2/O2˙− = −0.33 V). Simultaneously, the oxidation reaction to form HO˙ occurs at the highest energy potential of the VB of NiFe2O4 (2.19 V) due to the potential being more positive than the standard oxidation potential (OH−/HO˙ = +1.99 V). Moreover, the standard oxidation potential (H2O/HO˙ = +2.34 V) is higher than that of the VB of NiFe2O4; therefore, some holes may directly oxidize the RhB molecules.64 Finally, the combination of the S-scheme mechanism and the scavenging experiment results can explain the photocatalytic degradation of RhB in the presence of the three radical species.
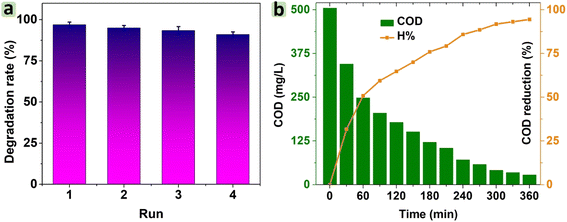
Chemical oxygen demand (COD) is a crucial parameter that indicates the amount of oxygen required to oxidize organic compounds in water. According to Fig. 13b, the COD value for RhB degradation was 504.7 mg L−1, and this value gradually decreased to 28.0 mg L−1 after 360 min. A significant reduction in COD indicates the effective mineralization of RhB, implying that RhB could be largely broken down into smaller molecules or fragments. Moreover, the percentage of COD reduction increased to 94.5% after 360 min under visible light, suggesting that CNF30 was highly effective in degrading RhB. This result highlighted the potential of CNF30 for practical applications in wastewater treatment.
| Photocatalyst | Type of dye pollutant | Degradation time (min) | Catalyst dosage (g L−1) | Dye concentration (mg L−1) | COD reduction rate (%) | k 1 (1 min−1) | Number of reuses | Degradation efficiency (%) | Ref. | |
|---|---|---|---|---|---|---|---|---|---|---|
| At the 1st cycle | At the final cycle | |||||||||
| NiFe2O4/g-C3N4 | Rhodamine B | 90 | 1.0 | 20 | 95.0 | 0.045 | 4 | 98.0 | 91.0 | This study |
| NiFe2O4/(N,S) graphene oxide | Rhodamine B | 240 | 0.5 | 100 | 90.3 | 0.012 | 3 | 95.2 | 90.3 | 65 |
| Cellulose bead supported-CoFe2O4 | Rhodamine B | 60 | 0.4 | 40 | 85.6 | 0.089 | 5 | 99.5 | 78.0 | 66 |
| Alginate-ZnCO2O4 | Rhodamine B | 40 | 1.0 | 25 | 82.0 | 0.146 | 5 | 98.2 | 78.0 | 67 |
| ZnCo2O4/N-doped g-C3N4 | Rhodamine B | 60 | 0.35 | 10 | 79.6 | 0.098 | 5 | 92.3 | 83.4 | 68 |
| ZnxMn1−xFe2O4 | Rhodamine B | 180 | 1.0 | 20 | 80 | 0.006 | 4 | 95.3 | 80 | 69 |
| Bi2O3/BiOCl | Rhodamine B | 120 | 0.5 | 10 | 67.2 | 0.027 | 5 | 96.8 | 92.6 | 70 |
| MgO–Fe | Rhodamine B | 240 | 0.75 | 10 | 67.0 | 0.047 | — | 97.8 | — | 71 |
| Biosynthesized Ag@ZnO | Rhodamine B | 120 | 1.0 | 100 | 74.8 | 0.013 | — | 90 | — | 72 |
| Biosynthesized ZnO | Rhodamine B | 120 | 1.0 | 100 | 41.3 | — | — | 50 | — | 72 |
4. Conclusion
Here, NiFe2O4/g-C3N4 was synthesized and applied for the photocatalytic degradation of RhB dye. The morphological results revealed that NiFe2O4 nanoparticles were dispersed in the g-C3N4 matrix. There was an upward trend in the saturation magnetization (6.5–28.1 emu g−1) of CNFx with NiFe2O4 amount (10–30%). The surface area of CNF30 was 62.3 m2 g−1, significantly higher than that of NiFe2O4 and g-C3N4. Nearly 98% RhB dye was degraded with a decrease level of 95% COD using the CNF30/H2O2/visible light system. The highest first-order kinetic rate was 0.045 min−1 for the reaction catalyzed by CNF30. The scavenger studies threw light on the important role of ˙O2−, ˙OH, and h+ species. After the 4th cycle, CNF30 still exhibited high photocatalytic activity at an efficiency of 91% and high stability. Therefore, NiFe2O4/g-C3N4 can be suggested as a potential photocatalyst for degradation of dyes.Ethical statement
The authors declare that the manuscript has not been published anywhere or submitted to another journal. The manuscript is not currently being considered for publication in any another journal. All authors have been personally and actively involved in substantive work leading to the manuscript, and will hold themselves jointly and individually responsible for its content. The research does not involve any human participants and/or animals.Data availability
The data supporting this article have been included as part of the ESI.†Code availability
The authors declare that software application or custom code supports their published claims and complies with field standards.Author contributions
Loan Thi To Nguyen: conceptualization, investigation, project administration, supervision; Anh Thi Tu Duong: investigation formal analysis, resources; Nguyen Duc Bui: investigation, formal analysis; Viet Thi Mai Ngo: investigation, data curation; Hai Quang Nguyen: validation, visualization; Hang Thi Thuy Nguyen: validation, data curation; Giang Thanh Tran: writing – original draft, validation; Thuan Van Tran: writing – original draft, writing review & editing, methodology, supervision. All authors read and approved the final manuscript.Conflicts of interest
The authors declare that there are no conflicts of interest.Acknowledgements
This research was funded by the Vietnamese Ministry of Education and Training under grant number B2024-TNA-11.References
- A. Tkaczyk, K. Mitrowska and A. Posyniak, Sci. Total Environ., 2020, 717, 137222 CrossRef CAS PubMed.
- A. Srivastava, R. M. Rani, D. S. Patle and S. Kumar, J. Chem. Technol. Biotechnol., 2022, 97, 26–41 CrossRef CAS.
- G. T. Tran, N. T. H. Nguyen, N. T. T. Nguyen, T. T. T. Nguyen, D. T. C. Nguyen and T. V. Tran, Environ. Chem. Lett., 2023, 21, 2417–2439 CrossRef CAS.
- M. Köktürk, Sci. Total Environ., 2022, 852, 158473 CrossRef PubMed.
- S. F. Ahmed, M. Mofijur, S. Nuzhat, A. T. Chowdhury, N. Rafa, M. A. Uddin, A. Inayat, T. M. I. Mahlia, H. C. Ong, W. Y. Chia and P. L. Show, J. Hazard. Mater., 2021, 416, 125912 CrossRef CAS PubMed.
- V. Gopinath, S. M. Kamath, S. Priyadarshini, Z. Chik, A. A. Alarfaj and A. H. Hirad, Biomed. Pharmacother., 2022, 146, 112492 CrossRef CAS PubMed.
- V. Ganthavee and A. P. Trzcinski, J. Ind. Eng. Chem., 2023, 126, 20–35 CrossRef CAS.
- H. M. Solayman, M. A. Hossen, A. Abd Aziz, N. Y. Yahya, K. H. Leong, L. C. Sim, M. U. Monir and K.-D. Zoh, J. Environ. Chem. Eng., 2023, 11, 109610 CrossRef CAS.
- T. Garg, Renu, J. Kaur, P. Kaur, Nitansh, V. Kumar, K. Tikoo, A. Kaushik and S. Singhal, Chem. Eng. J., 2022, 443, 136441 CrossRef CAS.
- B. Zhu, L. Zhang, B. Cheng and J. Yu, Appl. Catal., B, 2018, 224, 983–999 CrossRef CAS.
- A. Kumar, A. Kumar, G. Sharma, A. H. Al-Muhtaseb, M. Naushad, A. A. Ghfar, C. Guo and F. J. Stadler, Chem. Eng. J., 2018, 339, 393–410 CrossRef CAS.
- W. Muhammad, W. Ali, M. A. Khan, F. Ali, A. Zada, M. Z. Ansar and P.-S. Yap, J. Environ. Chem. Eng., 2024, 12, 113409 CrossRef CAS.
- J. Wang and S. Wang, Coord. Chem. Rev., 2022, 453, 214338 CrossRef CAS.
- S. Singh, A. K. Atri, I. Qadir, S. Sharma, U. Manhas and D. Singh, ACS Omega, 2023, 8, 6302–6317 CrossRef CAS PubMed.
- S. K. Sharma, A. Kumar, G. Sharma, M. Naushad, M. Ubaidullah and A. García-Peñas, Colloids Surf., A, 2022, 654, 129968 CrossRef CAS.
- R. R. M. Silva, L. A. M. Ruotolo and F. G. E. Nogueira, Chem. Eng. J., 2023, 476, 146621 CrossRef CAS.
- D. Sun, J. Mao, L. Cheng, X. Yang, H. Li, L. Zhang, W. Zhang, Q. Zhang and P. Li, Chem. Eng. J., 2021, 418, 129417 CrossRef CAS.
- G. Zhao, J. Ding, F. Zhou, X. Chen, L. Wei, Q. Gao, K. Wang and Q. Zhao, Chem. Eng. J., 2021, 405, 126704 CrossRef CAS.
- S. Liu, A. Zada, X. Yu, F. Liu and G. Jin, Chemosphere, 2022, 307, 135717 CrossRef CAS PubMed.
- G. Gebreslassie, P. Bharali, U. Chandra, A. Sergawie, P. K. Baruah, M. R. Das and E. Alemayehu, Appl. Organomet. Chem., 2019, 33, e5002 CrossRef.
- B. Palanivel, C. Ayappan, V. Jayaraman, S. Chidambaram, R. Maheswaran and A. Mani, Mater. Sci. Semicond. Process., 2019, 100, 87–97 CrossRef CAS.
- P. Mishra, L. Acharya and K. Parida, Mater. Today: Proc., 2021, 35, 281–288 CAS.
- C. Li, M. Li, S. Yin, L. Zeng and L. Zhang, J. Alloys Compd., 2021, 861, 157986 CrossRef CAS.
- M. Moradi, B. Kakavandi, A. Bahadoran, S. Giannakis and E. Dehghanifard, Sep. Purif. Technol., 2022, 285, 120313 CrossRef CAS.
- S. A. Hassanzadeh-Tabrizi, J. Photochem. Photobiol., A, 2021, 418, 113398 CrossRef CAS.
- I. F. Waheed, M. A. Hamad, K. A. Jasim and A. J. Gesquiere, Diamond Relat. Mater., 2023, 133, 109716 CrossRef CAS.
- R. Acharya, S. Pati and K. Parida, J. Mol. Liq., 2022, 357, 119105 CrossRef CAS.
- B. Palanivel, C. Hu, M. Shkir, S. AlFaify, F. A. Ibrahim, M. S. Hamdy and A. Mani, Colloid Interface Sci. Commun., 2021, 42, 100410 CrossRef CAS.
- B. Palanivel, M. Shkir, T. Alshahrani and A. Mani, Diam. Relat. Mater., 2021, 112, 108148 CrossRef CAS.
- K. Qi, A. Zada, Y. Yang, Q. Chen and A. Khataee, Res. Chem. Intermed., 2020, 46, 5281–5295 CrossRef CAS.
- H. A. El-Sabban, A. H. Mady, M. A. Diab, S. Y. Attia and S. G. Mohamed, Surf. Interfaces, 2024, 44, 103798 CrossRef CAS.
- S. Ravi Kumar, G. Vishnu Priya, B. Aruna, M. K. Raju, D. Parajuli, N. Murali, R. Verma, K. Mujasam Batoo, R. Kumar and P. V. Lakshmi Narayana, Inorg. Chem. Commun., 2022, 136, 109132 CrossRef CAS.
- P. Kumar, S. Pathak, A. Singh, H. Khanduri, Kuldeep, K. Jain, J. Tawale, L. Wang, G. A. Basheed and R. P. Pant, J. Alloys Compd., 2021, 887, 161418 CrossRef CAS.
- X. Zeng, S. Shu, Y. Meng, H. Wang and Y. Wang, Chem. Eng. J., 2023, 456, 141105 CrossRef CAS.
- V. Vinesh, M. Preeyanghaa, T. R. N. Kumar, M. Ashokkumar, C. L. Bianchi and B. Neppolian, Environ. Res., 2022, 207, 112112 CrossRef CAS PubMed.
- F. Hasanvandian, M. Moradi, S. Aghaebrahimi Samani, B. Kakavandi, S. Rahman Setayesh and M. Noorisepehr, Chemosphere, 2022, 287, 132273 CrossRef CAS PubMed.
- C. Lu, J. Wang, D. Cao, F. Guo, X. Hao, D. Li and W. Shi, Mater. Res. Bull., 2023, 158, 112064 CrossRef CAS.
- S. Solgi, M. S. Seyed Dorraji, S. F. Hosseini, M. H. Rasoulifard, I. Hajimiri and A. Amani-Ghadim, Sci. Rep., 2021, 11, 19339 CrossRef CAS PubMed.
- K. Sun, J. Shen, Q. Liu, H. Tang, M. Zhang, S. Zulfiqar and C. Lei, Chin. J. Catal., 2020, 41, 72–81 CrossRef CAS.
- X. Li, L. Wang, L. Zhang and S. Zhuo, Appl. Surf. Sci., 2017, 419, 586–594 CrossRef CAS.
- S. Gong, Z. Jiang, S. Zhu, J. Fan, Q. Xu and Y. Min, J. Nanopart. Res., 2018, 20, 310 CrossRef.
- W. Wang, H. Zhang, S. Zhang, Y. Liu, G. Wang, C. Sun and H. Zhao, Angew. Chem., Int. Ed., 2019, 58, 16644–16650 CrossRef CAS PubMed.
- M. Hassan, Y. Slimani, M. A. Gondal, M. J. S. Mohamed, S. Güner, M. A. Almessiere, A. M. Surrati, A. Baykal, S. Trukhanov and A. Trukhanov, Ceram. Int., 2022, 48, 24866–24876 CrossRef CAS.
- T. Yang, Y. Tang, F. Yang, J. Qu, X. Yang, Y. Cai, F. Du, C. M. Li and J. Hu, Chem. Eng. J., 2023, 475, 146497 CrossRef CAS.
- K. Nabil, N. Abdelmonem, M. Nogami and I. Ismail, Materials, 2020, 13, 655 CrossRef CAS PubMed.
- B. Padmaja, S. Dhanapandian and K. Ashokkumar, J. Mater. Sci. Eng. B, 2023, 297, 116699 CrossRef CAS.
- X. Wei, X. Wang, Y. Pu, A. Liu, C. Chen, W. Zou, Y. Zheng, J. Huang, Y. Zhang, Y. Yang, M. Naushad, B. Gao and L. Dong, Chem. Eng. J., 2021, 420, 127719 CrossRef CAS.
- H. Chai, C. Yang, P. Xu, P. Wang, J. Qu and G. Zhang, J. Clean. Prod., 2022, 377, 134511 CrossRef CAS.
- G. Palanisamy, N. H. Al-Shaalan, K. Bhuvaneswari, G. Bharathi, G. Bharath, T. Pazhanivel, V. E. Sathishkumar, M. K. Arumugam, S. K. K. Pasha, M. A. Habila and A. El-Marghany, Environ. Res., 2021, 201, 111429 CrossRef CAS PubMed.
- D. Pradhan, L. Mohanty, R. Singhal, E. Falletta and S. K. Dash, Inorg. Chem. Commun., 2023, 156, 111259 CrossRef CAS.
- T. D. Munusamy, C. S. Yee and M. M. R. Khan, Adv. Powder Technol., 2020, 31, 2921–2931 CrossRef CAS.
- Z. Bezu, A. M. Taddesse and I. Diaz, J. Photochem. Photobiol., A, 2024, 449, 115369 CrossRef CAS.
- A. Toghan and A. Modwi, J. Photochem. Photobiol., A, 2021, 419, 113467 CrossRef CAS.
- S. Senobari and A. Nezamzadeh-Ejhieh, J. Mol. Liq., 2018, 257, 173–183 CrossRef CAS.
- S. Guo, G. Zhang and J. Wang, J. Colloid Interface Sci., 2014, 433, 1–8 CrossRef CAS PubMed.
- B. Palanivel, M. Lallimathi, B. Arjunkumar, M. Shkir, T. Alshahrani, K. S. Al-Namshah, M. S. Hamdy, S. Shanavas, M. Venkatachalam and G. Ramalingam, J. Environ. Chem. Eng., 2021, 9, 104698 CrossRef CAS.
- L. Li, J. Gao, Y. Yuan, S. Zhang, M. Liang and Y. Liu, J. Taiwan Inst. Chem. Eng., 2021, 126, 134–144 CrossRef CAS.
- Y. Yao, G. Wu, F. Lu, S. Wang, Y. Hu, J. Zhang, W. Huang and F. Wei, Environ. Sci. Pollut. Res., 2016, 23, 21833–21845 CrossRef CAS PubMed.
- T. Wang, J. Zheng, J. Cai, Q. Liu and X. Zhang, Sci. Total Environ., 2022, 839, 155955 CrossRef CAS PubMed.
- T. T. T. Nguyen, Y. N. N. Nguyen, X. T. Tran, T. T. T. Nguyen and T. V. Tran, J. Environ. Chem. Eng., 2023, 11, 111003 CrossRef CAS.
- R. G. Pearson, Inorg. Chem., 1988, 27, 734–740 Search PubMed.
- M. Moradi, F. Hasanvandian, A. A. Isari, F. Hayati, B. Kakavandi and S. R. Setayesh, Appl. Catal., B, 2021, 285, 119838 CrossRef CAS.
- W. Zhang, S. Zhao, Y. Xing, H. Qin, Q. Zheng, P. Zhang, S. Zhang and X. Xu, Chem. Eng. J., 2022, 442, 136151 CrossRef CAS.
- S. Taghilou, M. R. Mehrasbi, A. Esrafili, E. Dehghanifard, M. Kermani, B. Kakavandi and S. Giannakis, J. Mater. Chem. A, 2024, 12(30), 19532–19550 RSC.
- N. Q. Man, N. T. V. Hoan, N. T. Vinh, L. Van Thanh Son, V. T. Nguyen, P. T. K. Thu, N. Van Hung, L. T. Hieu and D. Q. Khieu, J. Mater. Sci. Mater. Electron., 2024, 35, 114 CrossRef CAS.
- B. El Allaoui, H. Benzeid, N. Zari, A. l. Kacem Qaiss and R. Bouhfid, Int. J. Biol. Macromol., 2024, 259, 128893 CrossRef PubMed.
- B.-E. Channab, M. E. Ouardi, S. E. Marrane, O. A. Layachi, A. E. Idrissi, S. Farsad, D. Mazkad, A. BaQais, M. Lasri and H. A. Ahsaine, RSC Adv., 2023, 13, 20150–20163 RSC.
- K. H. Nasir and H. A. Alshamsi, J. Inorg. Organomet. Polym. Mater. DOI:10.1007/s10904-024-03266-2.
- N. A. Jasim, S. E. Ebrahim and S. H. Ammar, Results Opt., 2023, 13, 100508 CrossRef.
- D. Ma, J. Tang, G. He, Y. Xue, S. Pan, F. Liu and J. Zhao, Mater. Sci. Semicond. Process., 2024, 181, 108672 CrossRef CAS.
- M. Terki, S. Triaa, F. K. Ali, R. Youcef, I. O. Brahim and M. Trari, React. Kinet. Mech. Catal., 2023, 136, 1143–1155 CrossRef CAS.
- M. Saeed, M. Siddique, M. Ibrahim, N. Akram, M. Usman, M. A. Aleem and A. Baig, Environ. Prog. Sustain. Energy, 2020, 39, e13408 CrossRef CAS.
Footnote |
| † Electronic supplementary information (ESI) available. See DOI: https://doi.org/10.1039/d4na00694a |
| This journal is © The Royal Society of Chemistry 2025 |

![[thin space (1/6-em)]](https://www.rsc.org/images/entities/char_2009.gif) log(
log(