 Open Access Article
Creative Commons Attribution 3.0 Unported Licence
Spontaneous switching and fine structure of donor–acceptor Stenhouse adducts on Au(111)†
Anton I.
Senenko
 *a,
Alexandr A.
Marchenko
 a,
Oleksandr
Kurochkin
 ac,
Oleksiy L.
Kapitanchuk
 b,
Mykola
Kravets
 ac,
Vassili G.
Nazarenko
 ac and
Volodymyr
Sashuk
 *ac
*ac
aInstitute of Physics of the National Academy of Sciences of Ukraine, 46 Nauki ave., Kyiv, 03028, Ukraine. E-mail: senenkoanton@gmail.com; vsashuk@ichf.edu.pl
bBogolyubov Institute for Theoretical Physics of the National Academy of Sciences of Ukraine, 14-B Metrologichna str., Kyiv, 03143, Ukraine
cInstitute of Physical Chemistry, Polish Academy of Sciences, Kasprzaka 44/52, 01-224 Warsaw, Poland
First published on 12th November 2024
Abstract
We present the spontaneous isomerization of donor–acceptor Stenhouse adducts anchored onto a gold surface, visualized using scanning tunneling spectroscopy. Our investigation reveals a palette of molecular arrangements, including those with ferroelectric-like ordering, evolving over time into a fine pattern consisting of both open and closed forms of the photoswitch.
Self-assembled monolayers (SAMs) are fundamental to modern nanoscience and nanotechnology.1 Understanding how molecules organize themselves on surfaces is essential for advancing our knowledge of nanoscale phenomena and developing novel materials, especially in the field of electronic devices such as molecular diodes2 and memristors,3 organic field-effect4 transistors, LEDs5 and solar cells.6 Usage of molecular switches as a functional part of molecules is a recent and far-reaching approach which allows external control of physicochemical properties of SAMs. In particular, integration of photochromic units – possessing two or more states differing by dipole moment – with (semi)conducting surfaces7–9 opens new possibilities for electrical signal modulation through remote stimulation.
Among the various techniques used to study photoresponsive SAMs, scanning tunneling microscopy (STM) stands out for its exceptional resolution, enabling visualization down to the level of a single molecule. Previous STM investigations have focused on archetypical azobenzene,10–13 spiropyran14–17 and diarylethene,18 revealing unparalleled behaviors of these photoswitches under confinement. However, there has been a notable absence of studies on donor–acceptor Stenhouse Adducts (DASA),19–21 despite their promising attributes, including responsiveness to visible light and large dipole moment, which are crucial for biocompatibility and electrical conductivity. Herein we present the inaugural exploration of DASA monolayers on a Au(111) surface, uncovering a diverse spectrum of spatially and temporally resolved molecular arrangements linked to the spontaneous switching of the adsorbed chromophores.
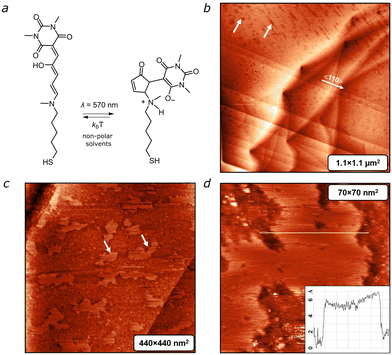
To enable tethering of DASA to the gold surface we utilized a thiol derivative (Fig. 1a) obtained following a procedure published by us elsewhere.22 Detailed synthetic information and the process of preparing structured gold and depositing DASA thereon are provided in the ESI.†Fig. 1b depicts a large-scale STM image of a DASA-coated Au(111) surface captured 2 hours after deposition. The image reveals flat terraces covered with a film that contains randomly distributed pits, which are marked by white arrows. These pits are absent on the bare Au(111) surface, suggesting that these defects are a result of the deposition process. Despite the presence of the DASA film, the atomic 〈110〉 steps of the Au(111) surface remain visible in the scan. This unstructured film persists for about 10 hours. After 15–20 hours, we observe the formation of flat islands (shown in Fig. 1c).
Over time, the lateral size of these islands expands to hundreds of nanometers. It is reasonable to assume that the molecules within the islands adopt a “brush-structure”, indicating an upright position of the molecules relative to the surface, similar to what is typically observed for n-alkanethioles.23 However, the height of the islands, measured from Z-cross sections in Fig. 1d is ∼0.6 nm, which is much less than the length of the single molecule (∼1.8 nm). This suggests that the areas outside the island are still covered with randomly distributed molecules lying on the surface.
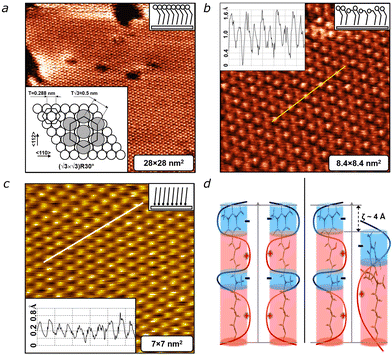
Within the islands (Fig. 2a) the molecules demonstrate a close-packed hexagonal structure with the molecular axis tilted relative to the surface plane. A similar hexagonal arrangement is observed during the adsorption of alkanethiols on Au(111).23 The bright spots seen in Fig. 2a essentially correspond to positions of sulfur atoms chemically bonded with the Au(111) surface. The lateral repeat distance between molecules, measured from the cross-sectional profile (inset in Fig. 2b), is close to 5 ± 0.5 Å. In fact, neighbouring molecules are separated by a distance equal to √3T ≈ 5 Å, where T is the interatomic distance of the Au(111) surface (T = 2.9 Å). Thus, the separation between neighbouring molecules is identical to the distance between second-neighbouring 〈110〉 Au rows (inset in Fig. 2a). This indicates that DASA molecules are bound in equivalent 3-fold adsorption sites of the Au(111).
As a result, the monolayer is commensurate with the Au substrate along the 〈112〉 and 〈110〉 directions. Therefore, it can be concluded that the DASA monolayer adopts a so-called (√3 × √3)R30° structure with basic lattice vectors (a = b = 5 ± 0.2 Å) (Fig. 2a, inset). Similar structures with the same lattice vectors have been observed for n-alkanethiol monolayers on Au(111).24
Contrary to n-alkanethiol monolayers, which remain stable for weeks (Fig. 2c), the DASA film exhibits varying brightness of spots corresponding to the molecule tops (Fig. 2b). Molecules with higher and lower brightness initially appear to be randomly distributed on the surface. Measurements reveal a height difference of approximately 0.4 nm, which corresponds to the height difference between the open and the closed forms of DASA, with the closed form measuring about 1.4 nm (Fig. 2b, inset, Fig. S8, ESI†). This suggests that some molecules demonstrating lower brightness undergo transformation, either spontaneously16,22,25–27 or induced by electric current from the STM tip,11,13 into the cyclic (closed) form. This behavior contrasts with the DASA molecules in solution (toluene/chloroform), where the thermodynamically less stable cyclic form requires continuous illumination to persist, and after the cessation of the latter, quickly (within minutes) thermally relaxes back to the open (linear) form (Fig. S7, ESI†). The observed structural transformation is likely driven by lateral electrostatic interaction between DASA molecules. We consider the following mechanism, which is based on the model of longitudinal surface charge density wave proposed by Madhusudana.28 The DASA molecules with large longitudinal dipole moments, D ≈ 10 Debye (Fig. S8, ESI†),29 can be viewed as cylindrical rods featuring alternating positive and negative electric charges along their long axes (Fig. S9, ESI†). These molecules are chemically immobilized onto the flat surface at a very short distance, R ≈ 5 Å. Consequently, interactions between the like-charged regions have a strong effect on the total energy of SAM structures. We assume that this accumulated electrostatic interaction energy may trigger the transition to the closed form. A shift of one DASA molecule relative to its adjacent molecule by half the period, ζ, of the charged wave produces strong electrostatic attraction between the two oriented in a syn-polar fashion, as illustrated in Fig. 2d. The energy reaches a minimum when the positively charged regions of one DASA molecule align with the negatively charged regions of the neigbouring molecule. The incompleteness of the process can be attributed to the strengthening of electrostatic repulsion associated with the further build-up of the closed molecular forms, as well as a limited degree of freedom and flexibility within the SAM. The bulky DASA heads in the closed form may hinder efficient and complete isomerization of all adsorbed molecules. Thus, the molecular architecture within the SAM is rather influenced by the delicate balance between a number of molecules in linear and cyclic forms.
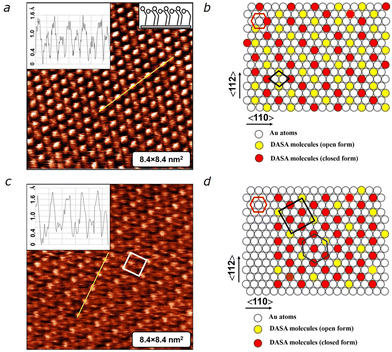
To trace the evolution of the monolayer, we carried out STM measurements over several days. After 50 hours, we noted the emergence of a “zig-zag” structure exhibiting a regular arrangement of bright and dark spots, indicative of two different conformations of DASA molecules within the monolayer (Fig. 3a). The schematic packing model depicted in Fig. 3b illustrates the ordering, where the “zig-zag” pattern consists of open-form (yellow circles) and closed-form (red circles) molecules, suggesting the coexistence of two equivalent structures. This molecular arrangement persisted for approximately 10–20 hours. However, around the 70 hour mark, we observed the appearance of signs of a rectangular structure (Fig. 3c). As shown in the schematic packing model (Fig. 3d), the adsorption sites remained in their original positions, forming a well-known (√3 × √3)R30° structure (with the unit cell marked by a blue hexagon). Simultaneously, the molecular backbones in the open form (yellow circles) assembled into a rectangular c(4 × 2) superstructure (indicated by the rectangle). Ultimately, the DASA monolayer adopted a hexagonal (√3 × √3)R30° structure modulated by the rectangular c(4 × 2) superstructure (Fig. 3d). This structure remained stable for several days, representing the culmination of the structural evolution of the DASA monolayer. The observed intermediate “random” and “zig-zag” structures correspond to metastable states of the monolayer.
It is noteworthy that the field strength in the tunneling gap during scanning can be relatively high, reaching up 109 V m−1, which is close to the desorption field. Naturally, this raises question about the potential influence of the STM tip on the structural evolution of DASA monolayer. To address this concern, we conducted an experiment, where the DASA monolayer was left undisturbed for 4 days after deposition, without any scanning control. Remarkably, we found that the resulting structure remains consistent with the previously observed (√3 × √3)R30° structure modulated by the c(4 × 2) superstructure. This experiment provides evidence that the structural evolution of DASA monolayer occurs solely under the influence of thermal and electrostatic energies, without significant perturbation from the STM tip.
The arrangement of the DASA monolayer does not inherently rely on the light sensitivity of the DASA molecules, which spontaneously align on the gold surface due to their chemical nature and large permanent dipole moments. To investigate the effect of light on the self-assembly of the DASA monolayer, we conducted experiments under illumination (532 nm) at intensities ranging from 3 to 240 mW cm−2. Surprisingly, no structural ordering of the monolayer was observed after this treatment. This can be explained by considering the unit cells in Fig. 3, which consist of molecules in both open and closed forms. This coexistence appears to be a necessary condition for forming the “zig-zag” structure and the final hexagonal (√3 × √3)R30° arrangement, modulated by the rectangular c(4 × 2) superstructure. In contrast, under illumination, all DASA molecules in the monolayer adopt the same bent conformation, which likely imposes geometric and electrostatic limitations that prevent the formation of a well-ordered structure detectable by STM.
Conclusions
In summary, we demonstrated highly ordered self-assembled monolayers of DASA photochromes obtained through liquid deposition on a reconstructed Au(111). Using STM under ambient conditions, we observed the structural evolution of these monolayers over several days, progressing from initial disorder through metastable phases to the stable final structure. The self-assembly process is accompanied by the gradual increase in the population of the closed form of DASA, facilitated by coulombic stabilization, resulting in the emergence of a distinctive dipole architecture on the metal surface. The resultant monolayer can be regarded as a novel class of polar SAMs, holding significant promise for applications in optoelectronic technologies.Author contributions
A. I. S. – investigation, data curation, methodology; visualization; A. A. M. – conceptualization, supervision, writing – original draft; O. K. – formal analysis; O. L. K. – formal analysis; M. K. – investigation, methodology; V. G. N. – project administration, conceptualization, funding acquisition; writing – review & editing; V. S. – conceptualization, resources, funding acquisition; writing – review & editing.Data availability
The data supporting this article have been included as part of the ESI.†Detailed synthetic information, scanning tunneling microscopy and quantum-chemical calculations.
Conflicts of interest
There are no conflicts to declare.Acknowledgements
This work was supported by NASU via the projects No. 0121U109816, 0123U100832 and the Long-term program of support of the Ukrainian research teams at the Polish Academy of Sciences carried out in collaboration with the U.S. National Academy of Sciences with the financial support of external partners via the agreement No. PAN.BFB.S.BWZ.356.022.2023. The authors acknowledge funding from the NATO SPS project G6030.References
- J. C. Love, L. A. Estroff, J. K. Kriebel, R. G. Nuzzo and G. M. Whitesides, Chem. Rev., 2005, 105, 1103 CrossRef CAS PubMed.
- X. Chen, M. Roemer, L. Yuan, W. Du, D. Thompson, E. del Barco and C. A. Nijhuis, Nat. Nanotechnol., 2017, 12, 797 CAS.
- Y. Wang, Q. Zhang, H. P. A. G. Astier, C. Nickle, S. Soni, F. A. Alami, A. Borrini, Z. Zhang, C. Honnigfort, B. Braunschweig, A. Leoncini, D.-C. Qi, Y. Han, E. del Barco, D. Thompson and C. A. Nijhuis, Nat. Mater., 2022, 21, 1403 CAS.
- S. Kobayashi, T. Nishikawa, T. Takenobu, S. Mori, T. Shimoda, T. Mitani, H. Shimotani, N. Yoshimoto, S. Ogawa and Y. Iwasa, Nat. Mater., 2004, 3, 317 CrossRef CAS.
- Y. S. Shin, S. Ameen, E. Oleiki, J. Yeop, Y. Lee, S. Javaid, C. B. Park, T. Song, D. Yuk, H. Jang, Y. J. Yoon, W. Lee, G. Lee, B. Kim and J. Y. Kim, Adv. Opt. Mater., 2022, 10, 2201313 CrossRef CAS.
- Z. Dai, S. K. Yadavalli, M. Chen, A. Abbaspourtamijani, Y. Qi and N. P. Padture, Science, 2021, 372, 618 CrossRef CAS.
- M. Suda, R. Kato and H. M. Yamamoto, Science, 2015, 347, 743 CrossRef CAS PubMed.
- C. Jia, A. Migliore, N. Xin, S. Huang, J. Wang, Q. Yang, S. Wang, H. Chen, D. Wang, B. Feng, Z. Liu, G. Zhang, D.-H. Qu, H. Tian, M. A. Ratner, H. Q. Xu, A. Nitzan and X. Guo, Science, 2016, 352, 1443 CrossRef CAS PubMed.
- E. Orgiu, N. Crivillers, M. Herder, L. Grubert, M. Pätzel, J. Frisch, E. Pavlica, D. T. Duong, G. Bratina, A. Salleo, N. Koch, S. Hecht and P. Samorì, Nat. Chem., 2012, 4, 675 CrossRef CAS PubMed.
- G. Pace, V. Ferri, C. Grave, M. Elbing, C. von Hänisch, M. Zharnikov, M. Mayor, M. A. Rampi and P. Samorì, Proc. Natl. Acad. Sci. U. S. A., 2007, 104, 9937 CrossRef CAS PubMed.
- C. Nacci, M. Baroncini, A. Credi and L. Grill, Angew. Chem., Int. Ed., 2018, 57, 15034 CrossRef CAS PubMed.
- T. R. Rusch, A. Schlimm, N. R. Krekiehn, T. Tellkamp, Š. Budzák, D. Jacquemin, F. Tuczek, R. Herges and O. M. Magnussen, Angew. Chem., Int. Ed., 2020, 59, 17192 Search PubMed.
- M. Alemani, M. V. Peters, S. Hecht, K.-H. Rieder, F. Moresco and L. Grill, J. Am. Chem. Soc., 2006, 128, 14446 CAS.
- C. Dri, M. V. Peters, J. Schwarz, S. Hecht and L. Grill, Nat. Nanotechnol., 2008, 3, 649 CrossRef CAS PubMed.
- M. Gobbi, A. Galanti, M.-A. Stoeckel, B. Zyska, S. Bonacchi, S. Hecht and P. Samorì, Nat. Commun., 2020, 11, 4731 CrossRef CAS.
- M. Piantek, G. Schulze, M. Koch, K. J. Franke, F. Leyssner, A. Krüger, C. Navío, J. Miguel, M. Bernien, M. Wolf, W. Kuch, P. Tegeder and J. I. Pascual, J. Am. Chem. Soc., 2009, 131, 12729 CrossRef CAS PubMed.
- M. Gobbi, S. Bonacchi, J. X. Lian, A. Vercouter, S. Bertolazzi, B. Zyska, M. Timpel, R. Tatti, Y. Olivier, S. Hecht, M. V. Nardi, D. Beljonne, E. Orgiu and P. Samorì, Nat. Commun., 2018, 9, 2661 Search PubMed.
- S. V. Snegir, A. A. Marchenko, P. Yu, F. Maurel, O. L. Kapitanchuk, S. Mazerat, M. Lepeltier, A. Léaustic and E. Lacaze, J. Phys. Chem. Lett., 2011, 2, 2433 CrossRef CAS.
- S. Helmy, F. A. Leibfarth, S. Oh, J. E. Poelma, C. J. Hawker and J. Read de Alaniz, J. Am. Chem. Soc., 2014, 136, 8169 Search PubMed.
- M. M. Lerch, W. Szymański and B. L. Feringa, Chem. Soc. Rev., 2018, 47, 1910 Search PubMed.
- M. Clerc, S. Sandlass, O. Rifaie-Graham, J. A. Peterson, N. Bruns, J. Read de Alaniz and L. F. Boesel, Chem. Soc. Rev., 2023, 52, 8245 RSC.
- G. Sobczak, I. Misztalewska-Turkowicz and V. Sashuk, J. Phys. Chem. C, 2021, 125, 5306 Search PubMed.
- G. E. Poirier, Chem. Rev., 1997, 97, 1117 Search PubMed.
- A. Ulman, Chem. Rev., 1996, 96, 1533 Search PubMed.
- J. Ahrens, T. Bian, T. Vexler and R. Klajn, ChemPhotoChem, 2017, 1, 230 Search PubMed.
- D. E. Nánási, A. Kunfi, Á. Ábrahám, P. J. Mayer, J. Mihály, G. F. Samu, É. Kiss, M. Mohai and G. London, Langmuir, 2021, 37, 3057 Search PubMed.
- B. Bończak and M. Fiałkowski, J. Phys. Chem. C, 2022, 126, 7096 Search PubMed.
- N. V. Madhusudana, Phys. Rev. E, 2021, 104, 014704 CrossRef CAS PubMed.
- A. D. Laurent, M. Medveď and D. Jacquemin, ChemPhysChem, 2016, 17, 1846 CrossRef CAS PubMed.
Footnote |
| † Electronic supplementary information (ESI) available. See DOI: https://doi.org/10.1039/d4nr03942d |
| This journal is © The Royal Society of Chemistry 2025 |


