 Open Access Article
Comparative evaluation of cocrystalline and coamorphous forms comprised of gefitinib and dasatinib for performance optimization†
Xian-Bi
Shi
a,
Zhi-Qing
Wang
a,
Hui-Tian
Li
b,
Xia-Lin
Dai
b,
Xiang-Tian
Long
*c,
Yong-Liang
Huang
 d,
Jia-Mei
Chen
 *b and
Tong-Bu
Lu
 a
a
aInstitute for New Energy Materials and Low Carbon Technologies, School of Materials Science and Engineering, Tianjin University of Technology, Tianjin 300384, China
bSchool of Chemistry and Chemical Engineering, Tianjin University of Technology, Tianjin 300384, China. E-mail: chenjiamei@email.tjut.edu.cn
cTasly Academy, Tasly Holding Group Co., Ltd, Tianjin 300410, China. E-mail: njulxt@163.com
dDepartment of Chemistry, Shantou University Medical College, Shantou, Guangdong 515041, China
First published on 22nd January 2025
Abstract
Drug–drug cocrystals and coamorphous systems, both comprising two drugs in a single phase, can be applied to concurrently improve the physicochemical properties of the involved drugs. The comparative evaluation of cocrystalline and coamorphous forms comprised of a given drug combination aid in finding the optimal solid form for the development of synergistic formulations. Gefitinib (GTB) and dasatinib (DAS) are oral tyrosine kinase inhibitors exhibiting synergistic effects against cancer cells. However, they both belong to BCS II drugs showing solubility that differ by several times. To optimize the performance of hybrid drugs, one cocrystal (GTB-DAS·2H2O) and one coamorphous solid form (GTB-DAS CM) were successfully prepared and fully characterized by XRD, 1H NMR, TG, DSC, FTIR and DVS measurements. Crystal structural and Hirshfeld surface analysis shows GTB molecular layers are intercalated with layers of DAS via van der Waals interactions and weak hydrogen bonding interactions in the cocrystal. The stability and tabletability properties of GTB-DAS·2H2O and GTB-DAS CM were evaluated, and the dissolution performance was studied in terms of Tmax (time to peak drug concentration), Cmax (maximum drug concentration) and AUC (area under the curve of dissolution profiles). Overall, GTB-DAS·2H2O shows superior stability and tabletability properties, and synchronized drug release with improved dissolution performance, making it a more promising and reliable solid form for the development of combinational therapy.
1. Introduction
The combination of multiple drugs has become an emerging drug development strategy for the treatment of many complex diseases, such as HIV/AIDS, cancer, cardiovascular disease, etc.1,2 The drug combinations exhibit numerous advantages such as synergistic effects, reduced adverse events and drug resistance, good patient compliance and lower managerial and manufacturing costs compared with monotherapy.3–5 However, the development of drug combinations usually suffers from issues on incompatibility of stability and solubility of parent drugs, which seriously restrict their advantages and bring about huge risks.6,7 Drug–drug cocrystalline and coamorphous systems, both comprising two drugs in a single phase, have the potential to concurrently improve the physicochemical properties of the involved drugs, and can be applied to address the aforementioned issues to facilitate the development of combination therapies.8–11 Several commercial drug–drug cocrystalline products have already been approved (e.g. Gravol®, Dichloralphenazone®, and Entresto®),12–14 and some examples of drug–drug coamorphous systems have already been reported.15–18 However, little investigation has yet been carried out on systematically comparing physicochemical characteristics of cocrystalline and coamorphous forms consisting of a given drug combination, with the intention to find the optimal solid form for the development of synergistic formulations.19Gefitinib (GTB, Scheme 1) is an oral tyrosine kinase inhibitor marketed for patients with non-small cell lung cancer treatment.20 However, the clinical efficacy of GTB is limited due to its acquired resistance after nine to twelve months of treatment.21 Dasatinib (DAS, Scheme 1) is an oral multi-targeted tyrosine kinase inhibitor for the treatment of chronic myelogenous leukemia.22 The combination of DAS and GTB has been evaluated on GTB-resistant lung cancer cells and shows enhanced killing effects.23 The DAS and GTB combination also represents a promising new therapeutic modality for ovarian cancer.24,25 Both GTB and DAS belong to the class II drugs of the biopharmaceutical classification system, and their solubility differs by several times.26,27 This may lead to incompatibility issues of the hybrid drugs, and subsequently impact the exertion of their synergistic effect for cancer treatment.
To optimize the performance of hybrid drugs and facilitate the development of combination therapies, we report multi-component solid forms involving GTB and DAS that can exist both in cocrystalline and coamorphous states. The obtained cocrystal and coamorphous system has been fully characterized by XRD, 1H NMR, TG, DSC, FTIR and DVS measurements. Crystal structural and Hirshfeld surface analysis of the cocrystal was carried out to help understand the role and significance of different types of intermolecular interactions responsible for crystal packing. The amorphization of GTB-DAS was confirmed as a halo pattern in PXRD measurements and a single glass transition event in the DSC curves. The stability and tabletability properties of cocrystalline and coamorphous solid forms were evaluated, and the dissolution performance was studied in terms of Tmax (time to peak drug concentration), Cmax (maximum drug concentration) and AUC (area under the curve of dissolution profiles), aiming to find the optimal solid form for the development of synergistic formulations.
2. Materials and methods
2.1 Materials
GTB and DAS were purchased from Shanghai Shengde Chemical Co. Ltd (China). All other chemicals and solvents were obtained from various commercial sources and used without further purification.2.2 Preparation and characterization
![[thin space (1/6-em)]](https://www.rsc.org/images/entities/b_char_2009.gif) :
:![[thin space (1/6-em)]](https://www.rsc.org/images/entities/b_char_2009.gif) 1
1![[thin space (1/6-em)]](https://www.rsc.org/images/entities/b_char_2009.gif) :
:![[thin space (1/6-em)]](https://www.rsc.org/images/entities/b_char_2009.gif) 2).
GTB-DAS·2H2O was obtained by the following three methods. (I) A liquid-assisted milling method was used for cocrystal screening. A powdered mixture of GTB (8.9 mg, 0.02 mmol) and DAS·H2O (10.1 mg, 0.02 mmol) was ground with 10 μL of methanol using a Retsch MM 400 mixer mill at a frequency of 20 Hz for 30 min. (II) A rapid evaporation method was used for cocrystal screening. A powdered mixture of GTB (8.9 mg, 0.02 mmol) and DAS·H2O (10.1 mg, 0.02 mmol) was added to 30 mL of anhydrous methanol, and the resulting suspension was stirred at 40 °C until the solids were completely dissolved. The solution was naturally cooled and filtered. The filtrate was treated using a rotary evaporator to quickly remove the solvent. (III) A slurry method was used to prepare bulk samples for characterization and property evaluation. An equimolar mixture of GTB (89.1 mg, 0.2 mmol) and DAS·H2O (101.2 mg, 0.2 mmol) was added to a solvent mixture of 2 mL n-heptane and 100 μL methanol and was then stirred for 24 h at room temperature. The resulting suspension was filtered and the obtained white solid was dried under air. Yield: 172.4 mg, 87.2%.
2).
GTB-DAS·2H2O was obtained by the following three methods. (I) A liquid-assisted milling method was used for cocrystal screening. A powdered mixture of GTB (8.9 mg, 0.02 mmol) and DAS·H2O (10.1 mg, 0.02 mmol) was ground with 10 μL of methanol using a Retsch MM 400 mixer mill at a frequency of 20 Hz for 30 min. (II) A rapid evaporation method was used for cocrystal screening. A powdered mixture of GTB (8.9 mg, 0.02 mmol) and DAS·H2O (10.1 mg, 0.02 mmol) was added to 30 mL of anhydrous methanol, and the resulting suspension was stirred at 40 °C until the solids were completely dissolved. The solution was naturally cooled and filtered. The filtrate was treated using a rotary evaporator to quickly remove the solvent. (III) A slurry method was used to prepare bulk samples for characterization and property evaluation. An equimolar mixture of GTB (89.1 mg, 0.2 mmol) and DAS·H2O (101.2 mg, 0.2 mmol) was added to a solvent mixture of 2 mL n-heptane and 100 μL methanol and was then stirred for 24 h at room temperature. The resulting suspension was filtered and the obtained white solid was dried under air. Yield: 172.4 mg, 87.2%.
![[thin space (1/6-em)]](https://www.rsc.org/images/entities/char_2009.gif) :
:![[thin space (1/6-em)]](https://www.rsc.org/images/entities/char_2009.gif) 1
1![[thin space (1/6-em)]](https://www.rsc.org/images/entities/char_2009.gif) :
:![[thin space (1/6-em)]](https://www.rsc.org/images/entities/char_2009.gif) 2) were obtained after 3–4 days. A powdered mixture of GTB (4.5 mg, 0.01 mmol) and DAS·H2O (5.1 mg, 0.01 mmol) was added to 4 mL of mixed solvent of methanol and water with a volume ratio of 1/1 and then treated by ultrasound. The resulting solution was filtered and the filtrate was then allowed to evaporate slowly at 4 °C. Colorless rod-shaped single crystals of GTB-DAS·2MeOH (1
2) were obtained after 3–4 days. A powdered mixture of GTB (4.5 mg, 0.01 mmol) and DAS·H2O (5.1 mg, 0.01 mmol) was added to 4 mL of mixed solvent of methanol and water with a volume ratio of 1/1 and then treated by ultrasound. The resulting solution was filtered and the filtrate was then allowed to evaporate slowly at 4 °C. Colorless rod-shaped single crystals of GTB-DAS·2MeOH (1![[thin space (1/6-em)]](https://www.rsc.org/images/entities/char_2009.gif) :
:![[thin space (1/6-em)]](https://www.rsc.org/images/entities/char_2009.gif) 1
1![[thin space (1/6-em)]](https://www.rsc.org/images/entities/char_2009.gif) :
:![[thin space (1/6-em)]](https://www.rsc.org/images/entities/char_2009.gif) 2) or GTB-DAS (1
2) or GTB-DAS (1![[thin space (1/6-em)]](https://www.rsc.org/images/entities/char_2009.gif) :
:![[thin space (1/6-em)]](https://www.rsc.org/images/entities/char_2009.gif) 1) were obtained after 3–4 days.
1) were obtained after 3–4 days.
 | (1) |
 | (2) |
2.3 Property evaluations
 | (3) |
The tabletability profiles were obtained by plotting the tensile strength as a function of compaction pressure. Three groups (n = 3) were tested in parallel for each experiment to assess standard deviations. PXRD tests were performed on the 350 MPa samples to determine whether any pressure-induced phase transformation had occurred. Environmental conditions were 20–30% RH and 20–25 °C throughout the compaction study.
3. Results and discussion
3.1 Sample preparation
The cocrystal hydrate GTB-DAS·2H2O was discovered by liquid-assisted grinding or rotary evaporation, and the phase-pure bulk sample of it was prepared by the slurry technique. According to variable-temperature PXRD and thermal analyses, it was found that GTB-DAS·2H2O converts into an anhydrous GTB-DAS by heating to 120 °C to remove water molecules from the lattice. However, no bulk samples of the anhydrate were obtained as it quickly converts back to GTB-DAS·2H2O under ambient conditions. Good-quality single crystals of GTB-DAS·2H2O were successfully harvested by the evaporation of the methanol solution saturated with GTB-DAS·2H2O at room temperature. In contrast, slow evaporation of the methanol–water (with 1![[thin space (1/6-em)]](https://www.rsc.org/images/entities/char_2009.gif) :
:![[thin space (1/6-em)]](https://www.rsc.org/images/entities/char_2009.gif) 1 volume ratio) solution of an equimolar mixture of GTB and DAS·H2O at 4 °C resulted in single crystals of GTB-DAS·2MeOH, which were serendipitously contaminated by a few single crystals of GTB-DAS. Unfortunately, the single crystals of GTB-DAS could not be reproduced afterwards.
1 volume ratio) solution of an equimolar mixture of GTB and DAS·H2O at 4 °C resulted in single crystals of GTB-DAS·2MeOH, which were serendipitously contaminated by a few single crystals of GTB-DAS. Unfortunately, the single crystals of GTB-DAS could not be reproduced afterwards.
The experimental technique used in this work to attain amorphous and coamorphous samples was ball milling. Milling of an equimolar mixture of GTB and DAS·H2O for 180 min resulted in the complete amorphization of the sample and the formation of a coamorphous mixture (GTB-DAS CM). Similar milling experiments performed for individual GTB and DAS·H2O also led to the conversion of the crystalline materials into amorphous forms (designated here as GTB AM and DAS AM). It is noteworthy that GTB AM only remains in its amorphous state for a few days due to its high crystallization tendency under ambient conditions.
3.2 PXRD and 1H NMR analysis
PXRD and 1H NMR analysis were utilized to characterize the powdered sample of GTB-DAS·2H2O. The presence of new diffraction peaks and the absence of characteristic peaks of the individual components on PXRD patterns prove that a new crystalline form was produced (Fig. 1). The recorded pattern of GTB-DAS·2H2O matches well with the simulated PXRD pattern calculated from the single-crystal structure, indicating the phase purity and homogeneity of the bulk sample (Fig. 1). The PXRD patterns of GTB AM, DAS AM, and GTB-DAS CM show typical halos without any signs of crystalline peaks, which are clear characteristics of an amorphous system (Fig. 1).281H NMR analysis further confirmed the chemical components and stoichiometric ratio of GTB-DAS·2H2O (Fig. S1†). The spectra exhibit chemical shifts of GTB and DAS without any peaks of impurity. 1H NMR chemical shift assignments of each chemical component are as follows: peaks of GTB (ppm), δ 9.58 (s, 1H), 8.50 (s, 1H), 8.13 (dd, J = 6.9, 2.7 Hz, 1H), 7.84–7.75 (m, 2H), 7.46 (t, J = 9.1 Hz, 1H), 7.21 (s, 1H), 4.19 (t, J = 6.4 Hz, 2H), 3.94 (s, 3H), 3.59 (t, J = 4.6 Hz, 4H), 2.41 (s, 6H), 2.01 (p, J = 6.7 Hz, 2H);29 peaks of DAS (ppm), δ 11.50 (s, 1H), 9.90 (s, 1H), 8.23 (s, 1H), 7.41 (dd, J = 7.5, 1.9 Hz, 1H), 7.35–7.19 (m, 2H), 6.05 (s, 1H), 4.48 (t, J = 5.4 Hz, 1H), 3.53 (dt, J = 12.4, 6.1 Hz, 6H), 2.50–2.39 (m, 9H), 2.24 (s, 3H).30 The combination of PXRD and 1H NMR results indicate the cocrystalline nature of this new crystalline form. By integrating characteristic proton signals of individual components in the 1H NMR spectra, GTB-DAS·2H2O shows a 1![[thin space (1/6-em)]](https://www.rsc.org/images/entities/char_2009.gif) :
:![[thin space (1/6-em)]](https://www.rsc.org/images/entities/char_2009.gif) 1 stoichiometric ratio of GTB and DAS.
1 stoichiometric ratio of GTB and DAS.
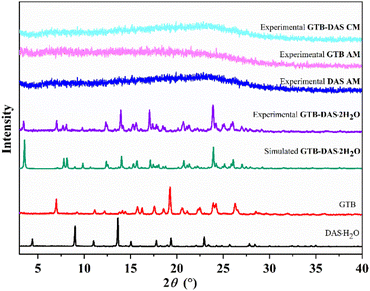 | ||
| Fig. 1 PXRD patterns of GTB-DAS·2H2O and starting components, as well as GTB-DAS CM, GTB AM and DAS AM. | ||
3.3 Thermal analysis
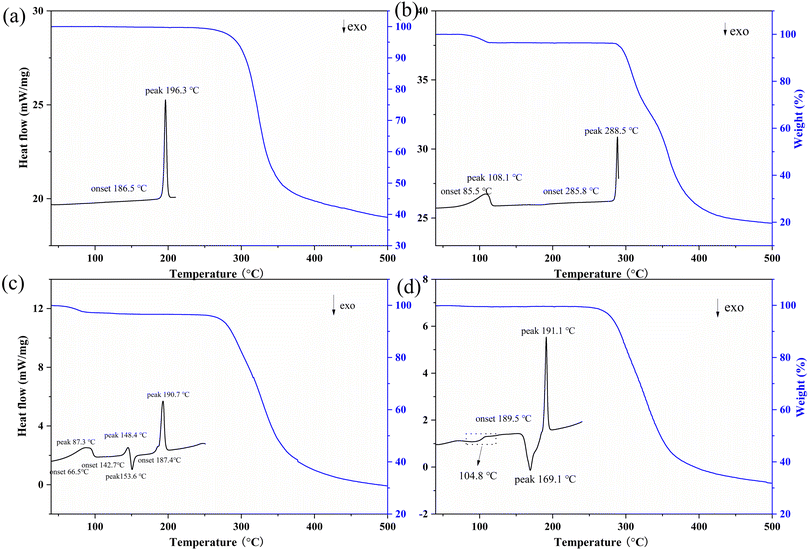
Thermal analysis was then carried out by TG and DSC measurements (Fig. 2). PXRD was employed to monitor possible phase transitions along with heating (Fig. S2 and S3†). The TG-DSC curve of GTB shows that it is a solvent-free form with a melting endothermic peak at 196.3 °C (Fig. 2a). The TG curve of DAS·H2O exhibits a weight loss of 3.5% corresponding to the loss of the crystalline water (calcd 3.6%). The DSC curve of DAS·H2O shows an endothermic peak at 108.1 °C corresponding to the dehydration process, and an endothermic peak at 288.5 °C attributed to the melting and decomposition process (Fig. 2b).The TG curve of GTB-DAS·2H2O shows a weight loss of 3.6% below 100 °C, corresponding to the loss of two water molecules from the lattice (calc. 3.7%) (Fig. 2c). The DSC curve of GTB-DAS·2H2O demonstrates three endothermic peaks at 87.3 °C, 148.4 °C and 190.7 °C as well as one exothermic peak at 153.6 °C (Fig. 2c), which corresponds to multi-step phase transformations, and were further confirmed by variable temperature PXRD analysis (Fig. S2†). The first endothermic peak at 87.3 °C can be attributed to the loss of crystalline water, leading to the formation of anhydrous GTB-DAS, which is consistent with the phase change between 100 and 120 °C in variable temperature PXRD diffractograms. The second endothermic peak at 148.4 °C is followed by the exothermic peak at 153.6 °C, corresponding to the phase transition from GTB-DAS to a physical mixture of GTB and DAS. It is also proved by the change of PXRD patterns from 140 to 145 °C. The last endothermic peak at 190.7 °C points to the melting of GTB and only DAS being left, which is further confirmed from the change of PXRD diffractograms in the temperature range of 180–200 °C. Finally, the crystalline phase of DAS stays until the temperature cooled back to 25 °C.
Three distinct phase transitions were observed on the DSC profile of GTB-DAS CM, namely, a glass transition at 104.8 °C, which is followed by an exothermal crystallization event at 169.1 °C, and an endothermic melting event at 191.1 °C (Fig. 2d). The appearance of a single Tg for the coamorphous mixture indicates the formation of a homogeneous phase rather than a physical mixture of amorphous GTB and DAS. The PXRD analysis was performed to identify the phase composition of the material crystallized at 169.1 °C, and the result shows that it was a physical mixture of crystalline GTB and DAS. Then the endothermic event occurring at 191.1 °C could be attributed to the melting of GTB.
Furthermore, MDSC was carried out for GTB-DAS CM with amorphous GTB and DAS as controls (Fig. S4–S6†). The MDSC thermograms demonstrate Tg values of 68.4 ± 0.1 °C and 134.1 ± 0.1 °C for single amorphous GTB and DAS, respectively. For GTB-DAS CM, a single Tg value of 100.4 ± 0.1 °C was determined, which is between those of the single amorphous drugs and is close to the conventional DSC data of GTB-DAS CM. The theoretical Tg value of the coamorphous system can be calculated using the Gordon–Taylor formula, and the strength of the interaction between components can be judged by comparing with the measured Tg.31 The experimental Tg value (100.4 ± 0.1 °C) of GTB-DAS CM exhibits a slight positive deviation from the theoretical Tg value (98.7 °C), indicating that no significant molecular interactions exist between GTB and DAS in the coamorphous state.32
3.4 Crystal structure and the Hirshfeld surface analysis
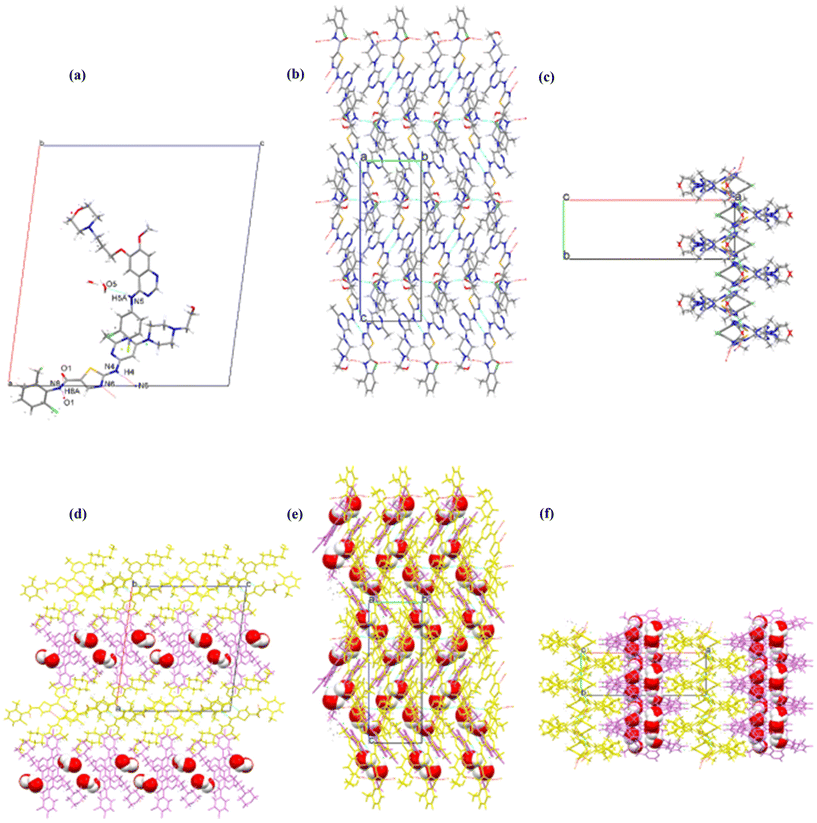
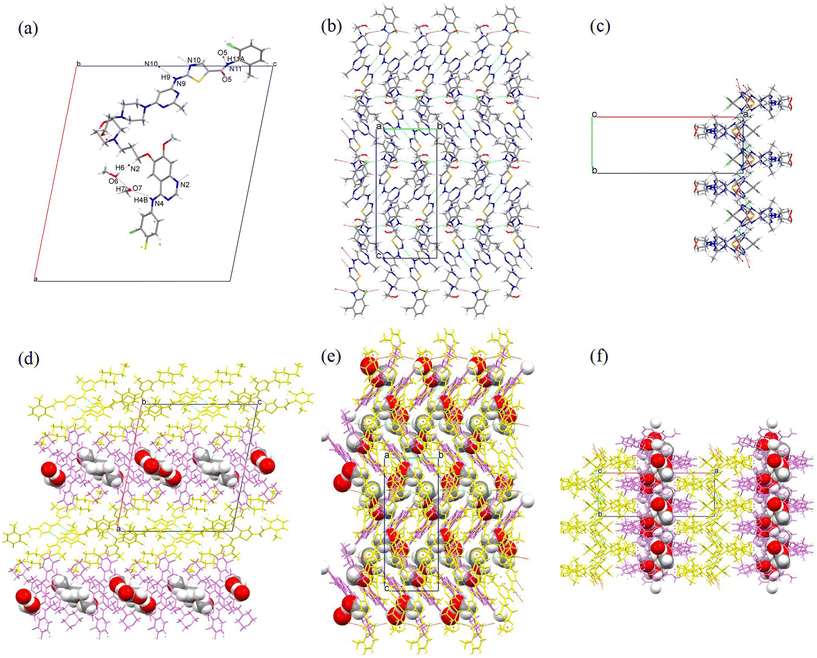
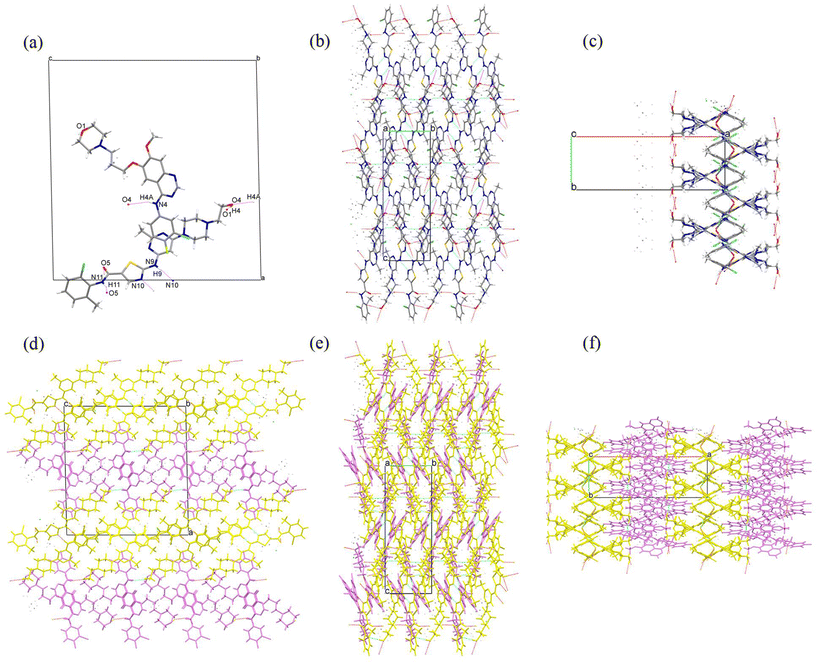
Single crystals of GTB-DAS·2H2O, GTB-DAS·2MeOH and GTB-DAS were determined and resolved. Table 1 presents the collected crystallographic data, and Table 2 lists the hydrogen bonding geometry parameters. All three cocrystals belong to the monoclinic P21/n space group with similar unit cells (Table 1). The asymmetric units of GTB-DAS·2H2O and GTB-DAS·2MeOH consist of one molecule of GTB, one molecule of DAS, and two molecules of water/methanol (Fig. 3a and 4a) while that of GTB-DAS contains one molecule each of GTB and DAS (Fig. 5a). In all cocrystals, two DAS molecules pair up through double N–H⋯N hydrogen bonding interactions of thiazole nitrogen with the amino group at its ortho position to form a dimer, which further connects via N–H⋯O hydrogen bonding interactions of the amide group to produce a one-dimensional (1D) DAS chain. Adjacent DAS chains alternately link together with an angle to form a two-dimensional (2D) wavy layer (Fig. 3b, c, 4b, c and 5b, c). GTB molecules in GTB-DAS·2H2O and GTB-DAS·2MeOH are embedded in the concave of neighbouring DAS layers through weak O4–H4A⋯N2/N2A (2.756 Å, 134.8°/2.864 Å, 133.8°) and O4–H4A⋯N1 (2.864 Å, 143.3°) hydrogen bonding interactions, respectively, to generate a three-dimensional (3D) framework containing water/methanol molecules in 1D channels comprised of GBT (Fig. 3df and 4df). In contrast, GTB molecules in GTB-DAS insert into the concave of neighbouring DAS layers through relatively strong N4–H4A⋯O4 and O4–H4⋯O1 hydrogen bonding interactions to generate a 3D framework without any channels (Fig. 5d–f).| Compound | GTB-DAS·2H2O | GTB-DAS·2MeOH | GTB-DAS |
|---|---|---|---|
| a R 1 = ∑||Fo| − |Fc||/∑|Fo|. b wR2 = [∑[w(Fo2 − Fc2)2]/∑w(Fo2)2]1/2, w = 1/[σ2(Fo)2 + (aP)2 + bP], where P = [(Fo2) + 2Fc2]/3. | |||
| Chem. formula | C44H54Cl2FN11O7S | C46H58Cl2FN11O7S | C44H50Cl2FN11O5S |
| Formula wt. | 970.94 | 998.99 | 934.91 |
| Temp (K) | 295(10) | 150(10) | 295(10) |
| Cryst. syst. | Monoclinic | Monoclinic | Monoclinic |
| Space group | P21/n | P21/n | P21/n |
| Crystal size (mm3) | 0.1 × 0.08 × 0.06 | 0.1 × 0.05 × 0.05 | 0.1 × 0.06 × 0.04 |
| a (Å) | 25.0616(14) | 24.6417(3) | 24.0553(11) |
| b (Å) | 8.5546(9) | 9.01060(10) | 8.2878(4) |
| c (Å) | 22.8246(13) | 22.0764(3) | 22.7287(7) |
| α (°) | 90 | 90 | 90 |
| β (°) | 97.457(5) | 101.2970(10) | 91.233(3) |
| γ (°) | 90 | 90 | 90 |
| V (Å3) | 4852.0(6) | 4806.79(10) | 4530.3(3) |
| Z | 4 | 4 | 4 |
| Density (g cm−3) | 1.325 | 1.380 | 1.371 |
| 2θ range | 7.812–161.092 | 7.316–159.386 | 7.352–159.366 |
| F (000) | 2040 | 2104 | 1960 |
| Index ranges | −31 ≤ h ≤ 31 | −31 ≤ h ≤ 30 | −29 ≤ h ≤ 30 |
| −10 ≤ h ≤ 8 | −8 ≤ h ≤ 11 | −8 ≤ k ≤ 10 | |
| −28 ≤ h ≤ 29 | −28 ≤ h ≤ 25 | −28 ≤ l ≤ 22 | |
| No. of reflns | 10![[thin space (1/6-em)]](https://www.rsc.org/images/entities/char_2009.gif) 082 082 |
10![[thin space (1/6-em)]](https://www.rsc.org/images/entities/char_2009.gif) 229 229 |
6839 |
| No. of unique reflns | 6266 | 9014 | 9414 |
| No. of params | 794 | 725 | 662 |
R
1all, R1obs![[thin space (1/6-em)]](https://www.rsc.org/images/entities/char_2009.gif) a a |
0.1221, 0.0826 | 0.0498, 0.0447 | 0.0904, 0.0659 |
wR2all, wR2obs![[thin space (1/6-em)]](https://www.rsc.org/images/entities/char_2009.gif) b b |
0.2527, 0.2217 | 0.1176, 0.1140 | 0.1669, 0.1513 |
| GOF | 1.035 | 1.055 | 1.040 |
| CCDC no. | 2![[thin space (1/6-em)]](https://www.rsc.org/images/entities/char_2009.gif) 330 330![[thin space (1/6-em)]](https://www.rsc.org/images/entities/char_2009.gif) 839 839 |
2![[thin space (1/6-em)]](https://www.rsc.org/images/entities/char_2009.gif) 330 330![[thin space (1/6-em)]](https://www.rsc.org/images/entities/char_2009.gif) 840 840 |
2![[thin space (1/6-em)]](https://www.rsc.org/images/entities/char_2009.gif) 330 330![[thin space (1/6-em)]](https://www.rsc.org/images/entities/char_2009.gif) 841 841 |
| Hydrogen bond | H⋯A (Å) | D⋯A (Å) | ∠D–H⋯A (°) | Symmetry code |
|---|---|---|---|---|
| GTB-DAS·2H2O | ||||
| N4–H4⋯N6 | 2.116 | 2.976 | 179.8 | −x + 2, −y + 1, −z + 1 |
| N8–H8A⋯O1 | 1.996 | 2.817 | 159.5 | −x + 2, y − 1/2, −z + 1/2 |
| O4–H4A⋯N2 | 2.119 | 2.756 | 134.8 | −x + 1, −y + 1, −z + 1 |
| O4–H4A⋯N2A | 2.235 | 2.864 | 133.8 | −x + 1, −y + 1, z + 1 |
| GTB-DAS·2MeOH | ||||
| N9–H9⋯N10 | 2.056 | 2.913 | 174.3 | −x, − + 2, −z + 1 |
| N11–H11⋯O5 | 1.985 | 2.834 | 168.8 | −x, y + 1/2, −z + 3/2 |
| N11–H11A⋯O5 | 1.990 | 2.834 | 166.8 | −x, y + 1/2, −z + 3/2 |
| N4–H4A⋯O6 | 2.174 | 2.983 | 156.6 | |
| N4–H4B⋯O6 | 2.195 | 2.983 | 152.3 | |
| O4–H4⋯N1 | 2.164 | 2.864 | 143.3 | |
| O6–H6⋯O7 | 1.868 | 2.685 | 174.6 | |
| O7–H7⋯N2 | 1.915 | 2.722 | 167.9 | −x + 1, −y + 1, −z + 1 |
| O4A–H4A⋯N1 | 2.219 | 2.954 | 149.3 | |
| GTB-DAS | ||||
| O4–H4⋯O1 | 1.961 | 2.779 | 175.0 | −x + 1, −y + 1, −z + 1 |
| N9–H9⋯N10 | 2.109 | 2.959 | 169.3 | −x + 2, −y + 2, −z + 1 |
| N4–H4A⋯O4 | 2.486 | 2.874 | 157.1 | x, −y + 3/2, z + 1/2 |
| N11–H11–O5 | 1.976 | 2.844 | 151.1 | −x + 2, y + 1/2, −z + 3/2 |
To compare molecular arrangements and noncovalent interactions, in particular, hydrogen bonding interactions before and after cocrystallization, the crystal structure of each parent crystalline drug was analysed from a crystal engineering perspective. GTB molecules of the parent GTB crystal are packed together to generate the 3D structure via van der Waals forces rather than hydrogen bonding and π–π interactions, similar to that of cocrystals (Fig. S7†).33 DAS molecules of the parent DAS crystal form similar dimers, chains, and wavy layer structures through N–H (amine)⋯N (thiazole) interactions and N–H (amide)⋯O (carbonyl) interactions, just like that of the cocrystals (Fig. S8†).34 From crystal structure analysis, we can see that main molecular interactions of each single component are retained after cocrystallization, and GTB and DAS in GTB-DAS·2H2O interact with each other via van der Waals forces and weak hydrogen bonding interactions. Hirshfeld surface analysis was carried out based on the single-crystal structures to evaluate in detail the intermolecular interactions in both qualitative and quantitative terms.35 The relative contributions of various intermolecular contacts are shown in Fig. 6. The 2D fingerprint plots of dominant intermolecular interactions are graphed in Fig. S9.† These confirm that the most prominent contributions for GTB-DAS·2H2O, GTB-DAS·2MeOH and GTB-DAS are provided by H⋯H corresponding to van der Waals forces, with percentages of 50.90%, 46.00% and 55.40%, respectively.
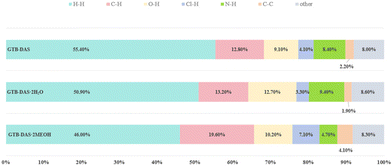 | ||
| Fig. 6 The percentage contributions to the Hirshfeld surface area of various intermolecular contacts of GTB-DAS, GTB-DAS·2H2O and GTB-DAS·2MeOH. | ||
3.5 FTIR analysis
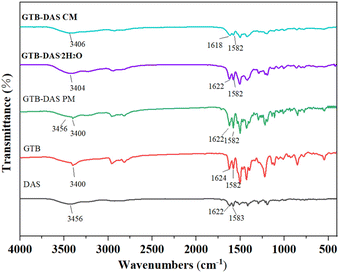
FTIR spectroscopy was carried out in order to gain additional insights into possible molecular level interactions between GTB and DAS in the cocrystalline and coamorphous forms (Fig. 7). The spectral analysis was focused on the regions of 1650–1600 cm−1 (C![[double bond, length as m-dash]](https://www.rsc.org/images/entities/char_e001.gif) O/N stretching) and 1600–1550 cm−1 (aromatic C
O/N stretching) and 1600–1550 cm−1 (aromatic C![[double bond, length as m-dash]](https://www.rsc.org/images/entities/char_e001.gif) C stretching), since significant peak shifts related to possible hydrogen bonding and π–π interactions between GTB and DAS upon cocrystallization and coamorphization could be detected there. Crystalline GTB exhibits characteristic peaks at 1624 cm−1 (C
C stretching), since significant peak shifts related to possible hydrogen bonding and π–π interactions between GTB and DAS upon cocrystallization and coamorphization could be detected there. Crystalline GTB exhibits characteristic peaks at 1624 cm−1 (C![[double bond, length as m-dash]](https://www.rsc.org/images/entities/char_e001.gif) N stretching) and 1582 cm−1 (aromatic C
N stretching) and 1582 cm−1 (aromatic C![[double bond, length as m-dash]](https://www.rsc.org/images/entities/char_e001.gif) C stretching), while crystalline DAS exhibits main bands at 1622 cm−1 (C
C stretching), while crystalline DAS exhibits main bands at 1622 cm−1 (C![[double bond, length as m-dash]](https://www.rsc.org/images/entities/char_e001.gif) O stretching) and 1583 cm−1 (aromatic C
O stretching) and 1583 cm−1 (aromatic C![[double bond, length as m-dash]](https://www.rsc.org/images/entities/char_e001.gif) C stretching). The FTIR spectrum of the physical mixture of GTB and DAS (GTB-DAS PM) contains the superimposed spectra of each component.
C stretching). The FTIR spectrum of the physical mixture of GTB and DAS (GTB-DAS PM) contains the superimposed spectra of each component.
In the FTIR spectra of GTB-DAS·2H2O, no considerable shifts of absorption bands associated with H-bonds (C![[double bond, length as m-dash]](https://www.rsc.org/images/entities/char_e001.gif) N and C
N and C![[double bond, length as m-dash]](https://www.rsc.org/images/entities/char_e001.gif) O stretching) and π–π interactions (aromatic C
O stretching) and π–π interactions (aromatic C![[double bond, length as m-dash]](https://www.rsc.org/images/entities/char_e001.gif) C stretching) were observed, confirming the absence of strong molecular interactions between GTB and DAS. This agrees well with the crystal structure and Hirshfeld surface analyses that the most prominent intermolecular interactions between GTB and DAS of cocrystals are van der Waals forces. The FTIR spectra of GTB-DAS CM appeared to be comparable with those of the cocrystals in terms of most peak positions, except that the peaks are broadened with lower intensity, indicating amorphous nature. This suggests that the molecular arrangement of GTB-DAS CM is fairly similar to that of the cocrystalline counterpart, with no significant molecular interactions between GTB and DAS. This is also consistent with the conclusion made based on the very small difference between theoretically and experimentally determined Tg values of GTB-DAS CM.
C stretching) were observed, confirming the absence of strong molecular interactions between GTB and DAS. This agrees well with the crystal structure and Hirshfeld surface analyses that the most prominent intermolecular interactions between GTB and DAS of cocrystals are van der Waals forces. The FTIR spectra of GTB-DAS CM appeared to be comparable with those of the cocrystals in terms of most peak positions, except that the peaks are broadened with lower intensity, indicating amorphous nature. This suggests that the molecular arrangement of GTB-DAS CM is fairly similar to that of the cocrystalline counterpart, with no significant molecular interactions between GTB and DAS. This is also consistent with the conclusion made based on the very small difference between theoretically and experimentally determined Tg values of GTB-DAS CM.
3.6 Dynamic vapor sorption (DVS) and stability test
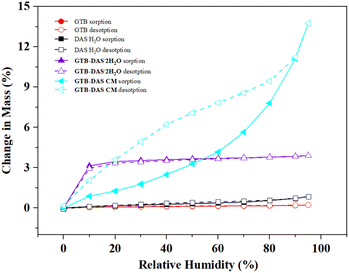
Cocrystallization and coamorphization of certain drug combinations can only be practically useful if their hygroscopicity and physical stability are confirmed. The hygroscopicity of GTB, DAS·H2O, GTB-DAS·2H2O and GTB-DAS CM were studied by DVS measurements at 25 °C (Fig. 8). Possible phase transitions associated with DVS experiments were monitored by PXRD measurements (Fig. S10†).GTB and DAS·H2O exhibit simple sorption/desorption behaviour showing 0.17% and 0.74% mass change as the humidity increased from 10% to 95%. It is worth noting that the crystalline water of DAS·H2O is so stable that it remains even under 0% RH.
During the initial drying stage, GTB-DAS·2H2O lost approximately two molecules of water (with 3.49% mass change) to form GTB-DAS under 0% RH. Then GTB-DAS absorbed moisture (with 3.31% mass change) and was converted back into GTB-DAS·2H2O as the humidity increased to 10%, and further absorbed a little more moisture on the surface as the humidity increased from 10% to 95% (with total 4.12% mass change). During the desorption process, GTB-DAS·2H2O reversably lost the water on the surface as the humidity decreased from 95% to 10%, and then it totally lost the crystalline water and converted into anhydrous GTB-DAS at 0% RH. The above results imply a humidity-induced transition between the hydrate and anhydrous form. GTB-DAS can be formed under 0% RH, while GTB-DAS·2H2O is the stable form across a wide range of 10%–95% RH. However, the PXRD analysis of the sample equilibrating under 0% RH and 95% RH both revealed the crystal phase of GTB-DAS·2H2O. This can be explained by the GTB-DAS that formed under 0% RH being converted back to GTB-DAS·2H2O when the sample was taken out for PXRD measurement. This is consistent with the fact that the bulk sample of GTB-DAS cannot be prepared by dehydration of GTB-DAS·2H2O through heating due to the rapid hydration process of GTB-DAS under ambient conditions.
In contrast, GTB-DAS CM exhibits simple sorption/desorption behaviour, showing no evidence of phase transitions (Fig. 8). It lost the adsorbed water molecules (with 2.40% mass change) during the initial drying stage. Then it moderately absorbed moisture below 60% RH (with 4.17% mass change), while it rapidly absorbed water above 60% RH and totally absorbed 13.75% of water under 95% RH. During the desorption process, GTB-DAS CM gradually lost the absorbed water with a hysteresis gap. The PXRD patterns of GTB-DAS CM under 0% RH and 95% RH confirmed that the amorphous state remains throughout the 0%–95% RH range (Fig. S10†), showing stabilization against moisture-induced crystallization of this formulation.
GTB-DAS·2H2O and GTB-DAS CM were stored under 40 °C/75% RH conditions and then PXRD measurements were conducted to evaluate their physical stability with time intervals of 1, 2, 3 and 6 months (Fig. S11†). GTB-DAS·2H2O retains its original phase over the period of storage, while GTB-DAS CM undergoes crystallization with distinctive peaks belonging to crystalline GTB and DAS in the PXRD diffractograms within 2 months. Furthermore, the stability of GTB-DAS CM was evaluated under 25 °C/60% RH conditions for 6 months. The result shows that GTB-DAS CM stays amorphous over the whole period, indicated by the appearance of a halo in the PXRD diffractogram.
3.7 Tabletability property
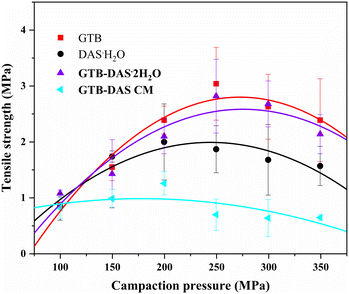
Tabletability refers to the ability of a powdered drug to be transformed into a tablet with a specific tensile strength over a certain range of compaction pressures.36 The change of solid forms can modulate the tabletability property and therefore the manufacturability of a given drug.37 In this study, the tabletability values of GTB, DAS·H2O, GTB-DAS·2H2O and GTB-DAS CM were determined under compaction pressures from 100 to 350 MPa. The tabletability profiles are shown in Fig. 9. The tablet tensile strengths of crystalline GTB, DAS·H2O and GTB-DAS·2H2O increase with the increase of compaction pressure from 100 to 250 MPa. However, a further increase in the compaction pressure results in a decline in the tensile strength, which is known as overcompaction.38 The tabletability of crystalline powders is relative to the molecular arrangements and packing modes of the crystals. As GTB-DAS·2H2O maintains main molecular packing modes of both pure GTB and DAS·H2O, the tablet tensile strength of the GTB-DAS·2H2O lies between that of the two individual crystalline components in the compaction pressure range of 100 to 350 MPa.The tablet tensile strength of GTB-DAS CM is much lower than that of GTB-DAS·2H2O under the same compaction pressures due to the long-range disordered structure of the amorphous material. GTB-DAS·2H2O and GTB-DAS CM reach the maximum tensile strengths of 2.82 and 1.26 MPa, respectively. A threshold tensile strength of 2 MPa, which ensures integrity of a pharmaceutical tablet, has been achieved by GTB-DAS·2H2O.39 The superior tabletability of GTB-DAS·2H2O may be attributed to the alternately layered structures of GTB and DAS as well as the existence of water molecules in the lattice, leading to significant plastic deformation under compaction. After experiments, the powdered samples were collected and determined by PXRD tests. The results reveal that there was no stress-induced phase transition during the compaction process (Fig. S12†).
3.8 Dissolution study
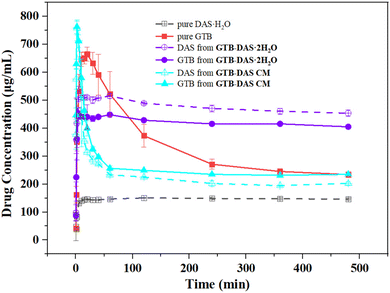
The powder dissolution experiments were carried out in Tween 80 aqueous solution (5% v/v)40,41 for GTB-DAS·2H2O and GTB-DAS CM under non-sink conditions with crystalline GTB and DAS·H2O as controls.42 The 8 h dissolution profiles are shown in Fig. 10. The time to attain the maximum concentration (Tmax), the maximum concentration (Cmax), and the area under the curve (AUC) of GTB and DAS obtained from the concentration–time profiles are summarized in Table 3. After the dissolution experiments, the undissolved solids were isolated by filtration and identified by PXRD tests (Fig. S13†). Crystalline GTB reached the Cmax value (664.64 ± 0.24 μg mL−1) within the first 20 min of the dissolution experiment, followed by gradual decline due to recrystallization of the more stable but less soluble hydrated form of GTB (identified as GTB·3H2O as shown by PXRD). The dissolution profile of crystalline DAS·H2O shows that the parent drug dissolved slowly, reaching a concentration plateau with the Cmax value of 150.70 ± 0.17 μg mL−1. There is a 4.4-times solubility difference between pure GTB and DAS·H2O, suggesting potential compatibility issues between the two drugs.| Sample | t max, GTB (min) | C max, GTB (μg mL−1) | AUC0-8h, GTB (μg min mL−1) | t max, DAS (min) | C max, DAS (μg mL−1) | AUC0-8h, DAS (μg min mL−1) |
|---|---|---|---|---|---|---|
| GTB | 20 | 664.64 ± 0.24 | (160.16 ± 12.2) × 103 | — | — | — |
| DAS·H2O | — | — | — | 120 | 150.70 ± 0.17 | (70.65 ± 0.12) × 103 |
| GTB-DAS·2H2O | 20 | 440.52 ± 0.51 | (201.89 ± 0.14) × 103 | 5 | 509.46 ± 0.12 | (228.65 ± 1.02) × 103 |
| GTB-DAS CM | 2 | 762.31 ± 0.24 | (148.29 ± 1.54) × 103 | 2 | 758.33 ± 0.22 | (118.10 ± 1.85) × 103 |
GTB-DAS·2H2O exhibits synchronized release of the two drugs with improved dissolution performance. The dissolution behaviour of GTB and DAS can be described as the “spring and hover” model.43 Both GTB and DAS dissolved much faster and generated supersaturation almost instantly (within 5 min), with the Cmax values of 440.52 ± 0.51 μg mL−1 and 509.46 ± 0.12 μg mL−1, respectively. After reaching Cmax, the GTB and DAS concentration slightly dropped within 8 h. Although GTB-DAS·2H2O yielded a lower Cmax value of GTB as compared to free GTB, the dissolution of GTB and DAS was effectively improved by contributing to a prolonged supersaturation. The PXRD pattern of the undissolved residue from the dissolution experiment revealed characteristic peaks of GTB-DAS·2H2O, which is consistent with the “hover” effect of drug concentrations. Synchronized drug release can be attributed to the superior physical stability of the cocrystal during dissolution and is a desired attribute in the oral administration of combinational therapy.
GTB-DAS CM also shows similar dissolution profiles for GTB and DAS, releasing both drugs in a synchronized manner. It exhibits the shortest Tmax and the highest Cmax for GTB (2 min, 762.31 ± 0.24 μg mL−1) and DAS (2 min, 758.33 ± 0.22 μg mL−1), yielding the “spring up” effect. The Cmax values of GTB and DAS released from the coamorphous form were found to increase by a factor of 1.1 and 5.0 compared to crystalline GTB and DAS·H2O. The improvement of the dissolution of GTB-DAS CM can be attributed to a high Gibbs free energy of the coamorphous state since less energy is required to dissolve molecules from a disordered solid compared with a crystalline material. However, the elevated GTB and DAS concentrations of GTB-DAS CM were not sustained and decreased rapidly over time as it is thermodynamically unstable and tends to crystallize into thermodynamically stable forms during dissolution, resulting in the “spring down” stage. This is in line with the PXRD analysis of the undissolved solids collected after the dissolution experiment, which revealed characteristic peaks of crystalline GTB·3H2O and DAS·H2O.
The dissolution performance was also evaluated in terms of AUC values of the dissolution curves (Table 3). Compared to the AUC values of GTB ((160.16 ± 12.23) × 103 μg min mL−1) and DAS ((70.65 ± 0.12) × 103 μg min mL−1) free drugs, those values of GTB-DAS·2H2O were increased by 1.3 and 3.2-fold, respectively. In contrast, GTB-DAS CM exhibits much lower AUC values of GTB and DAS than cocrystalline forms, though the Cmax values appeared to be even higher than those of the cocrystal. The observed variation in the AUC values of the cocrystalline and coamorphous forms can be attributed to the differences in the recrystallization rates of the materials during dissolution. Thus, the cocrystal exhibits significant dissolution advantage over the coamorphous form due to its stronger physical stability and longer-lasting supersaturation as revealed in this work.
4. Conclusions
Herein, both cocrystallization and coamorphization techniques were applied to two poorly soluble drugs with synergistic antitumor activity, i.e. GTB and DAS, with the intention to optimize the performance of hybrid drugs for the exertion of their synergistic effect. One cocrystal hydrate GTB-DAS·2H2O (1![[thin space (1/6-em)]](https://www.rsc.org/images/entities/char_2009.gif) :
:![[thin space (1/6-em)]](https://www.rsc.org/images/entities/char_2009.gif) 1
1![[thin space (1/6-em)]](https://www.rsc.org/images/entities/char_2009.gif) :
:![[thin space (1/6-em)]](https://www.rsc.org/images/entities/char_2009.gif) 2) was prepared by both liquid-assisted grinding and solvent-based methods (i.e. evaporation crystallization and slurry) while one coamorphous form GTB-DAS CM (1
2) was prepared by both liquid-assisted grinding and solvent-based methods (i.e. evaporation crystallization and slurry) while one coamorphous form GTB-DAS CM (1![[thin space (1/6-em)]](https://www.rsc.org/images/entities/char_2009.gif) :
:![[thin space (1/6-em)]](https://www.rsc.org/images/entities/char_2009.gif) 1) was obtained by the neat milling technique. Although anhydrous GTB-DAS can be formed by removal of the crystalline water of GTB-DAS·2H2O by heating to 120 °C or drying under 0% RH, it quickly converts back into the cocrystal hydrate under ambient conditions. Therefore, the bulk sample of GTB-DAS cannot be obtained due to its extreme instability. The obtained bulk samples of GTB-DAS·2H2O and GTB-DAS CM were fully characterized by XRD, 1H NMR, thermal analysis, FTIR and DVS measurements. Crystal structural and Hirshfeld surface analyses demonstrate that main molecular packing and interactions of individual crystalline components were retained in GTB-DAS·2H2O, and that the GTB and DAS in cocrystals mainly interact with each other via van der Waals forces. The amorphization of GTB-DAS CM was confirmed by a halo pattern in PXRD measurements and a single glass transition event in the DSC and MDSC curves. The stability, tabletability and dissolution performances of GTB-DAS·2H2O and GTB-DAS CM were then systematically evaluated. Overall, GTB-DAS·2H2O shows superior stability and tabletability performance, and synchronized drug release with improved dissolution behaviour, making it a more promising and reliable solid form for the development of combinational therapy.
1) was obtained by the neat milling technique. Although anhydrous GTB-DAS can be formed by removal of the crystalline water of GTB-DAS·2H2O by heating to 120 °C or drying under 0% RH, it quickly converts back into the cocrystal hydrate under ambient conditions. Therefore, the bulk sample of GTB-DAS cannot be obtained due to its extreme instability. The obtained bulk samples of GTB-DAS·2H2O and GTB-DAS CM were fully characterized by XRD, 1H NMR, thermal analysis, FTIR and DVS measurements. Crystal structural and Hirshfeld surface analyses demonstrate that main molecular packing and interactions of individual crystalline components were retained in GTB-DAS·2H2O, and that the GTB and DAS in cocrystals mainly interact with each other via van der Waals forces. The amorphization of GTB-DAS CM was confirmed by a halo pattern in PXRD measurements and a single glass transition event in the DSC and MDSC curves. The stability, tabletability and dissolution performances of GTB-DAS·2H2O and GTB-DAS CM were then systematically evaluated. Overall, GTB-DAS·2H2O shows superior stability and tabletability performance, and synchronized drug release with improved dissolution behaviour, making it a more promising and reliable solid form for the development of combinational therapy.
Author contributions
Xian-Bi Shi: conceptualization, data curation, methodology, validation, investigation, visualization, and writing – original draft; Zhi-Qing Wang: data curation and visualization; Hui-Tian Li: data curation and visualization; Xia-Lin Dai: computational studies; Yong-Liang Huang: refinement of single-crystal structures; Xiang-Tian Long: conceptualization, resources, and writing – review and editing; Jia-Mei Chen: conceptualization, project administration, funding acquisition, resources, and writing – review and editing; Tong-Bu Lu: conceptualization and resources.Data availability
Crystallographic data have been deposited at the CCDC under 2330839–2330841.† For the ESI† and crystallographic data see https://doi.org/10.1039/D4PM00237G.Conflicts of interest
There are no conflicts to declare.Acknowledgements
This work was financially supported by the National Natural Science Foundation of China (No. 22271220) and the Graduate Education and Teaching Research and Reform Project of Tianjin University of Technology (No. YBXM2321).References
- J. Lehár, A. S. Krueger, W. Avery, A. M. Heilbut, L. M. Johansen, E. R. Price, R. J. Rickles, G. F. Short, J. E. Staunton, X. W. Jin, M. S. Lee, G. R. Zimmermann and A. A. Borisy, Nat. Biotechnol., 2009, 27, 659–666 CrossRef PubMed.
- P. Das, M. D. Delost, M. H. Qureshi, D. T. Smith and J. T. Njardarson, J. Med. Chem., 2019, 62, 4265–4311 CrossRef CAS PubMed.
- C. Melikian, T. J. White, A. Vanderplas, C. M. Dezii and E. Chang, Clin. Ther., 2002, 24, 460–467 CrossRef PubMed.
- K. Jazieh, J. Molina, J. Allred, J. Yin, J. Reid, M. Goetz, V. S. Lim, S. H. Kaufmann and A. Adjei, Invest. New Drugs, 2019, 37, 307–314 CrossRef CAS PubMed.
- C. Borghi and A. F. G. Cicero, Clin. Drug Invest., 2010, 30, 843–854 CrossRef CAS PubMed.
- D. Desai, J. Wang, H. Wen, X. Li and P. Timmins, Pharm. Dev. Technol., 2013, 18, 1265–1276 CrossRef CAS PubMed.
- F. Simon, Nat. Rev. Drug Discovery, 2006, 5, 881–882 CrossRef CAS PubMed.
- B. P. Bezerra, D. Pogoda, M. L. Perry, L. Vidal, M. J. Zaworotko and A. P. Ayala, Cryst. Growth Des., 2020, 20, 4707–4718 CrossRef CAS.
- K. V. Drozd, A. N. Manin, A. V. Churakov and G. L. Perlovich, CrystEngComm, 2017, 19, 4273–4286 RSC.
- X. Li, X. Liu, J. Song, C. Wang, J. Li, L. Liu, X. He, X. Zhao and C. C. Sun, Cryst. Growth Des., 2021, 21, 3461–3468 CrossRef CAS.
- F. Y. Zhou, J. L. Zhou, H. L. Zhang, H. H. Y. Tong, J. J. Nie, L. Li, Y. Y. Zhang, J. Du, A. D. Ma, X. M. Yang and Z. Z. Zhou, J. Drug Delivery Sci. Technol., 2019, 54, 101244 CrossRef CAS.
- M. Banerjee, K. Nimkar, S. Naik and V. Patravale, J. Controlled Release, 2022, 348, 456–469 CrossRef CAS PubMed.
- W. X. Wang, F. Liu, J. Y. Li, J. Xue, Y. T. Li and R. M. Liu, J. Mol. Struct., 2021, 1243, 130729 CrossRef CAS.
- P. M. Nielsen, D. Grimm, M. Wehland, U. Simonsen and M. Krüger, Basic Clin. Physiol. Pharmacol., 2018, 122, 9–18 CrossRef CAS PubMed.
- H. Fael and A. L. Demirel, Int. J. Pharm., 2021, 600, 120448 CrossRef CAS PubMed.
- Y. Shen, M. Aucamp, H. E. Abdelhakim, X. Li, Y. Ghazali and K. Edkins, RSC Pharm., 2024, 1, 132–140 RSC.
- M. Skotnicki, B. Jadach, A. Skotnicka, B. Milanowski, L. Tajber, M. Pyda and J. Kujawski, Pharmaceutics, 2021, 13, 118 CrossRef CAS.
- S. K. Wilke, C. J. Benmore, V. Menon, D. Smith, S. R. Byrn and R. Weber, RSC Pharm., 2024, 1, 121–131 RSC.
- P. Agarwal, D. Svirskis and M. K. Nieuwoudt, RSC Pharm., 2024, 1, 296–304 RSC.
- S. Saeki, J. Sasaki, J. Morioka, R. Sato, S. Sakata, H. Ichiyasu, K. Fujii, N. Saita and H. Kohrogi, J. Clin. Oncol., 2012, 30, e18059 Search PubMed.
- S. Nanjo, S. Arai, W. Wang, S. Takeuchi, T. Yamada, A. Hata, N. Katakami, Y. Okada and S. Yano, Mol. Cancer Ther., 2017, 16, 506–515 CrossRef CAS PubMed.
- C. Zhang, X. Zhao, Z. Wang, T. Gong, H. Zhao, D. Zhang, Y. Niu, X. Li, X. Zhao, G. Li, X. Dong, L. Zhang, C. Liu, J. Xu and B. Yu, Invest. New Drugs, 2023, 41, 438–452 CrossRef CAS PubMed.
- Z. Wang, L. Li, Z. Shao, H. Xie, F. Yang and N. Zhou, Chin. J. Cell. Mol. Immunol., 2016, 32, 595–599 Search PubMed.
- B. Thibault and B. Jean-Claude, J. Ovarian Res., 2017, 10, 1–12 CrossRef PubMed.
- D. Nagdiya, M. Kumar, S. Arora, T. Bajaj, S. Kujur, P. Rana, A. Kumar, A. Singh and C. Singh, OpenNano, 2023, 14, 100183 Search PubMed.
- A. Shaik, P. U. Bhagwat, P. Palanisamy, D. Chhabria, P. Dubey, S. Kirubakaran and V. Thiruvenkatam, CrystEngComm, 2023, 25, 2570–2581 RSC.
- G. Sodeifian, R. S. Alwi, F. Razmimanesh and M. Abadian, J. Mol. Liq., 2022, 346, 117899 CrossRef CAS.
- R. Shelke, V. Velagacherla and U. Y. Nayak, Drug Discovery Today: Technol., 2024, 29, 103863 CrossRef CAS PubMed.
- M. Z. Chen, L. Wang, L. H. Zhang, W. F. Li and Y. C. Ding, Chin. J. Magn. Reson., 2017, 28, 413–418 Search PubMed.
- P. W. Manley, S. W. Cowan-Jacob, G. Fendrich, A. Strauss, N. Vapai, S. Grzesiek and W. Jahnke, Blood, 2006, 108, 747 CrossRef.
- S. Saboo, U. S. Kestur, D. P. Flaherty and L. S. Taylor, Mol. Pharmaceutics, 2020, 17, 1261–1275 CrossRef CAS PubMed.
- S. Baghel, H. Cathcart and N. J. O'Reilly, J. Pharm. Sci., 2016, 105, 2527–2544 CrossRef CAS PubMed.
- S. H. Thorat, M. V. Patwadkar, R. G. Gonnade and R. Vaidhyanathan, CrystEngComm, 2014, 16, 8638–8641 RSC.
- S. Roy, R. Quiñones and A. J. Matzger, Cryst. Growth Des., 2012, 12, 2122–2126 CrossRef CAS PubMed.
- D. L. Zynger, M. J. Everton, N. D. Dimov, P. M. Chou and X. J. Yang, Am. J. Clin. Pathol., 2008, 130, 224–230 CrossRef PubMed.
- C. K. Tye, C. C. Sun and G. E. Amidon, J. Pharm. Sci., 2005, 94, 465–472 CrossRef CAS PubMed.
- S. Chattoraj, L. Shi and C. C. Sun, CrystEngComm, 2010, 12, 2466–2472 RSC.
- C. C. Sun, J. Adhes. Sci. Technol., 2011, 25, 483–499 CrossRef CAS.
- S. R. Perumalla, L. Shi and C. C. Sun, CrystEngComm, 2012, 14, 2389–2390 RSC.
- N. Xu, J. Baotou Med. Coll., 2018, 34, 117–121 Search PubMed.
- B. Y. Ren, X. L. Dai, F. Zhang, T. X. Long, Y. L. Huang, J. M. Chen and T. B. Lu, Cryst. Growth Des., 2022, 22, 5785–5790 CrossRef CAS.
- K. Etherson, C. Dunn, W. Matthews, H. Pamelund, C. Barragat, N. Sanderson, T. Izumi, C. D. C. Mathews, G. Halbert, C. Wilson, M. McAllister, J. Mann, J. Østergaard, J. Butler and I. Khadra, Eur. J. Pharm. Biopharm., 2020, 150, 24–32 CrossRef CAS PubMed.
- Y. Wei, L. Zhang, N. Wang, P. Shen, H. Dou, K. Ma, Y. Gao, J. Zhang and S. J. Qian, Cryst. Growth Des., 2018, 18, 7343–7355 CrossRef CAS.
Footnote |
| † Electronic supplementary information (ESI) available. CCDC 2330839–2330841. For ESI and crystallographic data in CIF or other electronic format see DOI: https://doi.org/10.1039/d4pm00237g |
| This journal is © The Royal Society of Chemistry 2025 |


