 Open Access Article
An integrated theoretical study on natural alkaloids as SARS-CoV-2 main protease inhibitors: a step toward discovery of potential drug candidates with anti-COVID-19 activity†
Shagufta Parveena,
Laiba Shahbaza,
Nusrat Shafiq *a,
Maryam Rashida,
Mohamed Mohanyb and
Mingkun Zhucd
aSynthetic and Natural Products Discovery (SNPD) Laboratory, Department of Chemistry, Government College Women University, Faisalabad-38000, Pakistan. E-mail: dr.nusratshafiq@gcwuf.edu.pk; gqumarin@gmail.com
bDepartment of Pharmacology and Toxicology, College of Pharmacy, King Saud University, P.O. Box 55760, Riyadh 11451, Saudi Arabia. E-mail: mmohany@ksu.edu.sa
cJiangsu Key Laboratory of Sericultural Biology and Animal Biotechnology, School of Biotechnology, Jiangsu University of Science and Technology, Zhenjiang 212100, China. E-mail: mkzhu085@just.edu.cn
dKey Laboratory of Silkworm and Mulberry Genetic Improvement, Ministry of Agriculture and Rural Affairs, The Sericultural Research Institute, Chinese Academy of Agricultural Sciences, Zhenjiang 212100, China
First published on 22nd January 2025
Abstract
Background: in the twenty-first century, the emergence of COVID-19 as a highly transmissible pandemic disease caused by SARS-CoV-2 posed a significant threat to humanity. Aims & Objectives: the disease spreads through small respiratory droplets, necessitating the use of various compounds for treatment, with alkaloids being recognized as particularly crucial owing to their diverse pharmaceutical properties. Methodology: in this study, a dataset comprising 100 natural alkaloids obtained from the literature was transformed into 2D chemical structures using Chem Draw 19.1. Subsequently, 3DQSAR studies were conducted on the dataset, resulting in the automatic screening of 50 compounds from the initial pool of 100 compounds. The values of q2 and r2 of the validated field-based 3DQSAR model were 0.7186 and 0.971, respectively. The validated atom-based 3DQSAR model has q2 and r2 scores of 0.6025 and 0.9845, respectively. Based on the obtained results, 10 compounds with exceptionally active predictive IC50 values were selected for further analysis. Docking experiments were then performed on the selected compounds, and the top three compounds with the highest docking scores were identified as diazepinomicin, (+)-N-methylisococlaurine, and hymenocardine-H. After docking, MM–GBSA was performed on the complexes of diazepinomicin, (+)-N-methylisococlaurine and hymenocardine-H with their corresponding proteins, which resulted in the authentication of the molecular docking scores. MD simulations were also performed to check the flexibility, stability and compactness of these complexes for revalidation of docking scores. Results: finally, ADMET experiments revealed that (+)-N-methylisococlaurine exhibited the most favourable properties among these three compounds.
1. Introduction
Virus-related infections have been identified as a single leading cause of death worldwide, particularly during large epidemics in the past fifty years.1 Novel infectious organisms like H1N1 (subtype of the influenza A virus)2 and MERS were responsible for some of these epidemics.3 Public health systems have faced significant problems due to the rise of coronavirus-associated infections over the past twenty years, together with SARS (Severe Acute Respiratory Syndrome) and MERS (Middle East Respiratory Syndrome).4After SARS in 2002–2003 and 2012, the SARS-CoV-2 (severe acute respiratory syndrome coronavirus 2) poses a significant challenge to humanity in the twenty-first century.1
In comparison to influenza, COVID-19, a novel severe acute respiratory disease, has a high mortality rate.5 COVID-19 is regarded as the second-most widespread global pandemic, behind the 1918 H1N1 influenza outbreak.6
The COVID-19 pandemic was caused by coronavirus 2, which causes severe acute respiratory syndrome.7–9 According to the World Health Organization (WHO), the 2019 coronavirus disease (COVID-19) was first reported in March 2020 after it had killed over 16![[thin space (1/6-em)]](https://www.rsc.org/images/entities/char_2009.gif) 000 individuals and infected nearly 4 million people globally across 195 different nations.10,11
000 individuals and infected nearly 4 million people globally across 195 different nations.10,11
The number of confirmed COVID-19 cases as of May 23, 2021, was 166![[thin space (1/6-em)]](https://www.rsc.org/images/entities/char_2009.gif) 723
723![[thin space (1/6-em)]](https://www.rsc.org/images/entities/char_2009.gif) 247, with a death toll of 3
247, with a death toll of 3![[thin space (1/6-em)]](https://www.rsc.org/images/entities/char_2009.gif) 454
454![[thin space (1/6-em)]](https://www.rsc.org/images/entities/char_2009.gif) 602.12 COVID-19 is a very contagious illness, with the most common symptoms including dry cough, pyrexia, exhaustion, digestive issues, breathing difficulties, headaches, and muscle discomfort.13,14 In some situations, severity of the infection leads to death as a result of ARDS (acute respiratory distress syndrome).15
602.12 COVID-19 is a very contagious illness, with the most common symptoms including dry cough, pyrexia, exhaustion, digestive issues, breathing difficulties, headaches, and muscle discomfort.13,14 In some situations, severity of the infection leads to death as a result of ARDS (acute respiratory distress syndrome).15
It is believed that direct human contact and respiratory droplets are the major aspects by which the COVID-19 virus spreads.16,17 There is a very high infection rate with COVID-19 and also a very high transmission potential.18 In order to infect human cells, the severe acute respiratory syndrome coronavirus type 2 interacts with type 2 angiotensin-converting enzyme (ACE-2).19
SARS-COV-2 is a polypeptide, which cleaves by altered proteases, specifically chymotrypsin- and papain-like proteases, resulting in the formation of certain non-structural proteins (nsps) that remain crucial for the reproduction of viruses.20
Initially, vaccination was not available for this disease. General medicines were used, including herbal treatment.21 However, after some months, vaccination was launched.
Bestowing to the “World Health Organization” Trusted Source, 13 different COVID-19 vaccines are currently in use around the world, including the Pfizer-BioNTech vaccine and the AstraZeneca vaccine — many countries across the world have authorized or approved one or both of these vaccines for use.22
It has been observed that after being vaccinated against COVID-19, most of the vaccinated persons became victims of this virus again. This encourages us to find proper medicines to tackle the disease.23
For this purpose, drug repositioning is an innovative approach that gives already-approved medications and natural compounds new life and turns them into potent remedies for unsolved and developing medical problems. It significantly cuts development timeframes, lowers expenses, and expedites the delivery of life-saving medicines by utilizing medications with established safety profiles. Combating global health emergencies, including finding remedies during the COVID-19 epidemic, has benefited greatly from this creative approach. Besides being efficient, it represents the prospects of precision health care, giving patients new hope and a more intelligent way to find new drugs.24
On the basis of this approach, alkaloids, which have a variety of antiviral properties, are the most antiviral plant phytochemicals.24 A large group of chemical compounds known as alkaloids are found in nature and have one or more nitrogen atoms (sometimes in the form of amino or amido atoms) in their structures.25 Over ten thousand alkaloids have been extracted from bacteria, fungi, plants and marine organisms.26
Natural compounds known as alkaloids are extremely important to humanity because they exhibit a wide range of antiviral activity at relatively low doses, making them an important source of pharmaceutical medications.27
The “single-stranded positive sense RNA” genome of SARS-CoV-2 shares one hundred percent to seventy-four percent of its sequence alongside that of SARS-CoV. Alkaloids have been found to prevent the entry and reproduction of several coronaviruses, including SARS and MERS.24
The genomes of SARS-CoV and SARS-CoV-2 are nearly identical with the genome of SARS-CoV-2.1 Considering that SARS and SARS-CoV-2 share genetic similarities, alkaloids can also be used to treat pandemic illnesses linked to SARS-CoV-2.28
2. Materials and method
2.1. Dataset preparation
In the development of a dataset of 100 anti-parasitic natural alkaloids (Table S-1: ESI material†), FDA-approved alkaloids were collected from previous literature comprising research papers and reports. Additionally, a diverse range of chemical compounds were employed to synthesize different natural alkaloids. Compounds collected from the literature were converted into 2D chemical structures using ChemDraw 19.1. The biological potential of these compounds, initially expressed as IC50 values, was converted into positive logarithm values using the formula pIC50 = −log (IC50). Subsequently, the Excel file containing the data was converted into the CSV format to fulfill the requirements of the Maestro 5.2 element.2.2. 3DQSAR
The three-dimensional QSAR (3D-QSAR) algorithms were employed for quantitatively predicting the activity of compounds that aligned in three dimensions; consequently, 3D-QSAR models provide information about the precise molecular characteristics necessary for biological activity or inactivity and have been an important anticipatory tool in the process of discovering drugs29We created two types of 3D-QSAR models: atom-based and field-based. Because the atom-based 3D-QSAR is responsible for observing the distinct atoms and their properties in a molecule, such as size, charge or type, and it also gives an extensive understanding of how small amendments in the molecular structure, for instance, switching one atom for another causes impact on the activity of the switching atom molecule. In comparison, the field-based 3D-QSAR clarifies how the entire molecule interacts with its surroundings, taking into account factors like size and electric charges. It is advantageous when the activity of the molecule depends upon its interaction with the target receptor or protein. Therefore, both are necessary to completely comprehend how the molecule functions.
![[thin space (1/6-em)]](https://www.rsc.org/images/entities/char_2009.gif) :
:![[thin space (1/6-em)]](https://www.rsc.org/images/entities/char_2009.gif) 20 ratio. A PLS factor-9 was employed. The test set consisted of 20 compounds from the data set, while the training set was formed by randomly selecting 80 compounds from the data set, considering their structural properties and biological activities. The training set was used to develop the 3D-QSAR model, while the test set was used to verify model quality. The 3D structures of ligands were generated using the builder panel in Maestro, and then they were subsequently optimized using the LigPrep module. The energy minimization was carried out using OPLS4.30
20 ratio. A PLS factor-9 was employed. The test set consisted of 20 compounds from the data set, while the training set was formed by randomly selecting 80 compounds from the data set, considering their structural properties and biological activities. The training set was used to develop the 3D-QSAR model, while the test set was used to verify model quality. The 3D structures of ligands were generated using the builder panel in Maestro, and then they were subsequently optimized using the LigPrep module. The energy minimization was carried out using OPLS4.30The QSAR model considered for the experiments requires certain statistical parameters to be met: the regression coefficient of R2 should be in a standard range of 0.6–0.9, standard deviation should have the smallest possible value to zero and F and P methods should have the largest value possible. A regression model is statistically significant with the RMSE and Pearson-P values close to 1. A cross-validation correlation coefficient q2 with a score close to 1 is used to validate the model.
In the research study, ligands were assigned as inactive if their predicted IC50 values were greater than 5.9, active if their values were less than 5.6, and moderately active if they did not meet these breakpoints.
As described earlier, 3D structures of the ligands were generated using the builder panel in Maestro and continuously optimized using the LigPrep module. PLS analysis was used to create the atom-based 3D-QSAR model. The training and test set were selected randomly to maintain a ratio of 80![[thin space (1/6-em)]](https://www.rsc.org/images/entities/char_2009.gif) :
:![[thin space (1/6-em)]](https://www.rsc.org/images/entities/char_2009.gif) 20, with 80 molecules employed as the training set and the remaining 20 molecules as the test set with the PLS factor 9. The PLS approach provides accurate statistical results and predictions for the given data set. The model was selected on the basis of the standard criteria of standard deviation, Q2, R2 and RMSE, mentioned above in the field-based model and method. Compounds having predictive IC50 scores less than 4.8 were designated as active, compounds with predictive IC50 scores greater than 5.6 were labelled inactive and the remainder of the compounds, which did not reach these breakpoints, were categorized as moderately active.31
20, with 80 molecules employed as the training set and the remaining 20 molecules as the test set with the PLS factor 9. The PLS approach provides accurate statistical results and predictions for the given data set. The model was selected on the basis of the standard criteria of standard deviation, Q2, R2 and RMSE, mentioned above in the field-based model and method. Compounds having predictive IC50 scores less than 4.8 were designated as active, compounds with predictive IC50 scores greater than 5.6 were labelled inactive and the remainder of the compounds, which did not reach these breakpoints, were categorized as moderately active.31
2.3. Molecular docking
| PDB ID | Images | Macromolecule | Resolution | Chain | Mutation | Organism | Ligand | Reference |
|---|---|---|---|---|---|---|---|---|
| 6UX9 |  |
Crystal structure analysis of PIP4K2A | 1.71 Å | A, B | No | Homo sapiens | UHJ | https://www.rcsb.org/structure/6UX9 |
| 6VF1 |  |
DNA polymerase Mu, 8-oxorGTP: at product state ternary complex, 50 mM Mg2+ (120 min) | 1.68 Å | A | No | Homo sapiens | EPE | https://www.rcsb.org/structure/6VF1 |
| DTT | ||||||||
| GOA | ||||||||
| EDO | ||||||||
| CL | ||||||||
| MG | ||||||||
| MG | ||||||||
| 6W81 |  |
Structure of PEDV main protease bound to potent broad-spectrum non-covalent inhibitor X77 | 1.55 Å | A, B | No | Homo sapiens | X77 | https://www.rcsb.org/structure/6W81 |
| MLA | ||||||||
| 7JWD | 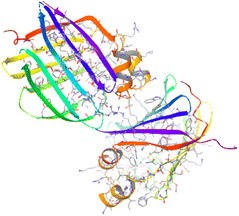 |
Cellular retinol-binding protein 2 (CRBP2) in complex with 2-linoleoylglycerol | 1.35 Å | A, B | No | Homo sapiens | VL7 | https://www.rcsb.org/structure/7JWD |
| 7JZ5 | 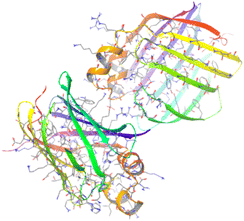 |
Cellular retinol-binding protein 2 (CRBP2) in complex with 1-arachodonoyl-1-thio-glycerol | 1.57 Å | A, B | No | Homo sapiens | VPY | https://www.rcsb.org/structure/7JZ5 |
| 7JVY | 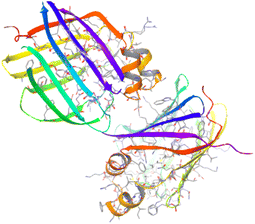 |
Cellular retinol-binding protein 2 (CRBP2) in complex with 2-arachidonylglyceryl ether | 1.30 Å | A, B | No | Homo sapiens | VKV | https://www.rcsb.org/structure/7JVY |
| 7JWR | 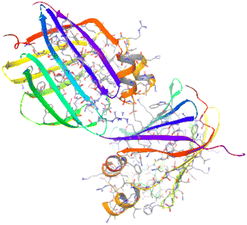 |
Cellular retinol-binding protein 2 (CRBP2) in complex with 2-oleoylglycerol | 1.30 Å | A, B | No | Homo sapiens | YOG | https://www.rcsb.org/structure/7JWR |
| 7JX2 | 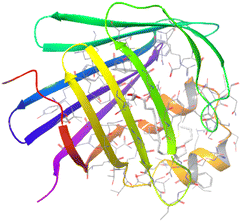 |
Cellular retinol-binding protein 2 (CRBP2) in complex with 2-palmitoylglycerol | 1.80 Å | A | No | Homo sapiens | VLP | https://www.rcsb.org/structure/7JX2 |
| 6W8H | 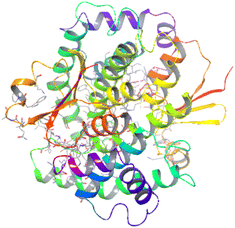 |
H-PGDS complexed with inhibitor 1Y | 1.97 Å | A, B | No | Homo sapiens | TJG | https://www.rcsb.org/structure/6W8H |
| GSH | ||||||||
| EDO | ||||||||
| 6YNE | 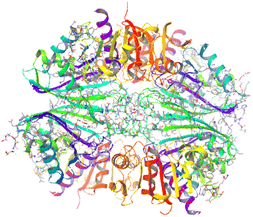 |
GAPDH purified from the supernatant of HEK293F cells: crystal form 2 of 4 | 1.85 Å | A, B, C, D | No | Homo sapiens | XPE | https://www.rcsb.org/structure/6YNE |
| 6SFR |  |
SOS1 in complex with inhibitor BI-68BS | 1.92 Å | A, B | No | Homo sapiens | LBK | https://www.rcsb.org/structure/6SFR |
| IMD | ||||||||
| 7AVT | 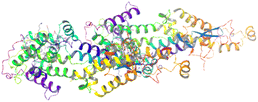 |
Crystal structure of SOS1 in complex with compound 7 | 1.88 Å | A, B | No | Homo sapiens | S3T | https://www.rcsb.org/structure/7AVT |
| IMD |
The protein structure validation was carried out utilizing the PROCHECK Ramachandran plot. During the structure validation process, the selected proteins were uploaded sequentially onto the online server (https://saves.mbi.ucla.edu/) to obtain the Ramachandran plot and Ramachandran plot statistics. The utilization of the Ramachandran plot assessed the quality of the protein, while the Ramachandran plot statistics furnished information on the total number of amino acids discovered in the favourable, allowed, and disallowed regions. Furthermore, it was employed to determine the compatibility of a 3D structure protein with its corresponding amino acids and to compare the results with those of well-known, high-quality structures.32
The receptor underwent pre-processing steps that involved removing waters beyond hets, assigning bond orders, adding hydrogens, and creating disulphide bonds. Selenomethionines were converted to methionines. Missing loops and chains were added, followed by the execution of Epik at pH 7.4 ± 2.0. Finally, unnecessary ligands and chains were removed. Additionally, the structure of the receptor underwent further optimization. Following the optimization process, the minimization of the structure was achieved by applying the OPLS4 force field and setting the maximum RMSD of the heavy atoms to 0.30 Å.30,33
2.3.3.1 Grid generation. The Glide module of Schrodinger software was utilized to generate the receptor grids. These grids were specifically designed for the prepared proteins, ensuring that different ligand poses were positioned within the predicted active site during the docking process. The grids were formulated by employing the OPLS4 force field, utilizing the standard settings of a van der Waals scaling factor of 1.00 and a charge cut-off of 0.25. For the receptor, a cubic box with specific dimensions was generated, centred on the centroid of the active site residues. To facilitate the docking calculations, the periodic box was established at 10 Å × 10 Å × 10 Å.34
2.3.3.2 Ligand preparation. The ligands with their reference drug were prepared using the LigPrep module of the Schrodinger suite in 2022. LigPrep enabled the conversion of the ligand's two-dimensional structure into a three-dimensional representation. It also facilitated the generation of stereoisomers while retaining the specified chirality. Additionally, LigPrep neutralized charged structures, performed desalting, and generated energy-minimized bioactive conformers using the OPLS-4 force field. In order to improve reliability in biological conditions, high-energy ionization and tautomeric states were eliminated. A single low-energy ring conformation was generated for each ligand, and these optimized ligands were utilized for docking analysis.35
2.3.3.3 Glide Docking. In this study, the Glide docking tool of Maestro 13.4 was utilized for docking. The prepared ligands, along with their reference drug, were docked to the prepared protein. The binding poses were evaluated on the basis of the glide score.36
2.4. Re-docking
In order to verify docking techniques by examining their capacity to replicate experimental ligand binding postures, a re-docking analysis was performed. For this purpose, co-crystallized structures of protein receptors (Table 1) were prepared by eliminating water molecules and refining geometry and their respective ligands (Table 5) were taken out of co-crystal configurations by means of MDV (molecular virtual docker). Lastly, re-docking was carried out with the MVD parameters set to default.2.5. MM–GBSA
For the purpose of determining the free binding energies of the protein–ligand complexes, the MM–GBSA (Molecular Mechanics, the Generalised Born model, and Solvent Accessibility) study was used. The best binding energies of the chosen complexes of the chosen proteins and ligands were determined using the Schrodinger software's Prime module. The complexes featuring the high binding affinity were selected.37 The difference was determined utilising the binding free energy of ligands (L) to proteins (P), which together form a complex (PL).| ΔG binding = ΔG (complex) − ΔG (protein) − ΔG (ligand) |
2.6. MD stimulation
After docking experiments, MD stimulation was performed to verify the poses discovered by docking. Two types of MD stimulation were performed, named basic and morphing, using the online server IMODS (https://imods.iqfr.csic.es/). The basic one was performed for the top 3 compounds, diazepinomicin, hymenocardine-H and (+)-N-methylisococlaurine, with their respective proteins 7JWR, 6W81 and 6VF1, 6UX9, 7JX2, respectively. In morphing, comparative MD stimulation was performed either on the native protein–ligand complexes expressed as initial or model with protein–ligand complexes expressed as target and results indicated that the docking results are reliable. The degree of stability within the protein–ligand complex was evaluated using MD simulations. The analysis of any structural alterations brought on by the ligand's interaction with the protein is made possible by this computational technique. The examination of the general stability, as well as dynamic movements associated with docked complexes, is also made possible by MD simulations.2.7. ADMET
The QikProp module of the Schrodinger suite, operating in normal mode, was utilized to calculate ADMET (absorption, distribution, metabolism, excretion, and toxicity) predictions for the leading docking hits, which comprised three natural bioactive compounds. The compounds were assessed using Lipinski's rule of five, which includes guidelines that were established to determine the number of violations of Lipinski's rule of five. According to these guidelines, it was stated that the molecular weight should be less than 500, the number of hydrogen bond donors should be equal to or less than 5, the number of hydrogen bond acceptors should be equal to or less than 10, and there should be zero violations.38 The compounds' permeability was predicted using QPPCaco (a model for the gut-blood barrier) and QPlogBB (brain–blood partition coefficient) values. A QPPCaco value greater than 500 indicated good permeability, while a value less than 25 indicated poor permeability. Regarding QPlogBB, negative values indicated that the compounds were polar and exhibited poor permeability. The compounds were predicted to exhibit high human oral absorption, ranging from 85% to 100%.38 The blood/brain partition coefficients (QPlogBB) were calculated and utilized as a predictive factor for access to the central nervous system (CNS). The predicted CNS activity was evaluated on a scale from −2 (inactive) to +2 (active). MDCK cell permeability (QPPMDCK), which is considered a reliable mimic for the blood–brain barrier (BBB) in terms of passive transport, was calculated. The estimates indicated that compounds with MDCK cell permeabilities within the suggested range of 25–500 nm s−1 were considered favourable. The predicted plasma-protein binding was estimated by assessing the binding of the compounds to human serum albumin using the QPlogKhsa parameter. The recommended range for the QPlogKhsa parameter was between −1.5 and 1.5.393. Results and discussion
3.1. Field-based 3D-QSAR
A field-based 3D-QSAR analysis on the series of anti-parasitic natural alkaloid compounds was performed successfully; 50 out of 100 from the said parasitic remained to determine the influence of spatial arrangement of structural features on COVID-2 main protease inhibition. In order to validate the validity and dependability of the predictions for novel compounds, the applicability domain (AD) of both the developed QSAR models was evaluated. The range of structural and chemical characteristics that indicate that the model can reliably generate predictions is defined by the AD. Results of the best-fit model are expressed in Table 2.| 3D-QSAR study's field-based quantitative structure–activity relationship findings | ||||||||||
|---|---|---|---|---|---|---|---|---|---|---|
| # Factors | SD | R2 | R2 CV | R2 scramble | Stability | F | P | RMSE | Q2 | Pearson-r |
| 9 | 0.1695 | 0.971 | 0.3609 | 0.7251 | 0.436 | 178.8 | 8.74 × 10⁻³⁴ | 0.48 | 0.7186 | 0.8563 |
| Results from the examination of the field-based 3DQSAR approach for field fraction | |||||
|---|---|---|---|---|---|
| # Factors | Gaussian steric | Gaussian electrostatic | Gaussian hydrophobic | Gaussian H bond acceptor | Gaussian H bond donor |
| 9 | 0.298 | 0.12 | 0.19 | 0.249 | 0.144 |
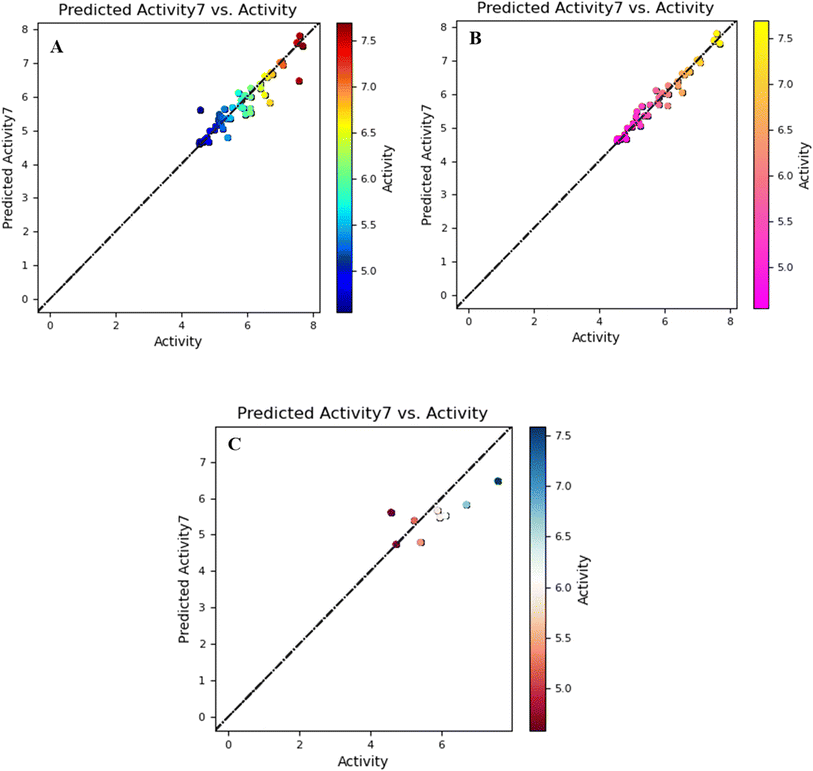
The model generated with a PLS factor of 7 is equipped with better results in terms of statistics, including predictive activity (Table 2). There was a statistically significant increase in predictability with each additional element, up to nine, that was added. The statistical results of the generated model have regression of coefficient R2, which revealed a 0.97 score in addition to F and P scores of 178.8 and 8.74 × 10⁻³⁴, respectively. This statistically significant model also demonstrated that the score of RMSE = 0.48 and Pearson-r is equal to 0.8563. On the basis of cross-validation, the score of the correlation coefficient q2 of the validated model is 0.7186. Reliable predictions were ensured by the fact that 10 of the 20 test compounds fell within the model's AD. As outliers, the remaining ten compounds were found to be outside the specified AD. These substances are not included in the further interpretation of predictions since they are deemed less dependable.
There were 10 ligands (Table 3) out of 50 whose predicted IC50 values were less than 5.9, which were selected as highly active compounds on the basis of the QSAR study.
| Compound | PIC50 | IC50 | Structure | Predicted activity of field base Qsar | Predicted activity of atom base Qsar | Reference |
|---|---|---|---|---|---|---|
| (+)-N-Methylisococlaurine | 5.267606 | 5.40 μM | 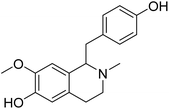 |
5.19284 | 5.17679 | 40 |
| Boldine | 5.559091 | 2.76 μg mL−1 | 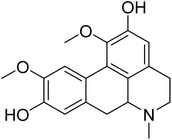 |
5.68303 | 5.88885 | 40 |
| Carpaine | 5.375718 | 4.21 μM | 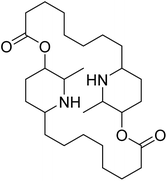 |
5.32348 | 5.43041 | 40 |
| Diazepinomicin | 4.866461 | 13.6 μM | 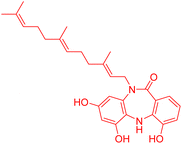 |
4.86717 | 5.04247 | 41 |
| Hymenocardine-H | 4.554396 | 27.9 μM | 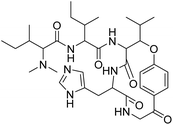 |
4.62099 | 4.45529 | 40 |
| Longamide B | 5.823909 | 1.5 μg mL−1 | 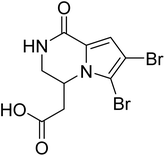 |
5.85809 | 5.84882 | 41 |
| O-Desmethylnummularine-R | 5.49485 | 3.2 μM | 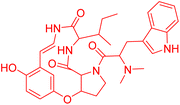 |
5.50443 | 5.47485 | 40 |
| Paenidigyamycin A | 6.107905 | 0.78 μM | 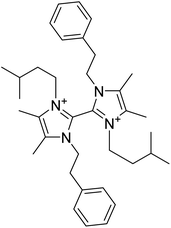 |
5.55175 | 5.81536 | 41 |
| Palauamine | 6.39794 | 0.4 μg mL−1 | 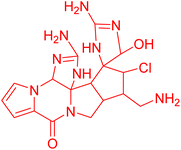 |
5.39522 | 5.64834 | 41 |
| Spongiacidin B | 5.958607 | 1.1 μM | 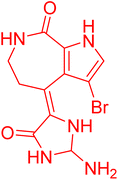 |
5.79629 | 5.97812 | 41 |
The graph of the training and test set has a linear correlation derived from the comparison of biological activity and predictive bioactivity shown in Fig. 1.
The proportional contribution of Gaussian electrostatic, steric, hydrogen bond donor, hydrophobic and hydrogen bond acceptor were 0.12, 0.298, 0.144, 0.19 and 0.249, respectively (Table 2).
3.1.1.1 Gaussian steric field. There were two regions found in the Gaussian steric field, one is green and another is yellow; the former is favoured and the latter is disfavoured. The electron donating amide group encircled in the green region increased the activity of the diazepinomicin. The electron withdrawing carbonyl moiety found in the yellow region has no impact on the activity of diazepinomicin. In comparison to diazepinomicin, two more compounds (+)-N-methylisococlaurine and hymenocardine-H were discussed in this study. (+)-N-Methylisococlaurine contains an electron-donating tertiary amine group in the favored region, which is responsible for enhancing the activity of this molecule. In terms of activity, yellow has no connection. The graphic of hymenocardine-H depicts that the favored area covered the electron donating part (–OR) of the molecule, which means it boosted its activity. In contrast to the above mentioned region, an activity booster amide group, encircled in the yellow portion, is accountable for reducing the activity of hymenocardine-H.
3.1.1.2 Gaussian electrostatic fields. The Gaussian electrostatic field shows electropositive blue favoured and electronegative red disfavoured zones. The blue zone on diazepinomicin contains two activity-enhancing electron-donating groups: a tertiary amine and an amide, which increases the activity of diazepinomicin. No electron donating and withdrawing groups have been observed in the red zone. (+)-N-Methylisococlaurine and hymenocardine-H have been found in the blue and red areas. The former's tertiary amine and the latter's OR increased the activity in the blue area. The said tertiary amine has been observed in the red zone, which might decrease the activity. The hymenocardine-H carbonyl (EWG) in the red zone has no impact on activity.
3.1.1.3 Gaussian field of hydrogen bond acceptor. The contour map of the H-bond acceptor indicates the red as favourable and magenta as unfavourable portions on the ligand. Region that is covered by red colour is favourable, and another one is unfavourable. Diazepinomicin with an electron-withdrawing group has been observed in the magenta region and revealed no impact on the activity, whereas electron donating groups have been detected in the same region, which decreased the activity.
(+)-N-Methylisococlaurine compound; tertiary amine is seen in the red region with increased activity, hydroxyl is found in both red and magenta areas, and after close monitoring, it is concluded that it may either increase or decrease the activity. (+)-N-Methylisococlaurine compound with methoxy group has been observed in the magenta region with no impact on activity.
Hymenocardine-H compound having an amide group has been found in the red region with increased activity, whereas there were two carbonyl groups, one in the red region with decreased activity and the second one in magenta with nil impact on activity.
3.1.1.4 Gaussian hydrophobic field. There were two regions in the Gaussian hydrophobic field: one was favoured and exhibited as yellow, and one was dis-favoured and exhibited as white. Diazepinomicin with the electron-withdrawing carbonyl group found in the yellow region revealed decreased activity; in the case of electron-donating groups, tertiary amine observed in white shows diminished activity; hydroxyl has been detected in the yellow region, which increased the activity. (+)-N-Methylisococlaurine with a tertiary amine group seen in the yellow region shows increased activity. White region had nothing to do with any activity.
Hymenocardine-H compound with electron-donating groups, namely amide, tertiary amine and hydroxyl, is in the yellow region with increased activity. White region was silent in performance of activity and has no influence on activity enhancement.
3.1.1.5 Gaussian field of hydrogen bond donor. The contour maps of the H-bond donor depicted the purple portions on the ligand as favourable, while the cyan portions were indicated as unfavorable. Purple area has been filled with diazepinomicin, with a tertiary amine, showing enhanced activity. The cyan region showed nil effect on activity. The purple area has been covered with (+)-N-methylisococlaurine tertiary amine, resulting in an enlarged activity. Methoxy group has been found in cyan with no impact on activity, whereas hydroxyl is observed in cyan with decreased activity. Hymenocardine-H amide and –OR have been caught in the purple region with high activity; the carbonyl group discovered in both regions might either increase or decrease the activity.42
3.2. Atom-based 3D-QSAR
Following the successful PLS analysis, we obtained 50 compounds out of 100. The atom-based 3D-QSAR model was successfully developed using PLS factor 9. The applicability domain was also applied to the atom-based 3D-QSAR model. Similar to the field-based 3D-QSAR, ten of the twenty test compounds were found to be within the AD of the model, ensuring accurate predictions. It was discovered that the remaining 10 compounds were outliers, falling outside the designated AD.The statistical findings of the best-fitted model are compiled in Table 4.
| Net results of atom-based 3DQSAR analysis | ||||||||||
|---|---|---|---|---|---|---|---|---|---|---|
| # Factors | SD | R2 | R2 CV | R2 scramble | Stability | F | P | RMSE | Q2 | Pearson-r |
| 9 | 0.1304 | 0.9845 | −0.1329 | 0.9655 | −0.106 | 233.1 | 3.15 × 10⁻²⁷ | 0.54 | 0.6025 | 0.84 |
| Field fraction results of atom-based 3DQSAR analysis | ||||
|---|---|---|---|---|
| # Factors | H-bond donor | Hydrophobic/non-polar | Positive ionic | Electron-withdrawing |
| 9 | 0.059 | 0.594 | 0.03 | 0.317 |
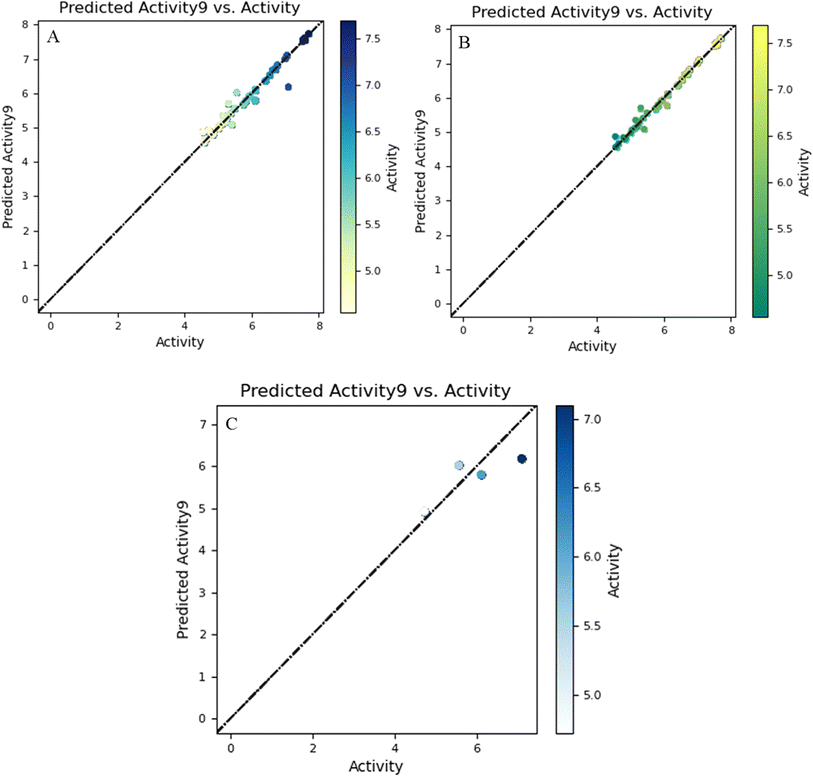
For a PLS factor of 9, the standard deviation was observed with the score of 0.1304, along with the values of R2 and Q2, which were found to be 0.9845 and 0.6025, respectively, and the values of RMSE, F, P and Pearson-r were 0.54, 233.1, 3.15 × 10⁻²⁷ and 0.84, respectively. On the basis of the predicted IC50 values, there were 10 active compounds out of 50 whose predicted IC50 values were less than 5.6.
The training and test sets' linear correlation graph, which was created by comparing biological activity and prediction bioactivity, is displayed in Fig. 2.
Four pharmacophore properties have been observed, namely H-bond donor, hydrophobic, electron-withdrawing and positive ionic, with scores of 0.057, 0.602, 0.312 and 0.029 in sequence (Table 4).
The AD analysis demonstrated the durability of both the QSAR models by confirming that the compound predictions fall within the dependable domain. It was discovered that compounds outside of the AD displayed structural characteristics not found in the training set, suggesting that caution should be used when evaluating their predictions. By assessing the AD, this research guarantees that both the QSAR models were only used in their trusted prediction space.
3.2.1.1 Hydrogen bond donor. The compound diazepinomicin, which has an electron-donating amide group located in the blue cubes, exhibited increased activity. However, a tertiary amine, which is another electron-donating group found in the red cubes, showed diminished activity. On the other hand, a hydroxyl group detected in the red cubes showed decreased activity. (+)-N-Methylisococlaurine was found to have a tertiary amine group located in the blue cubes, which showed increased activity. The red cubes, on the other hand, did not have any correlation with the activity of the compound. The compound hymenocardine-H displayed reduced activity when an OR group was present in the red cubes. Conversely, the compound exhibited enhanced activity when two amide groups were located in the blue cubes. Interestingly, the electron-withdrawing carbonyl group situated in the red cubes did not influence the activity.
3.2.1.2 Hydrophobic. Diazepinomicin, a compound containing both amide and secondary amine functional groups, has been observed to exhibit high activity when encapsulated within blue cubic structures. The activity is diminished as a result of the discovery of hydroxyl in red cubes. Interestingly, when the hydroxyl group is found within red cubic structures, a decrease in activity has been noted.
Blue cubes have been coated with (+)-N-methylisococlaurine, a tertiary amine, leading to enhanced activity. In red cubes, the methoxy group has been identified, but it appears to have no significant effect on activity. Hydroxyl groups, present in both red and blue cubes, have been closely examined, and it has been determined that they may either increase or decrease the activity.
The hymenocardine-H compound, containing tertiary amine and amide groups, has been observed in red cubes with reduced activity. Conversely, the –OR group has been detected in blue cubes, which contributes to increased activity.
3.2.1.3 Electron withdrawing. The electron-donating group (amide) encapsulated within blue cubes has been found to enhance the activity of diazepinomicin. In contrast, the presence of two hydroxyl groups in red cubes led to a decrease in activity. Diazepinomicin, containing both amine and hydroxyl groups, was identified in both types of cubes, which may either increase or decrease the activity.
The (+)-N-methylisococlaurine compound, which includes a tertiary amine and hydroxyl group, was discovered in blue cubes and exhibited increased activity. Two distinct groups were observed: a hydroxyl group in blue cubes that increased the activity and a methoxy group in red cubes with no impact on activity. This compound also contained a hydroxyl group in both cube types, which could either enhance or diminish activity. The hymenocardine-H compound, featuring electron-donating groups such as amides, –OR, and imidazole, was present in red cubes and displayed reduced activity. Meanwhile, the carbonyl group in red cubes did not significantly influence the activity levels.
3.2.1.4 Positive ionic. Only blue cubes were found in positive ionic pharmacophore. The compound diazepinomicin, which contains an amine group, was discovered within the blue cubes and demonstrated increased activity. The increased activity of (+)-N-methylisococlaurine and hymenocardine-H, which were found in the blue cubes, can be attributed to the presence of tertiary amine and –OR functional groups on these compounds.43
3.3. Ramachandran plot statistics
The Ramachandran server, which offered improved choices for displaying conformational angles in various locations, was used to confirm the angles of the polypeptide chains in the fundamental conformation of a protein molecule. An improved Ramachandran plot web server was used in the study, which made it possible to exhibit the formation angles in different primary structural elements and designated locations within the plot based on user-specified values (Table S-4: ESI material†).3.4. Molecular docking results
The 10 ligands with the highest activity, ranked from the QSAR analysis, were docked into the binding sites of 12 selected target proteins using the Glide Dock module in Maestro 13.7. The binding interactions of the selected molecules are displayed in a tabular format. The selection of lead compounds was determined by their high docking scores and binding affinities with specific proteins. Based on these criteria, three ligands, namely diazepinomicin, (+)-N-methylisococlaurine, and hymenocardine-H, were identified as the lead compounds. Diazepinomicin was docked with five proteins, namely 6YNE, 6W8H, 7JWR, 7JVY, and 7JWD, resulting in respective docking scores of −5.664, −7.948, −9.417, −8.351, and −8.068 (Table S-5: ESI material†). Likewise, (+)-N-methylisococlaurine was docked with four proteins, specifically 6SFR, 7JX2, 6VF1 and 6UX9, and achieved docking scores of −6.181, −7.607, −8.672 and −7.727. Similarly, hymenocardine-H interacted with two proteins, namely, 7AVT and 6W81 and yielding docking scores of −5.866 and −7.635, respectively. The lead compounds demonstrated high docking scores in comparison to both the reference drugs and the remaining 7 compounds, which were selected from the QSAR analysis pool of 10 compounds. Despite a remarkable docking score of −9.417, Diazepinomicin did not exhibit any interaction with 7JWR (Fig. 3). Due to the possibility of no interactions between the chemical and the protein, despite a high docking score, the expected binding site did not line up with the real binding site.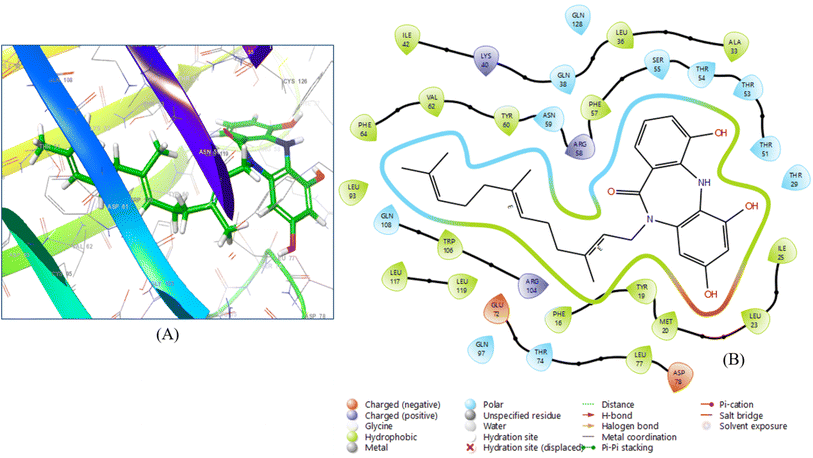 | ||
| Fig. 3 (A) 3D ligand–protein interaction and (B) 2D co-crystallized ligand–protein interaction of diazepinomicin. | ||
The (+)-N-methylisococlaurine bound more tightly to the 6VF1 receptor, with a docking score of −8.672. The diagram illustrates the ligand–protein interaction, with purple arrows representing hydrogen bonds and grey arrows indicating metal coordination (Fig. 4).
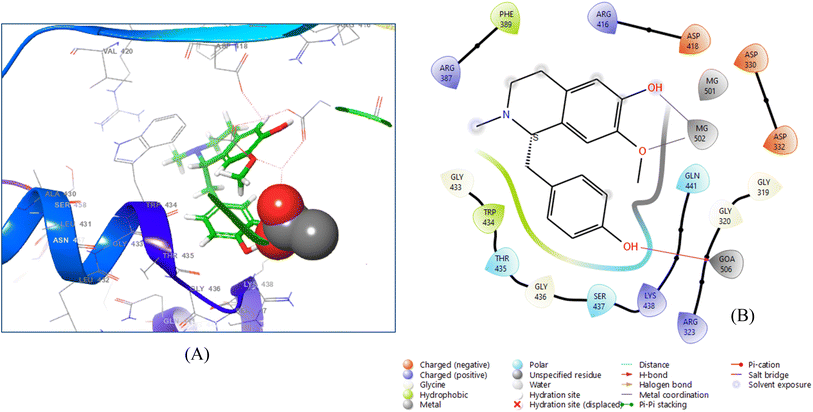 | ||
| Fig. 4 3D ligand–protein interaction (A) and 2D co-crystallized ligand–protein interaction (B) of (+)-N-methylisococlaurine. | ||
Two hydroxyl groups were observed in the ligand interaction diagram, which depicted that the residue GOA 506 interacts with the first hydroxyl group through hydrogen bonding, keeping the distance of 1.58 Å, whereas the residue MG 502 shows two metal coordination with the second hydroxyl group and with the oxygen atom of methoxy group by maintaining the distances 2.10 Å and 2.38 Å, respectively.
Hymenocardine-H exhibited binding affinity to the 6W81 protein, as evidenced by a docking score of −7.635. Upon analysing the ligand interaction diagram (Fig. 5), it was evident that three hydrogen bonds were present. Specifically, the amino acid residue GLU 165 participated in a hydrogen bond with the amine moiety and another hydrogen bond with the carbonyl moiety of the amide group at distances of 2.29 Å and 1.60 Å, respectively. Additionally, the amino acid residue HIE 162 formed a hydrogen bond with the nitrogen atom of the imidazole moiety, positioned at a distance of 1.91 Å.
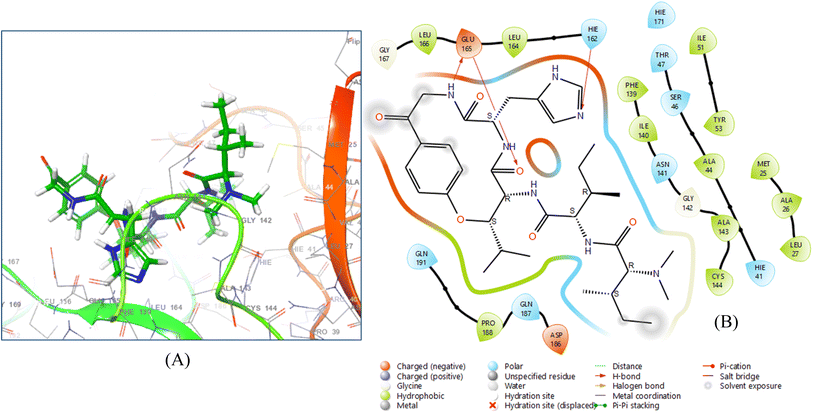 | ||
| Fig. 5 3D ligand–protein interaction (A) and 2D co-crystallized ligand–protein interaction (B) of hymenocardine-H. | ||
3.5. Re-docking
Re-docking analysis is essential to detect possible drawbacks and enhance forecasts for virtual screening and discovery of drugs by guaranteeing the accuracy of docking techniques and scoring computations. RMSD scores were computed in order to compare the experimental and docked poses. Re-docking was deemed successful if the RMSD was less than or equal to 2 Å. The excellent results of 6UX9, 6W8H, 6W81, 7JWR, 7JX2 and 7JZ5 with their scores of RMSD 0.4 Å, 1 Å, 1 Å, 2 Å, 1 Å and 2 Å, respectively, indicated that the docking results are highly accurate because the predicted ligand binding pose is extremely close to the observed stance. Some receptors gave good results and some of them gave results not within the standard range; in contrast to these receptor proteins, only one receptor 6VF1 did not give any outcome (Table 5).| Sr. no. | Protein | Ligand | RMSD value |
|---|---|---|---|
| 1 | 6SFR | LBK-1103 [A] | 10.3641 |
| 2 | 6UX9 | UHJ-4000 [A] | 0.457412 |
| 3 | 6W8H | TJG-203 [A] | 1.01498 |
| 4 | 6W81 | X77-401 [A] | 1.08499 |
| 5 | 6YNE | XPE-401 [A] | 7.27099 |
| 6 | 7AVT | S3T-1103 [A] | 9.82498 |
| 7 | 7JVY | VKV-201 [B] | 4.28949 |
| 8 | 7JWD | VL7-201 [A] | 4.45649 |
| 9 | 7JWR | YOG-201 [A] | 2.05612 |
| 10 | 7JX2 | VLP-201 [A] | 1.76298 |
| 11 | 7JZ5 | VYP-201 [A] | 2.13165 |
3.6. MM–GBSA
The prime MM–GSBA study (Table S-6: ESI material†) illustrates the corresponding binding energies of each ligand relative to the specific receptor. The MM–GBSA assay results show that the energies corresponding to the strong binding of ligands in the binding pouch of 7AVT, 6SFR, 6YNE, 6W8H, 7JX2, 7JWR, 7JVY, 7JWD, 6W81, 6VF1 and 6UX9 were van der Waals (GvdW) and non-polar solvation (GLipo) energies, owing to the high negative values demonstrated by all the molecules. Additionally, the higher values of GVdW and GLipo in the negative range demonstrate notable hydrophobic interaction with each of the ligands and all of the chosen proteins. In comparison to the reference medicine oseltamivir, a highly preferred ligand binding was seen for three compounds: (+)-N-methylisococlaurine, diazepinomicin, and hymenocardine-H. (+)-N-Methylisococlaurine exhibits the highest binding energy values in the 7 protein–ligand complexes, whereas diazepinomicin expressed the highest binding energy values in 6 complexes and hymenocardine-H revealed the highest binding energy values in 4 protein–ligand complexes as compared to the reference drug (Table S-6: ESI material†). This result is also connected with the docking score since (+)-N-methylisococlaurine, diazepinomicin, and hymenocardine-H had the greatest docking scores, indicating that coulomb energy (GCoul −67.5 to −0.97 kcal mol−1) is an important factor in the interaction between the drugs and receptors. The leading compounds had significant binding affinities, as evidenced by their binding energies (G bind), which ranged from −80.96 to −26.48 compared to the reference drug, which ranged from −66.66 to −35.22 kcal mol−1. The MM–GSBA experiment reveals that the compounds (+)-N-methylisococlaurine, diazepinomicin, and hymenocardine-H have significant binding affinity for the receptors (Fig. 6).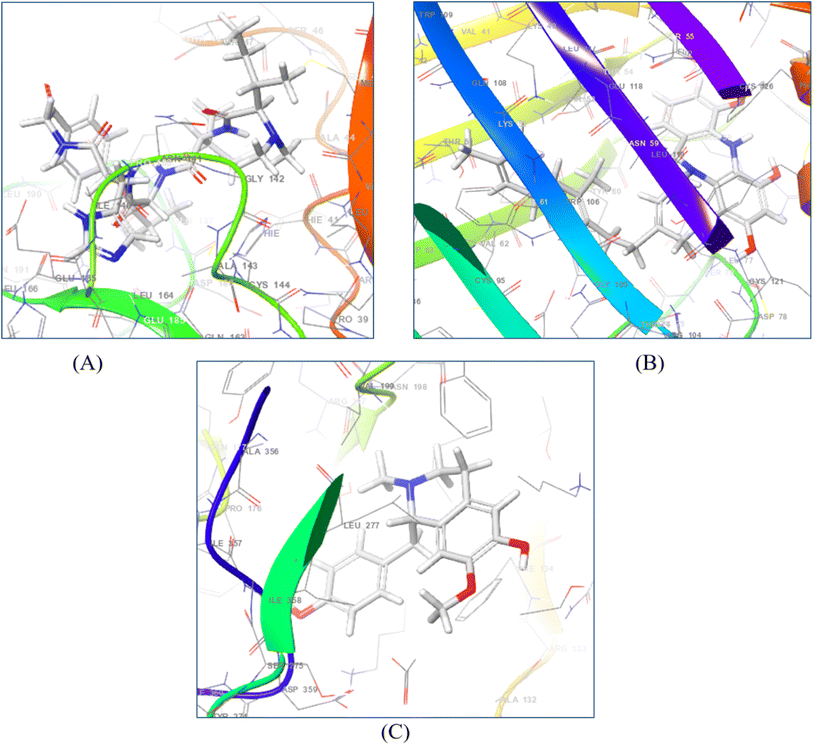 | ||
| Fig. 6 3D diagrams of N-methylisococlaurine (A), diazepinomicin (B), and hymenocardine-H (C) complexes with their respective target proteins. | ||
3.7. MD simulation
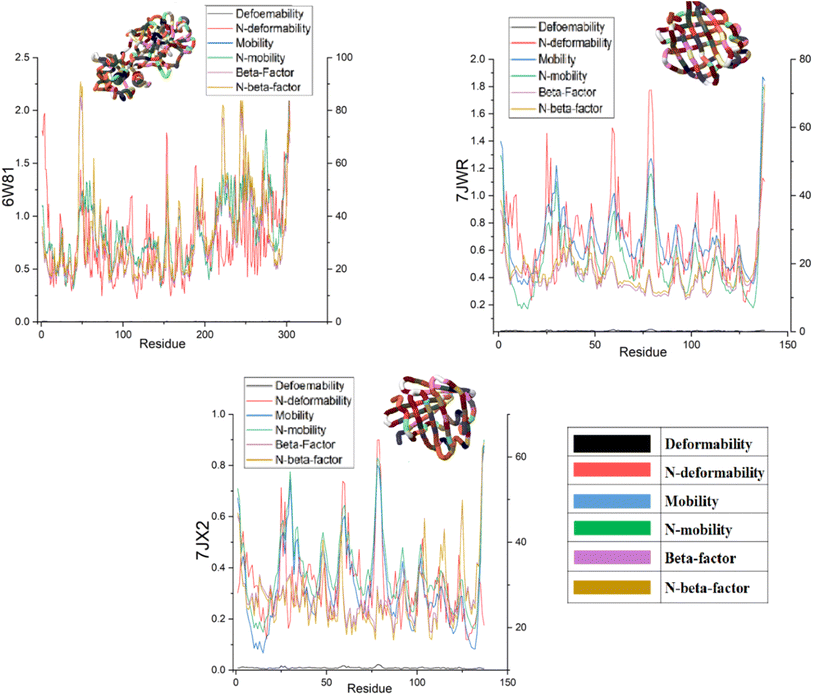
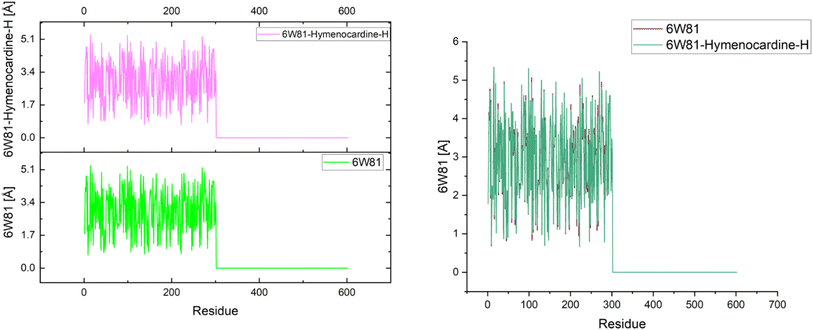
The effects of ligands on protein structure were evaluated using MD simulations. Following a simple MD simulation, the protein areas with the highest amounts of flexibility were identified. The maximum RMSF score indicates greater flexibility, whilst the smallest value denotes the system's restricted motion across the simulation course. The “residue-based root mean square deviation” of the backbone of 7JWR, 6W81 and 7JX2 was maximal 1 at residue numbers 79, 303 and 79, respectively, in contrast to 6VF1 and 6UX9, where no outcomes were observed. The greatest RMSF values imply that some regions of a protein/ligand are more adaptable and dynamic than others. This is possibly caused by the structure's innate flexibility or the ligand's effect on the flexibility of the complex.The minimum RMSF values of the backbone of 7JWR were 0.208 at residue number 128, whereas 6W81 and 7JX2 exhibited a score of minimum RMSF was 0.097 at residue number 117 and 2.197 at residue number 128. The minimal RMSF values suggest that specific protein or ligand regions are reasonably stable and hold their locations throughout the simulation. The graphs of RMSF and overlapping RMSF are displayed in Fig. 7 and 8. The profile of the graph was comparable, with some modifications in the protein loop areas, which were structurally perceived to be more flexible.
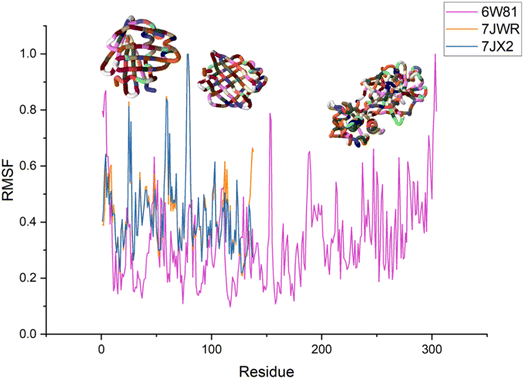 | ||
| Fig. 7 Graph of RMSF of the top three protein–ligand complexes named 7JWR-diazepinomicin, 7JX2-(+)-N-methylisococlaurine and 6W81-hymenocardine-H. | ||
The mobility characteristics of the docked proteins were determined by deformability and B-factor. The deformability and B-factors of the complexes named 7JWR-diazepinomicin, 7JX2-(+)-N-methylisococlaurine and 6W81-hymenocardine-H exhibited peaks that correlate with the deformable regions in the proteins, with the greatest peaks denoting the regions with high deformability. The B-factor plots provide a comparison of the complexes' NMA and PDB fields.
Each normal mode has an inverse relationship with the eigenvalue and variance. The graphs of eigenvalue and variance of 7JWR-diazepinomicin, 7JX2-(+)-N-methylisococlaurine and 6W81-hymenocardine-H complexes are portrayed in Fig. S1–S3 (ESI material).† Diazepinomicin and (+)-N-methylisococlaurine's variance graph with the target proteins shows individual variance as purple-shaded bars and cumulative variance as green-shaded bars. The ease of deformation increases with decreasing eigenvalue, as expressed in Table 6.
| Protein–ligand complex | Eigenvalue |
|---|---|
| 7JWR-diazepinomicin | 8.553141 × 10⁻⁴ |
| 7JX2-(+)-N-methylisococlaurine | 9.215982 × 10⁻⁴ |
| 6W81-hymenocardine-H | 1.297494 × 10⁻⁴ |
The correlations between the residues in a compound were seen in the covariance matrices of the top three complexes (Table 6). While the white colour in the matrix represents uncorrelated motion, the red colour shows a good correlation between residues. Additionally, the blue color exhibits anti-correlations. The complexity of the system improves with correlation. The relationships between the atoms were shown in the elastic maps found in docked proteins, where the stiffer regions are indicated by the darker grey areas.
Morphing MD stimulation was performed to assess the stability of selected protein–ligand complexes. The RMSD of the Cα atoms in the protein backbone, which describes the total conformational “stability” of the complex in a dynamic state throughout the simulation, is one of the crucial factors to consider when analysing a protein–ligand complex. When the system achieves low levels of RMSD-Cα and consistent variations across the entire simulation, it is said to be equilibrated and stable; contrary to this, higher variations signify low stability. Highly divergent RMSD graphs may also signify significant protein conformational changes needed to achieve a stable conformation associated with the ligand. The score of RMSD Cα of protein less than 2 Å is considered the more stable one. Low values of RMSD Cα between the initial and target complexes indicated that these complexes are identical. The RMSD Cα values in complexes with their respective ligand molecules are portrayed in graphs in Fig. 9.
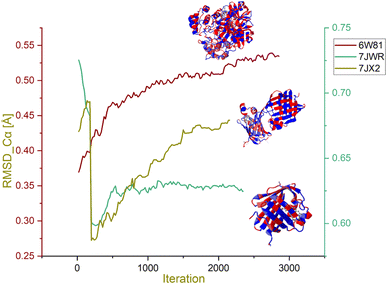 | ||
| Fig. 9 RMSD Cα graph of the hymenocardine-H, diazepinomicin and (+)-N-methylisococlaurine complexes. | ||
The RMSD scores Cα for 7JWR-diazepinomicin, 7JX2-(+)-N-methylisococlaurine and 6W81-hymenocardine-H were 0.72 Å, 0.41 Å and 0.36 Å at 0.27 ns, 1.44 ns and 0.06 ns, respectively (Fig. 9). It is clear that the selected complexes exhibited low values of RMSD-Cα and consistent variations across the entire simulation, and these complexes were said to be equilibrated and stable. In contrast, there were two complexes whose results were not observed.
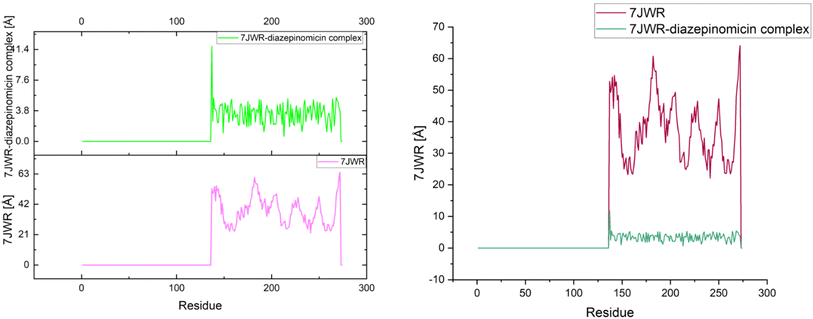
The dispersion of atoms of the protein along its axis is referred to as the radius of gyration. Changes in the radius of gyration were observed for the native and selected complexes to assess the measurement of the folding and unfolding of the protein structure when bound to the ligand. The sky-scraping radius of gyration demonstrates that the state of the protein-ligand complex is more unfolded and less compact. The relation between RMSD Cα and the radius of gyration (Rg) is direct.
The radius of gyration of the 7JWR-diazepinomicin complex was 11.7 Å (1.17 nm), which indicated that in this conformation, the protein was more compact and more folded as compared to the native state with a score of 52.7 Å (5.27 nm) (Fig. 10). The low value of the radius of gyration implies that the diazepinomicin binding stabilized the protein 7JWR conformation, and this decrease in the value also indicated the strong interaction between diazepinomicin and 7JWR.
The native and the 7JX2-(+)-N-methylisococlaurine complex exhibited the Rg values of 4.79 Å (0.47 nm) and 4.65 Å (0.46 nm), respectively (Fig. 11). The slight decrease in the value of Rg disclosed that in this conformation, the protein was slightly more compact and folded than in the native state. In addition, the binding of (+)-N-methylisococlaurine stabilized the conformation of the protein 7JX2 and also revealed the strong interaction between (+)-N-methylisococlaurine and 7JX2.
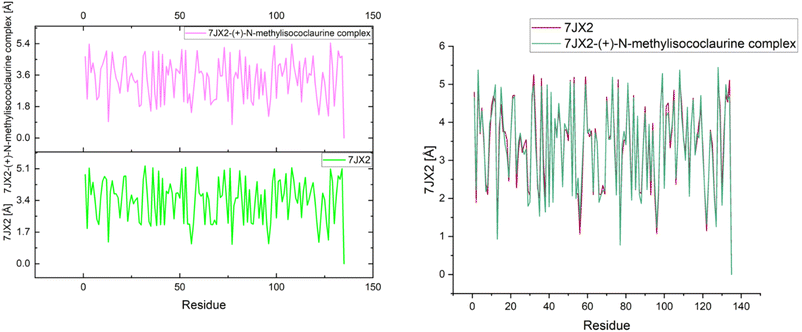 | ||
| Fig. 11 Individual and overlapping plots of the protein–ligand complex 7JX2-(+)-N-methylisococlaurine. | ||
The Rg value of 6W81-hymenocardine-H complex was 4.69 Å (0.46 nm) compared to the native state, with a value of 4.77 Å (0.47 nm). As described earlier, the Rg value of the 6W81-hymenocardine-H complex was slightly lower than that of the native state, stating that the protein in this conformation is more folded and compact (Fig. 12). The binding of hymenocardine-H with 6W81 stabilized the confirmation, and there is a strong interaction between 6W81 and hymenocardine-H. In the selected top three complexes, a constant pattern is found in (+)-N-methylisococlaurine and 7JX2, as shown in Fig. 12.
3.8. ADMET
QikProp generates physically relevant descriptors, and during the drug discovery and development process, the toxicity of a ligand is regarded as a significant factor for the ligand to function as an effective candidate. The outcomes of Lipinski's rule of five and ADME prediction for the three leading compounds are presented in Table S-7 (ESI material†), indicating the results obtained from Qikprop. Upon scrutiny of Lipinski's rule for the three compounds, it was observed that hydrogen bond donors were present in diazepinomicin, (+)-N-methylisococlaurine, and hymenocardine-H, with values of 4, 2, and 2.75, respectively. Additionally, the number of hydrogen bond donors in diazepinomicin and (+)-N-methylisococlaurine was measured as 5.75 and 4.25, respectively, whereas hymenocardine-H exhibited 14 hydrogen bond donors. Furthermore, the analysis revealed that diazepinomicin and (+)-N-methylisococlaurine showed no violations, in contrast to hymenocardine-H, which exhibited two violations.When considering molecular weight, diazepinomicin and (+)-N-methylisococlaurine displayed convincing results with respective weights of 462.588 and 299.369. However, hymenocardine-H had a molecular weight of 653.82. The top three compounds demonstrated scores of 244.511, 209.925, and 96.477, indicating their good permeability across the gut-blood barrier (QPPCaco). These compounds exhibited negative values according to the results of QPlogBB, indicating their polarity and poor permeability. Diazepinomicin achieved a perfect score of 100% in terms of the percentage of human oral absorption, while (+)-N-methylisococlaurine scored 85%. Hymenocardine-H, on the other hand, exhibited an absorption rate of 46.753%. A predicted CNS activity of −2 was observed for diazepinomicin and hymenocardine-H, while (+)-N-methylisococlaurine exhibited a value of +1. The results expressed in the table of MDCK cell permeability (QPPMDCK) suggested that these compounds possessed the ability of cell permeability. The plasma-protein binding results of 0.238, 0.943, and −0.703 were obtained for (+)-N-methylisococlaurine, diazepinomicin, and hymenocardine-H, respectively. These results suggested that these compounds could bind plasma proteins.44
4. Conclusion
COVID-19 is a highly transmissible disease that was responsible for the sudden increase in death rates worldwide. This disease spreads through touch and respiratory droplets. Various compounds were used to treat SARS, but due to the diverse pharmaceutical properties, the class of alkaloids emerges as the most effective class against COVID-19. In this study, 100 natural alkaloids were collected from the literature and then transformed into 2D structures. Consequently, a 3DQSAR study was applied to the data set, resulting in the automatic screening of 50 compounds from the data set of 100 compounds. The values of q2 and r2 of the validated field-based 3DQSAR model were 0.7186 and 0.971, respectively. The validated atom-based 3DQSAR model has the q2 and r2 scores of 0.6025 and 0.9845. Based on the predictive IC50 values, 10 compounds were selected. 12 proteins were selected from the RCSB protein data bank to perform the docking analysis. Molecular docking was performed on the selected 10 compounds, including a reference drug oseltamivir with their respective proteins (7AVT, 6SFR, 6YNE, 6W8H, 7JX2, 7JWR, 7JVY, 7JZ5, 7JWD, 6W81, 6VF1 and 6UX9). On the basis of the highest docking score, 3 compounds diazepinomicin, (+)-N-methylisococlaurine and hymenocardine-H emerged as the top three compounds in which diazepinomicin expressed the high docking score with 5 proteins, (+)-N-methylisococlaurine with 4 proteins and the hymenocardine-H shows best score with 2 proteins. After docking, MM–GBSA was performed on diazepinomicin, (+)-N-methylisococlaurine and hymenocardine-H complexes with their corresponding proteins, validating the molecular docking scores. Subsequently, MD simulations were performed on complexes of 7JX2-(+)-N-methylisococlaurine, 6W81-hymenocardine-H and 7JWR-diazepinomicin, which indicated that the results of molecular docking were reliable. Finally, ADMET was performed on these best compounds, indicating that (+)-N-methylisococlaurine had the most affirmative properties among the three. (+)-N-Methylisococlaurine appears to be a promising therapeutic agent for future COVID-19 primary protease medication development.Data availability
Data will be made available on request.Author contribution
Shagufta Parveen: english editing, supervision, paper writing; Laiba Shahbaz: compound synthesis and analysis, molecular docking study, paper writing; Nusrat Shafiq*: conceptualization, supervision, drafting and write up of paper; Maryam Rashid: proofreading, english check, figure quality and resolution.Conflicts of interest
Authors have no conflict of interest.Acknowledgements
The authors are thankful to the Higher Education Commission Pakistan for providing financial aid for spectroscopic analysis. We also thank the Higher Education Commission Pakistan for providing support to conduct the study under the research grant HEC/TDF03-172. The authors extend their appreciation to the Researchers Supporting Project (RSPD2024R758), King Saud University, Riyadh, Saudi Arabia.References
- G. Topçu, H. Şenol, G. Alim Toraman and V. Altan, Bezmialem Sci., 2020, 8(3), 131–139 CrossRef.
- A. Balkhair, Sultan Qaboos Univ. Med. J., 2009, 9, 257 Search PubMed.
- A. Balkhair, K. Al Maamari and F. B. Alawi, Oman Med. J., 2013, 28, 226 CrossRef.
- A. Sharma, S. Tiwari, M. K. Deb and J. L. Marty, Int. J. Antimicrob. Agents, 2020, 56, 106054 CrossRef CAS PubMed.
- E. Petersen, M. Koopmans, U. Go, D. H. Hamer, N. Petrosillo, F. Castelli, M. Storgaard, S. Al Khalili and L. Simonsen, Lancet Infect. Dis., 2020, 20, e238–e244 CrossRef CAS.
- S. T. Moein, S. M. Hashemian, B. Mansourafshar, A. Khorram-Tousi, P. Tabarsi and R. L. Doty, Int. Forum Allergy Rhinol., 2020, 10(8), 929–1030 CrossRef.
- P. Kalhotra, V. C. Chittepu, G. Osorio-Revilla and T. Gallardo-Velazquez, Molecules, 2021, 26, 936 CrossRef CAS PubMed.
- I. Astuti, Diabetes Metab. Syndr.: Clin. Res. Rev., 2020, 14, 407–412 CrossRef PubMed.
- I. A. Guedes, L. S. Costa, K. B. Dos Santos, A. L. Karl, G. K. Rocha, I. M. Teixeira, M. M. Galheigo, V. Medeiros, E. Krempser and F. L. Custódio, Sci. Rep., 2021, 11, 1–20 CrossRef.
- M. Z. Tay, C. M. Poh, L. Rénia, P. A. MacAry and L. F. Ng, Nat. Rev. Immunol., 2020, 20, 363–374 CrossRef CAS PubMed.
- G. Pascarella, A. Strumia, C. Piliego, F. Bruno, R. Del Buono, F. Costa, S. Scarlata and F. E. Agrò, J. Intern. Med., 2020, 288, 192–206 CrossRef CAS.
- W. D. Jang, S. Jeon, S. Kim and S. Y. Lee, Proc. Natl. Acad. Sci. U. S. A., 2021, 118, e2024302118 CrossRef CAS PubMed.
- A. D'Alessandro, T. Thomas, M. Dzieciatkowska, R. C. Hill, R. O. Francis, K. E. Hudson, J. C. Zimring, E. A. Hod, S. L. Spitalnik and K. C. Hansen, J. Proteome Res., 2020, 19, 4417–4427 CrossRef PubMed.
- L. Pan, M. Mu, P. Yang, Y. Sun, R. Wang, J. Yan, P. Li, B. Hu, J. Wang and C. Hu, Am. J. Gastroenterol., 2020, 115 CrossRef.
- V. R. Bora and B. M. Patel, Front. Mol. Biosci., 2021, 8, 643004 CrossRef CAS.
- J. Liu, X. Liao, S. Qian, J. Yuan, F. Wang, Y. Liu, Z. Wang, F.-S. Wang, L. Liu and Z. Zhang, Emerg. Infect. Dis., 2020, 26, 1320 CAS.
- World Health Organization, Coronavirus disease 2019 (COVID-19): situation report, 73, World Health Organization, 2020, https://iris.who.int/handle/10665/331686 Search PubMed.
- Y. Wu, W. Ho, Y. Huang, D.-Y. Jin, S. Li, S.-L. Liu, X. Liu, J. Qiu, Y. Sang and Q. Wang, Lancet, 2020, 395, 949–950 CrossRef CAS.
- J. Shang, Y. Wan, C. Luo, G. Ye, Q. Geng, A. Auerbach and F. Li, Proc. Natl. Acad. Sci. U. S. A., 2020, 117, 11727–11734 CrossRef CAS.
- R. Gorkhali, P. Koirala, S. Rijal, A. Mainali, A. Baral and H. K. Bhattarai, Bioinf. Biol. Insights, 2021, 15(21), 1–32 Search PubMed.
- D. Silveira, J. M. Prieto-Garcia, F. Boylan, O. Estrada, Y. M. Fonseca-Bazzo, C. M. Jamal, P. O. Magalhães, E. O. Pereira, M. Tomczyk and M. Heinrich, Front. Pharmacol., 2020, 1479 Search PubMed.
- D. Ndwandwe and C. S. Wiysonge, Curr. Opin. Immunol., 2021, 71, 111–116 CrossRef CAS PubMed.
- B. Meseret, B. Sara, C. Gregory, C. Thomas, D. Layne, F. Marc, W. Louise Francois, G. Jason M, K. Kiersten, L. Gayle, L. Kristin, M. Stacey, M. Felicita, M. Kiren, N. Leisha, S. Katrin, S. Robin, T. Gail and T. Alma, Morb. Mortal. Wkly. Rep., 2021, 70(21), 792–793 CrossRef PubMed.
- S. A. Khalifa, N. Yosri, M. F. El-Mallah, R. Ghonaim, Z. Guo, S. G. Musharraf, M. Du, A. Khatib, J. Xiao and A. Saeed, Phytomedicine, 2021, 85, 153311 CrossRef CAS PubMed.
- J. Kurek, Alkaloids: Their Importance in Nature and Human Life, BoD–Books on Demand, 2019 Search PubMed.
- Q. Shi, S. Hui, A.-H. Zhang, X. Hong-Ying, Y. Guang-Li, H. Ying and W. Xi-Jun, Chin. J. Nat. Med., 2014, 12, 401–406 Search PubMed.
- A. Al-Harrasi, T. Behl, T. Upadhyay, S. Chigurupati, S. Bhatt, A. Sehgal, S. Bhatia, S. Singh, N. Sharma and S. Vijayabalan, Environ. Sci. Pollut. Res., 2022, 1–29 Search PubMed.
- F. R. Bhuiyan, S. Howlader, T. Raihan and M. Hasan, Front. Biomed., 2020, 7, 444 Search PubMed.
- J. Shi, L.-X. Zhao, J.-Y. Wang, T. Ye, M. Wang, S. Gao, F. Ye and Y. Fu, Arab. J. Chem., 2022, 15, 103919 CrossRef CAS.
- S. Bouacha, Pharmacophore Generation, 3D-QSAR study, and Molecular Docking of pyrazoline derivatives for antiamoebic activity against HM1: IMSS strain of E. histolytica, Research Square, 2022, DOI:10.21203/rs.3.rs-1459868/v1.
- S. Mirzaei, R. Ghodsi, F. Hadizadeh and A. Sahebkar, BioMed Res. Int., 2021, 1–30 Search PubMed.
- R. Afolabi, S. Chinedu, Y. Ajamma, Y. Adam, R. Koenig and E. Adebiyi, Infect. Genet. Evol., 2022, 97, 105194 CrossRef CAS.
- M. M. Hasan, Z. Khan, M. S. Chowdhury, M. A. Khan, M. A. Moni and M. H. Rahman, Inform. Med. Unlocked, 2022, 29, 100894 CrossRef.
- L. M. Mohamed, M. M. Eltigani, M. H. Abdallah, H. Ghaboosh, Y. A. Bin Jardan, O. Yusuf, T. Elsaman, M. A. Mohamed and A. A. Alzain, Front. Chem., 2022, 10, 975191 CrossRef CAS PubMed.
- S. G. Bhansali and V. M. Kulkarni, Res. Rep. Med. Chem., 2014, 4, 1 Search PubMed.
- A. J. Owoloye, F. C. Ligali, O. A. Enejoh, A. Z. Musa, O. Aina, E. T. Idowu and K. M. Oyebola, PLoS One, 2022, 17, e0268269 CrossRef CAS.
- B. K. Kumar, n. Faheem, K. V. G. C. Sekhar, R. Ojha, V. K. Prajapati, A. Pai and S. Murugesan, J. Biomol. Struct. Dyn., 2022, 40, 1363–1386 CrossRef CAS.
- M. Y. J. Esther, V. Subramaniyan, A. P. Kumar, M. Subramanian and M. Palani, Phcog. J., 2017, 9(6), s35–s43 CrossRef CAS.
- M. El Fadili, M. Er-Rajy, M. Kara, A. Assouguem, A. Belhassan, A. Alotaibi, N. N. Mrabti, H. Fidan, R. Ullah and S. Ercisli, Pharmaceuticals, 2022, 15, 670 CrossRef CAS PubMed.
- P. Uzor, Evid. base Compl. Alternative Med., 2020, 1–17 Search PubMed.
- A. G. Tempone, P. Pieper, S. E. Borborema, F. Thevenard, J. H. G. Lago, S. L. Croft and E. A. Anderson, Nat. Prod. Rep., 2021, 38, 2214–2235 RSC.
- M. Paulino, C. Espinosa-Bustos, J. Bertrand, D. Cabezas, J. Mella, B. Dávila, H. Cerecetto, A. Ballesteros-Casallas and C. Salas, SAR QSAR Environ. Res., 2022, 33, 701–728 CrossRef CAS.
- N. Shakour, F. Hadizadeh, P. Kesharwani and A. Sahebkar, BioMed Res. Int., 2021, 2021(1), 1–10 Search PubMed.
- C. D. K. Amengor, E. Orman, C. A. Danquah, I. O. Ben, P. D. Biniyam and B. K. Harley, BioMed Res. Int., 2022, 2022, 6261528 CrossRef.
Footnote |
| † Electronic supplementary information (ESI) available: Tables (S-1–S-3) and figures (Fig. S1–S4) in file. See DOI: https://doi.org/10.1039/d4ra06536k |
| This journal is © The Royal Society of Chemistry 2025 |

