 Open Access Article
Sustainable corrosion prevention of mild steel in acidic media with Rumex Nepalensis herb extract
Amrita Kumaria,
Navneet Kaura,
Manvinder Kaura,
Fohad Mabood Husainb,
Pradip K. Bhowmik c and
Harvinder Singh Sohal
 *a
*a
aMaterials and Natural Product Laboratory, Department of Chemistry, Chandigarh University, Gharuan-140413, Mohali, Punjab, India. E-mail: drharvinder.cu@gmail.com
bDepartment of Food Science and Nutrition, College of Food and Agriculture Sciences, King Saud University, Riyadh-11451, Saudi Arabia
cDepartment of Chemistry and Biochemistry, University of Nevada Las Vegas, 4505 S. Maryland Parkway, Box 454003, Las Vegas, NV 89154, USA
First published on 13th January 2025
Abstract
Mild steel provides strength to various building and industrial materials but it is badly affected by corrosion. In the present study, we investigate the efficacy of Rumex nepalensis, a plant-based green corrosion inhibitor to minimize mild steel corrosion in a 1 M H2SO4 solution. Weight loss, surface coverage, inhibition efficiency, and corrosion rate measurements were evaluated for various inhibitor concentrations and time intervals. Rumex nepalensis was found to be 98.35% efficient in preventing mild steel from acid corrosion by forming a barrier that reduces the interaction between mild steel and the acidic environment, it was further validated by UV-Vis and contact angle investigations. The scanning electron microscopy images demonstrated the inhibitor's protective effect, showing a smoother surface. These investigations show that the Rumex nepalensis inhibitor significantly improves mild steel's corrosion resistance, offering immediate and long-term protection in acidic environments, even at deficient concentrations. It shows promise as an effective natural inhibitor and merits further consideration for future applications.
1 Introduction
Corrosion has been a serious concern for the past 15 decades because it damages about $2.5 trillion, or 3% of the world's gross domestic product as per NACE's two-year study.1 According to this study, the expressed worldwide cost of corrosion was 3.4% of GDP.2,3 In science, corrosion is the direct chemical reaction where metals interact with acidic corrosive environments to form noble compounds.4,5 Depending on the substrate and environment, corrosion may produce stable products like aluminum oxide, which can provide protective properties in specific cases. However, for mild steel (MS) in acidic environments, such as 1 M H2SO4, corrosion typically forms unstable and non-protective compounds, leading to significant material degradation. Regarding its strong mechanical strength and relatively low cost, MS is a metal that is utilized extensively in most industries.6 It is frequently used in a variety of sectors as chemical batteries, machinery, reaction vessels, storage tanks, and pipelines for the petroleum sector.7In addition to their higher rates of chemisorption and physisorption, organic moieties can form a sticky layer on metallic surfaces.8,9 One common technique for preventing corrosion on the surface of active metals in a variety of media is the use of corrosion inhibitors.10,11 So far, this is the most economical, environmentally benign, and biodegradable way to lower the rate of corrosion.12,13 Heteroatoms (N, O, and S) present in phytochemicals of plant extract, fruits, flowers, essential oils, and ionic liquid especially those with pi-electron systems are commonly considered corrosion inhibitors, and many of them have been reported to have appreciable inhibition efficiencies.14–16 Khadom et al. found Cardaria darba leaves with potassium iodide to form a chemisorbed monolayer on mild steel in 1 M HCl, achieving 96% efficiency at 60 °C.17 Pomegranate aril extract acted as a mixed-type inhibitor with 74% efficiency at 25 °C but decreased at higher temperatures.18 El-Etre et al. demonstrated olive leaves as a physical adsorption inhibitor with 66% efficiency at 0.96 g L−1.19
The use of Rumex nepalensis herb extract as a green corrosion inhibitor presents several environmental advantages. Unlike synthetic inhibitors that often involve toxic chemicals, Rumex nepalensis is derived from a renewable and biodegradable source, making it environmentally friendly. The herb is rich in naturally occurring phytochemicals such as flavonoids, tannins, and anthraquinones, which contain heteroatoms and π-electrons that effectively reduce corrosion rates.12,13 To address these concerns, sustainable harvesting practices and the cultivation of Rumex nepalensis in controlled environments can ensure ecological balance, while repurposing extraction waste as biofertilizer or bioenergy feedstock can minimize environmental impact. These measures enhance the herb's viability as a green corrosion inhibitor.7
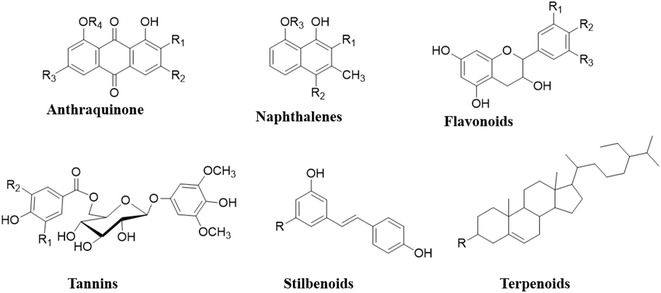
There are over 250 species of plants in the genus Rumex.20 The plant Rumex nepalensis Spreng., also known as R. nepalensis, is a perennial herb that grows upwards.21,22 It is a member of the “Polygonaceous” family and is usually referred to as “Nepal dock.23” Phytochemicals24,25 such as flavonoids, phenols, triterpenoids, anthraquinones, saponins, naphthalene, stilbene glycosides, cardiac glycosides, anthraquinone glycosides, tannic acid, and sterols are present in Rumex nepalensis Fig. 1. The two new naphthalene acyl glucosides, R. neposides A and neposides B, as well as other compounds in chrysophanol (1,8-dihydroxy-3-methyl-9,10-anthraquinone),26 chrysophanol-8-O-β-D-glucopyranoside, chrysophanol-8-O-β-(6′-O-acetyl)-glucopyranoside, emodin-8-O-β-D-glucopyranoside, emodin (6-methyl-1, 3, 8-trihydroxyanthraquinone), citreorosein, resveratrol, nepodin-8-β-D-glucopyranoside, torachrysone-8-O-β-D-glucopyranoside, physcion and torachrysone are reported from this plant.27
Rumex nepalensis offers a sustainable source of green corrosion inhibitors due to its rich phytochemical composition. In the present research, Rumex nepalensis is used as a green corrosion inhibitor for MS in 1 M H2SO4 solution tested by applying weight loss and electrochemical impedance method and SEM study to find the surface morphologies of the metal surface. This technique of mitigating corrosion becomes more fruitful due to its low cost, readily available, and negligible toxicity in the environment as compared to inorganic and organic corrosion inhibitors.
2 Result and discussion
2.1. Phytochemical analysis
To identify the presence of phytochemicals in the extract, we conducted a series of standard assays targeting various bioactive compounds. These tests were designed to detect specific groups of phytochemicals, including alkaloids, flavonoids, tannins, phenolics, saponins, and terpenoids, based on characteristic reactions and color changes observed upon interaction with specific reagents. The results confirmed the presence of alkaloids, steroids, glycosides, terpenoids, tannins, coumarins, and flavonoids, as determined by Mayer's test, Salkowski's test, Keller–Kiliani test, copper acetate test, lead acetate test, alcoholic NaOH test, and sodium hydroxide test, respectively, as summarized in Table 1.| Compound | Tests | Literature | Experimental results | Reference |
|---|---|---|---|---|
| a −ve sign means absence and +ve sign means presence. | ||||
| Alkaloids | Mayer's test | +ve | +ve | 21 |
| Steroids | Salkowaski's test | +ve | +ve | 21 |
| Glycosides | Keller–Kiliani test | +ve | +ve | 28 |
| Terpenoids | Copper acetate test | +ve | +ve | 28 |
| Tannins | Lead acetate test | +ve | +ve | 21 |
| Coumarins | Alcoholic NaOH test | +ve | +ve | 21 |
| Flavonoids | Sodium hydroxide test | +ve | +ve | 28 |
2.2. Weight loss measurements
The Rumex nepalensis inhibitor was employed to evaluate the corrosion characteristics of MS in 1 M H2SO4 solution at 303 K over durations of 6, 12, and 24 hours and at various inhibitor concentrations (0, 100, 200, 300, and 400 ppm). To evaluate the effectiveness of the inhibitor, measurements of the weight loss (ΔW), surface coverage (SC), inhibition efficiency (IE), and corrosion rate (CR) were made. According to the findings presented in Table 2 and Fig. 2, there was serious corrosion in the acidic medium since the weight loss was much higher in the absence of the inhibitor at all time intervals. For instance, the weight loss increased from 1.028 ± 0.001 g at 6 hours to 1.209 ± 0.005 g at 12 hours and 1.324 ± 0.001 g at 24 hours. However, the weight loss gradually decreased as the concentration of the inhibitor increased, indicating the inhibitor's capacity to reduce corrosion. This decline, while still reflecting excellent performance, could be attributed to the possible degradation of the bioactive compounds in the acidic medium over time, particularly given the extract's biological and acidic nature.| Time (h) | Conc. (ppm) | W0 (g) | Wi (g) | ΔW (g) | SC (θ) | IE (%) | CR (mg cm−2 h−1) |
|---|---|---|---|---|---|---|---|
| 6 | 0 | 4.182 ± 0.001 | 3.154 ± 0.002 | 1.028 ± 0.001 | — | — | 1.94 |
| 100 | 4.227 ± 0.002 | 3.753 ± 0.001 | 0.474 ± 0.003 | 0.5389 | 53.89 | 0.90 | |
| 200 | 4.701 ± 0.005 | 4.318 ± 0.003 | 0.383 ± 0.001 | 0.6274 | 62.74 | 0.72 | |
| 300 | 4.448 ± 0.007 | 4.314 ± 0.001 | 0.134 ± 0.007 | 0.8696 | 86.96 | 0.25 | |
| 400 | 4.328 ± 0.001 | 4.311 ± 0.002 | 0.017 ± 0.009 | 0.9835 | 98.35 | 0.03 | |
| 12 | 0 | 3.154 ± 0.002 | 1.945 ± 0.004 | 1.209 ± 0.005 | — | — | 2.28 |
| 100 | 3.753 ± 0.003 | 3.124 ± 0.003 | 0.629 ± 0.001 | 0.4797 | 47.97 | 1.19 | |
| 200 | 4.318 ± 0.005 | 3.885 ± 0.002 | 0.433 ± 0.004 | 0.6419 | 64.19 | 0.82 | |
| 300 | 4.314 ± 0.005 | 4.003 ± 0.004 | 0.311 ± 0.004 | 0.7428 | 74.28 | 0.59 | |
| 400 | 4.311 ± 0.006 | 4.264 ± 0.007 | 0.047 ± 0.006 | 0.9611 | 96.11 | 0.09 | |
| 24 | 0 | 1.945 ± 0.011 | 0.621 ± 0.006 | 1.324 ± 0.001 | — | — | 2.50 |
| 100 | 3.124 ± 0.008 | 2.323 ± 0.005 | 0.801 ± 0.006 | 0.3950 | 39.50 | 1.51 | |
| 200 | 3.885 ± 0.007 | 3.243 ± 0.003 | 0.642 ± 0.002 | 0.5151 | 51.51 | 1.21 | |
| 300 | 4.003 ± 0.002 | 3.543 ± 0.002 | 0.46 ± 0.003 | 0.6526 | 65.26 | 0.87 | |
| 400 | 4.264 ± 0.003 | 4.134 ± 0.002 | 0.13 ± 0.001 | 0.9018 | 90.18 | 0.25 |
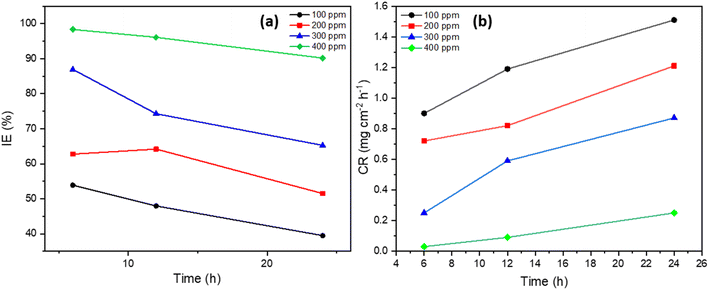 | ||
| Fig. 2 (a) The inhibition efficiency effect, and (b) the corrosion rate of MS with various concentrations of inhibitor in 1 M H2SO4 solution at 303 K. | ||
Remarkable protection was observed, with weight loss at 400 ppm reduced to just 0.017 ± 0.009 g after 6 hours and remained negligible at 0.13 ± 0.001 g after 24 hours. In addition, as the inhibitor concentration increased, surface coverage increased as well, reaching 0.9835 at 400 ppm after 6 hours, indicating that the inhibitor successfully adsorbed onto the MS surface and blocked corrosion sites. The inhibition efficiency, which increased to 98.35% at 400 ppm after 6 hours and remained high at 90.18% after 24 hours, provided more evidence for this, as shown in Fig. 2a. The inhibitor's potent protective effect is further demonstrated by the notable drop-in corrosion rate, which fell from 1.94 mg cm−3 h−1 in the absence of the inhibitor to 0.03 mg cm−2 h−1 at 400 ppm after 6 hours, as shown in Fig. 2b. At the maximum inhibitor dose, the corrosion rate remained low at 0.25 mg cm−2 h−1 even after 24 hours. These results show that the Rumex nepalensis inhibitor is quite efficient in preventing MS from corroding in acidic conditions, especially at concentrations of 300–400 ppm. The inhibitor also offers both short-term and long-term corrosion protection. The decrease in efficiency over time may suggest that some inhibitor components undergo hydrolysis or oxidation under prolonged acidic conditions. These reactions could reduce the active functional groups (such as phenolic or carboxylic groups) responsible for adsorption onto the MS surface.
This trend is visually confirmed in Fig. 2, which depicts an inverse relationship between inhibitor concentration and corrosion rate. Significant improvements in corrosion resistance result at higher concentrations (300–400 ppm), with inhibition efficiencies reaching 90%. All these results demonstrate that the inhibitor, especially at higher concentrations where almost total protection is attained, provides an efficient protective barrier on the MS surface, minimizing the aggressive result of the acidic solution. This stable behavior over time confirms the persistent efficacy of the inhibitor under corrosive conditions.
2.3. Adsorption isotherm
The plant inhibitor adsorbs onto the surface in an acidic solution at 303 K, as demonstrated by the adsorption isotherm study displayed in Table 3 and depicted in Fig. 3. The data indicates that the adsorption behavior can be described by both the Freundlich and Langmuir isotherms; however, the higher correlation coefficients (R2 values) suggest that the Freundlich model fits the data slightly better.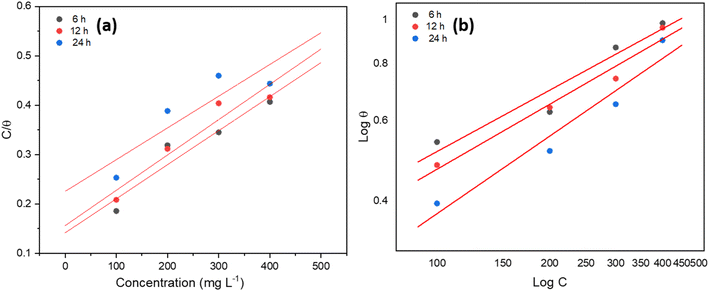 | ||
| Fig. 3 (a) Langmuir adsorption isotherm, and (b) Freundlich adsorption isotherm using inhibitor for MS in 1 M H2SO4 at 303 K. | ||
The R2 values of the Langmuir adsorption isotherm initially exhibit a good correlation at 6 hours (0.91205) and 12 hours (0.91754), but they eventually fall to 0.78224 after 24 hours, suggesting that this model might not be sufficient to explain the adsorption behavior over longer periods. There is a gradual disappearance of this consistency over time, as indicated by the decreasing R2 values, but the slope stays reasonably consistent throughout all time intervals, indicating that the adsorption process somewhat follows a monolayer development on the MS surface.
However, with R2 values of 0.96804 and 0.94178, respectively, the Freundlich adsorption isotherm exhibits a superior overall fit, especially after 12 and 24 hours. The stronger connection indicates that the interaction of the inhibitor with the MS surface is more accurately represented by the Freundlich model, which takes into consideration both heterogeneous surface adsorption and multilayer adsorption. As exposure lengthens, the adsorption process intensifies, as indicated by the increasing slope values of the Freundlich isotherm. As additional inhibitor molecules are adsorbed onto the surface, the positive adsorption indicated by the model's negative intercept values gradually becomes stronger.
In conclusion, the Freundlich isotherm model fits the data better than the other model, especially over longer periods, even if both models offer insightful information. This suggests that over time, the plant-based inhibitor may provide more efficient corrosion inhibition by adhering to the surface in many layers with different affinities.
2.4. Electrochemical measurements
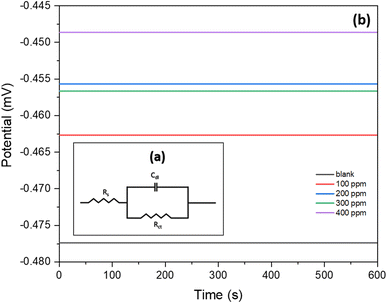
To determine impedance parameters from the experimental results, the data were modeled using an electrical equivalent circuit. Fig. 4a depicts the electrical equivalent circuit used in the presence and absence of the inhibitor. An excellent fit was obtained using these circuits. In the equivalent circuit, Rs represents the solution resistance, Rct denotes the charge transfer resistance, and Cdl corresponds to the double-layer capacitance.
The EIS analysis for MS in 1 M H2SO4 solution with different inhibitor concentrations at 303 K is displayed in Table 4 and Fig. 5. The electrochemical impedance parameters were normalized by the exposed surface area of the MS sample to ensure consistency and comparability of the results. The examination of these results provides important insights into the protection efficiency of the inhibitor as well as modifications to the surface's electrochemical behavior in the acidic environment. For all concentrations, the solution resistance (Rs) is essentially constant, with small variations between 1.423 and 1.497 Ω. This stability implies that the inhibitor primarily affects the charge transfer resistance (Rct), a measure of the MS surface's corrosion resistance, rather than the ionic conductivity of the solution itself. The Nyquist plot (Fig. 5a) demonstrates the impact of the inhibitor on the corrosion process of MS in the corrosive medium, as reflected by changes in the impedance spectra at varying inhibitor concentrations. At lower concentrations (blank, 100 ppm, and 200 ppm), an inductive loop is observed, which may indicate the presence of surface processes such as adsorption/desorption of inhibitor species or relaxation of intermediate products during the corrosion reaction. However, at higher concentrations (300 ppm and 400 ppm), the inductive loop disappears, suggesting that the inhibitor effectively stabilizes the surface and prevents such processes, leading to more uniform adsorption and improved corrosion protection.
| Inhibitor concentration (ppm) | Rs (Ω) | Rct (Ω) | Rp (Ω) | Cdla (F) | IE (%) |
|---|---|---|---|---|---|
| a Note: All values have been normalized by the exposed surface area of the MS sample. | |||||
| 0 | 1.484 | 20.685 | 22.169 | 0.000306 | — |
| 100 | 1.428 | 37.276 | 38.704 | 0.000269 | 44.51 |
| 200 | 1.423 | 52.751 | 54.174 | 0.000240 | 60.79 |
| 300 | 1.447 | 63.412 | 64.859 | 0.000251 | 67.38 |
| 400 | 1.497 | 82.791 | 84.288 | 0.000242 | 75.03 |
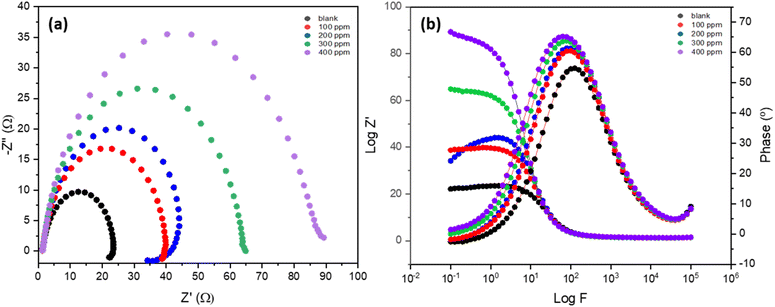 | ||
| Fig. 5 (a) Nyquist plots, and (b) Bode plots for MS in 1 M H2SO4 solution with and without inhibitor at 303 K. Results are normalized by the exposed surface area of the MS sample. | ||
As the concentration of the inhibitor increases, there is a noticeable increase in the Rct which is 20.685 Ω at 0 ppm inhibitor, indicating low resistance to charge transfer and a high rate of corrosion. On the other hand, Rct rises to 37.276 Ω upon the addition of 100 ppm inhibitor, indicating an IE of 44.51%. At 200 ppm, 300 ppm, and 400 ppm concentrations of the inhibitor, Rct values rise to 52.751 Ω, 63.412 Ω, and 82.791 Ω, respectively. The matching inhibition efficiencies increase as well, hitting 60.79%, 67.38%, and 75.03%, respectively. This pattern indicates that by strengthening the MS surface's resistance to charge transfer and so delaying the corrosion process, the inhibitor offers significant protection. The disappearance of the inductive loop at higher concentrations supports the idea that the inhibitor stabilizes the corrosion system, minimizing the complexity of the reaction mechanism. These findings suggest that the inhibitor not only enhances surface resistance but also simplifies the corrosion dynamics at higher concentrations, providing effective corrosion protection.
Moreover, the calculated capacitance of the electrical double-layer Cdl decreases as the concentration of the inhibitor increases from 0 ppm to 200 ppm, followed by slight fluctuations at higher concentrations. This decrease in Cdl is attributed to the adsorption of inhibitor molecules onto the mild steel surface, replacing water molecules and ions in the electrical double layer with organic molecules that have lower dielectric constants. This results in reduced capacitance, indicating the formation of a protective inhibitor layer.
At 300 ppm and 400 ppm, the slight increase and stabilization of Cdl suggest that the inhibitor has effectively covered most of the surface, reducing the active corrosion sites and enhancing Rct. These trends confirm the effectiveness of the inhibitor in forming a robust protective layer, delaying the corrosion process, and altering the surface electrochemical properties.
This behavior is further supported by the Nyquist and Bode plots, shown in Fig. 5a and b, respectively, in which the Nyquist plots depict that the width of the arcs in the plots grows as the inhibitor concentration does. Greater corrosion protection and a stronger charge transfer resistance are correlated with larger diameters.29 The increased Rct values imply that the inhibitor molecules attach themselves to the surface and create a barrier that prevents the corrosion reaction from happening. The constant increase in inhibition efficiency indicates that this barrier becomes more effective at greater inhibitor concentrations. In conclusion, the EIS analysis unequivocally demonstrates that, in an acidic solution, the plant-based inhibitor greatly increases the corrosion resistance of the MS surface. The charge transfer resistance and inhibition efficiency increase with increasing inhibitor concentration.30 This shows that the inhibitor reduces corrosion on the steel surface by forming a protective layer, with 400 ppm being the optimal concentration for performance.31
| Inhibitor concentration (ppm) | Ecorr (V vs. SCE) | Icorr (A cm−2) | Rp (Ω) | βa (V dec−1) | −βc (V dec−1) | CR (mg cm−2 h−1) | IE (%) |
|---|---|---|---|---|---|---|---|
| 0 | −0.47546 | 9.988 × 10⁻⁴ | 476.03 | 0.0952 | 0.0334 | 11.62 | — |
| 100 | −0.46448 | 6.076 × 10⁻⁵ | 7644.50 | 0.09863 | 0.0426 | 0.707 | 93.19 |
| 200 | −0.46097 | 6.793 × 10⁻⁵ | 6785.96 | 0.1124 | 0.0972 | 0.790 | 93.92 |
| 300 | −0.45197 | 6.109 × 10⁻⁵ | 7398.43 | 0.1348 | 0.1137 | 0.711 | 93.88 |
| 400 | −0.44785 | 3.534 × 10⁻⁶ | 126![[thin space (1/6-em)]](https://www.rsc.org/images/entities/char_2009.gif) 726 726 |
0.1764 | 0.1482 | 0.041 | 99.64 |
The corrosion potential (Ecorr) at 0 ppm is −0.47546 V vs. SCE, representing the baseline corrosion state of mild steel. As the inhibitor concentration increases, the Ecorr shifts positively, showing that the inhibitor stabilizes the MS surface and reduces its susceptibility to corrosion. The corrosion current density (Icorr) at 0 ppm is 9.988 × 10⁻⁴ A cm−2, corresponding to a high corrosion rate. This drastic reduction highlights the inhibitor's efficiency in minimizing electrochemical corrosion reactions. Nevertheless, the Icorr dramatically drops as the inhibitor concentration rises. The Icorr decreases to 6.076 × 10⁻⁵ A cm−2 at 100 ppm and to an extremely insignificant 3.534 × 10⁻⁶ A cm−2 at 400 ppm.
The polarization resistance (Rp) improves with increasing inhibitor concentration, rising from 476.03 Ω at 0 ppm to 12![[thin space (1/6-em)]](https://www.rsc.org/images/entities/char_2009.gif) 672.6 Ω at 400 ppm. This substantial increase in Rp signifies the formation of a robust protective layer by the inhibitor, further hindering the corrosion process.
672.6 Ω at 400 ppm. This substantial increase in Rp signifies the formation of a robust protective layer by the inhibitor, further hindering the corrosion process.
The anodic and cathodic reactions involved in corrosion are reflected in the kinetics of the Tafel slopes, βa (anodic) and −βc (cathodic), as shown in Fig. 6. The anodic slop is 0.0952 V/dec and the cathodic slop is 0.0334 V dec−1 at 0 ppm. At 100 ppm, for instance, βa climbs to 0.09863 V dec−1 and −βc to 0.0426 V dec−1. These modifications imply that the inhibitor slows down the total corrosion response by influencing both the anodic and cathodic processes.
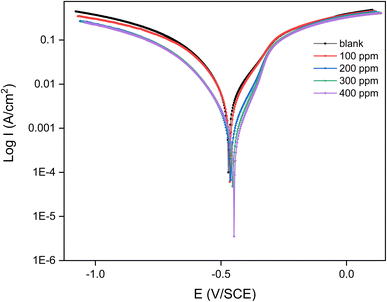 | ||
| Fig. 6 Tafel plot for MS in 1 M H2SO4 solution with or without various concentrations of inhibitor at 303 K. | ||
The corrosion rate is 11.62 mg cm−2 h−1 in the absence of the inhibitor, indicating considerable corrosion. The corrosion rate reduces to 0.707 mg cm−2 h−1 at 100 ppm and to 0.041 mg cm−2 h−1 at 400 ppm. The capacity of the inhibitor to shield the MS against severe corrosion is demonstrated by the significant decrease in corrosion rate, especially in an acidic environment.
Finally, the IE increases dramatically when the concentration of the inhibitor rises. The IE is 93.19% at 100 ppm and reaches an astounding 99.64% at 400 ppm. This shows that the inhibitor offers excellent protection even at lower concentrations and that at higher concentrations, it almost completely stops corrosion, demonstrating its exceptional efficacy in the specified environment. Hence, the evidence indicates that the inhibitor is quite successful in lowering the rate of corrosion of MS in a 1 M H2SO4 solution. The inhibitor forms a protective barrier on the steel surface that considerably impedes the electrochemical reactions that cause corrosion, as evidenced by the shift in corrosion potential, reduction in corrosion current density, changes in Tafel slopes, and dramatic drop-in corrosion rate.32 The promise of this inhibitor to provide nearly total corrosion protection is further supported by its strong inhibition efficacy at higher concentrations.33
2.5. Contact angle analysis
An examination of the contact angle measurements on MS chips under various circumstances is shown in Fig. 7a–d, which provides insight into the characteristics of the surface and the interactions of the MS surface with the inhibitor and the acidic solution.34Given that fresh steel normally has some affinity for water, a fresh MS chip has a contact angle of 72.51°, showing moderate hydrophilicity, as shown in Fig. 7a. The contact angle increases to 88.82°, as shown in Fig. 7b, when a corrosion inhibitor is applied in an open environment. This indicates better hydrophobicity since the inhibitor forms a protective barrier that prevents water penetration.35 In a 1 M H2SO4 solution without inhibitor, the contact angle rises dramatically to 105.65°, as shown in Fig. 7d, possibly owing to the production of surface oxides and corrosion products, which might impact wettability. However, when a 400 ppm inhibitor is put in the acidic solution, the contact angle further rises to 112.14°, as shown in Fig. 7c, showing greater hydrophobicity as the inhibitor creates a more effective protective barrier, preventing water from interacting with the steel surface. These findings demonstrate the beneficial effect of inhibitors in raising the MS surface's hydrophobicity and lowering its corrosion susceptibility.
2.6 UV characterization
The UV spectra of both before and after the MS chip immersed in an acidic solution containing 400 ppm concentration of the plant extract as an inhibitor at 303 K, are shown in Fig. 8. The interaction between the chemical components of the plant and the metal surface can be seen through the UV spectra.36 After immersion, there appears to be a slight redshift in the peak at 273 nm and 364 nm, suggesting that the active compounds of the inhibitor were possibly adsorbed onto the steel surface and changed their electronic configuration. This red shift suggests that the interaction between the inhibitor molecules and the metal surface has possibly shifted, resulting in a lower energy gap, leading to more stable adsorption on the MS surface.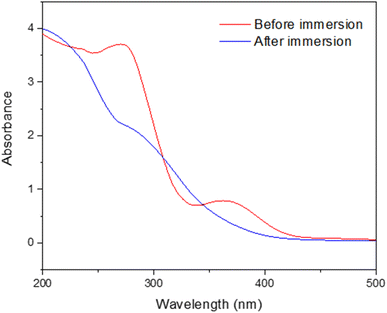 | ||
| Fig. 8 UV spectra of before and after immersion of MS chips in a 1 M H2SO4 solution, with inhibitor at a concentration of 400 ppm at 303 K. | ||
In addition to the shifts in peak positions, the spectra show a broad decrease in absorbance throughout the entire wavelength range, as shown in Fig. 8. The decrease is due to the inhibitor's active species being consumed when they attach to the MS surface forming a barrier that reduces exposure of the MS to the corrosive environment. Reduced absorbance provides evidence to the theory that the inhibitor is effectively adsorbing onto the MS surface, changing its properties, and improving its corrosion resistance as it shows that fewer inhibitor molecules remain in solution.37 Overall, the absorbance reduction and spectral shifts offer convincing proof that the inhibitor interacts with the MS surface, most likely by forming a barrier that alters the surface characteristics and electronic structure of the MS, enhancing its ability to inhibit corrosion.38
2.7. Surface analysis
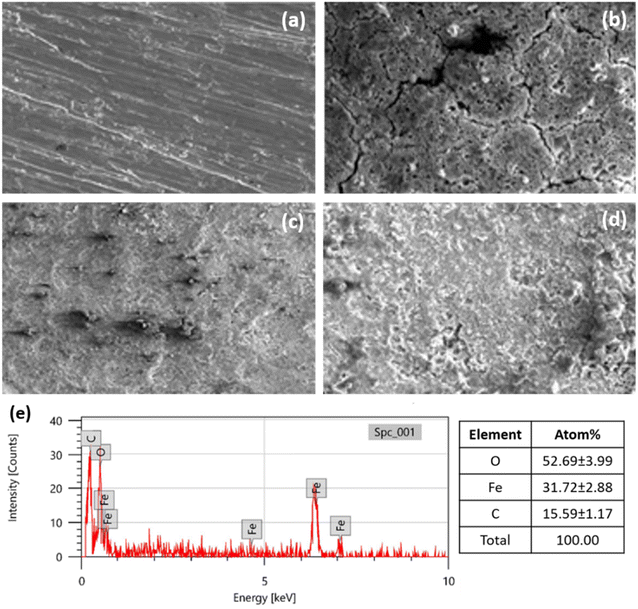
The SEM analysis determines the surface morphology of MS chips under various conditions, as shown in Fig. 9a–e. The images demonstrate the progression of the surface of a polished MS chip changes over time when exposed to acidic conditions, both with and without an inhibitor, over 24 hours at 303 K. The polished fresh MS chip is shown in Fig. 9a, with a clean, well-defined surface that has few imperfections. The original, unprocessed form of the MS chip is indicated by its clean and comparatively flat shape. This polished surface acts as a reference point, displaying the natural texture of the MS before the application of any protective or corrosive coatings.Fig. 9b illustrates the MS chip submerged in a 1 M H2SO4 solution without any inhibitor for 24 hours. The surface of the chip has noticeable rust on it. Large fractures and pits have formed on the surface, along with deep pitting and localized assaults, as shown in Fig. 9b. This corrosion is most likely the result of the aggressive nature of acid reacting with the metal to dissolve the steel and produce imperfections on the surface. The surface degradation indicates that, in the absence of precautions, the steel is extremely vulnerable to corrosion in an acidic environment.
The SEM image of the MS chip is shown in Fig. 9c in an open environment with a coating inhibitor. Comparing the surface morphology to the untreated chip in 1 M H2SO4, there is a noticeable improvement. There are less obvious cracks and holes on the surface, which appear uniform and smooth.39 It demonstrates that the inhibitor has successfully created a barrier that protects the steel from the elements, keeping the metal away from the corrosive substances in the surrounding air.
The SEM image of the MS chip after being submerged in an acidic solution for 24 hours in the presence of the inhibitor, at a concentration of 400 ppm, is shown in Fig. 9d. When comparing this sample to the one without the inhibitor, the surface is noticeably smoother. Although there may still be some small defects on the surface, the general morphology is significantly less diminished. The presence of the inhibitor appears to protect the MS from extreme corrosion, which reduces the formation of cracks and pits that were observable in the untreated sample. This indicates that the inhibitor, at 400 ppm, is extremely effective at limiting corrosion. It certainly performs it by forming a barrier that protects the steel from the harsh chemical reactions in the acidic solution.
The Energy Dispersive Spectroscopy (EDS) analysis for Fig. 9e represents the elemental composition of the MS treated with an inhibitor at a concentration of 400 ppm in 1 M H2SO4 solution after 24 hours of immersion. The detected elements and their respective atomic percentages are as follows: Oxygen (O) at 52.69 ± 3.99%, Iron (Fe) at 31.72 ± 2.88%, and Carbon (C) at 15.59 ± 1.17%. This composition suggests significant adsorption of the inhibitor on the MS, as evidenced by the high oxygen and carbon content, alongside the presence of iron from the substrate.
Overall, the SEM images show that the inhibitor protects MS from acidic environments. The polished surface acts as a reference point, and the corrosion that occurs when the inhibitor is not there shows how severely sulfuric acid damages steel. The images of the steel with the inhibitor, on the other hand, demonstrate a noticeable change in surface morphology, highlighting the inhibitor's efficacy in protecting the surface of metal against corrosion.40
Fig. 10a–d shows images of MS chips in different environments, illustrating how an inhibitor affects the surface of the steel in both acidic and air conditions. Fresh, untreated MS chips with a smooth surface is displayed in Fig. 10a. The inhibitor possesses a protective role in Fig. 10b, where the MS chip coated with it is exposed to open air. The surface of the chip appears more uniform and less sensitive to oxidation. In contrast to the untreated specimen in Fig. 10d, the MS chip submerged in an acidic solution containing 400 ppm of the inhibitor concentration, exhibits a surface that is significantly less damaged in Fig. 10c. The untreated MS chip in the acidic solution shows clear signs of surface deterioration and pitting in addition to noteworthy corrosion, as shown in Fig. 10d. Overall, the images demonstrate that the inhibitor effectively protects the surface of MS in both ambient and acidic conditions.
2.8. Zeta-potential analysis
The zeta potential analysis for mild steel in 1 M H2SO4 was conducted to evaluate surface charge behavior before, during, and after immersion, both with and without the presence of Rumex nepalensis inhibitor at a concentration of 400 ppm, as shown in Fig. 11. Before immersion, the zeta potential of the mild steel was moderately negative (−12.51 mV) with a particle count ranging from 150![[thin space (1/6-em)]](https://www.rsc.org/images/entities/char_2009.gif) 000, reflecting a relatively clean surface with minimal interaction in the acidic environment. During immersion without the inhibitor, the zeta potential decreased significantly to −33.19 mV, accompanied by a sharp increase in particle count (490
000, reflecting a relatively clean surface with minimal interaction in the acidic environment. During immersion without the inhibitor, the zeta potential decreased significantly to −33.19 mV, accompanied by a sharp increase in particle count (490![[thin space (1/6-em)]](https://www.rsc.org/images/entities/char_2009.gif) 000), indicating accelerated corrosion and the formation of negatively charged corrosion products.
000), indicating accelerated corrosion and the formation of negatively charged corrosion products.
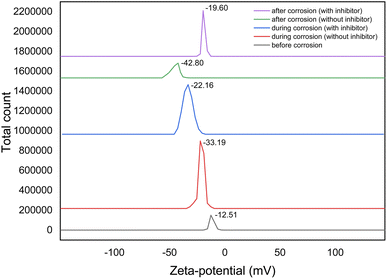 | ||
| Fig. 11 Zeta-potential graph for MS in 1 M H2SO4 solution at 303 K, before, during and after corrosion, both with and without at 400 ppm concentration of Rumex nepalensis inhibitor. | ||
In contrast, with the inhibitor, the zeta potential during immersion was less negative (−22.16 mV), and the particle count was lower (680![[thin space (1/6-em)]](https://www.rsc.org/images/entities/char_2009.gif) 000), suggesting adsorption of the inhibitor onto the mild steel surface, thereby reducing corrosion activity. After prolonged immersion, the zeta potential without the inhibitor dropped further to −42.80 mV, with particle counts exceeding 1
000), suggesting adsorption of the inhibitor onto the mild steel surface, thereby reducing corrosion activity. After prolonged immersion, the zeta potential without the inhibitor dropped further to −42.80 mV, with particle counts exceeding 1![[thin space (1/6-em)]](https://www.rsc.org/images/entities/char_2009.gif) 490
490![[thin space (1/6-em)]](https://www.rsc.org/images/entities/char_2009.gif) 000, highlighting extensive corrosion and aggregation of corrosion products. However, in the presence of Rumex nepalensis, the zeta potential after immersion was moderated (−19.60 mV), with a reduced particle count of 460
000, highlighting extensive corrosion and aggregation of corrosion products. However, in the presence of Rumex nepalensis, the zeta potential after immersion was moderated (−19.60 mV), with a reduced particle count of 460![[thin space (1/6-em)]](https://www.rsc.org/images/entities/char_2009.gif) 000, confirming the formation of a protective inhibitor layer that stabilized the surface and suppressed corrosion effectively. These findings demonstrate the potential of the plant extract to mitigate corrosion in acidic environments through adsorption and surface passivation.
000, confirming the formation of a protective inhibitor layer that stabilized the surface and suppressed corrosion effectively. These findings demonstrate the potential of the plant extract to mitigate corrosion in acidic environments through adsorption and surface passivation.
2.9 . Proposed mechanism
The inhibition efficacy of the inhibitor in preventing MS corrosion in an acidic solution is significantly dependent on its structural characteristics. The various interaction sites between the inhibitor and the MS surface in a 1 M H2SO4 solution at 303 K are shown in Fig. 12. The suggested mechanism for the inhibition of the MS corrosion by Rumex nepalensis extract in an acidic media probably includes the adsorption of active phytochemical compounds found in the extract onto the MS surface.41 Various chemical components, including flavonoids, tannins, alkaloids, and phenolic acids, are present in the herb extract and are known for possessing functional groups including hydroxyl (–OH), carbonyl (C![[double bond, length as m-dash]](https://www.rsc.org/images/entities/char_e001.gif) O), and aromatic rings. By interacting with the metal surface through π-electrons, lone pair electrons, or hydrogen bond creation, these functional groups produce a protective coating.42
O), and aromatic rings. By interacting with the metal surface through π-electrons, lone pair electrons, or hydrogen bond creation, these functional groups produce a protective coating.42
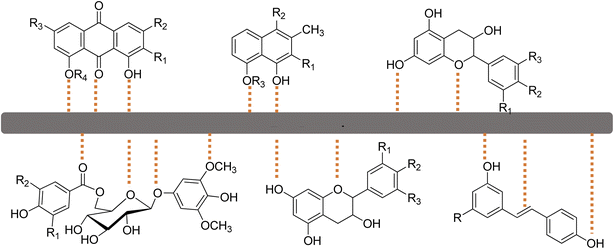 | ||
| Fig. 12 Proposed mechanism of the interactions of the active sites of the plant inhibitor with the MS surface. | ||
The extract molecules bind covalently to the MS surface in acidic environments, blocking active corrosion sites and inhibiting the electrochemical reactions that result in the anodic breakdown of iron and the cathodic hydrogen evolution.43 Both physisorption and chemisorption are probably involved in the adsorption process; the plant extract provides a barrier that reduces the exposure of the MS surface to the corrosive environment, thereby decreasing the rate of corrosion. The plant extract has a high level of inhibitory effectiveness, indicating that it acts as a mixed-type inhibitor that impacts both the anodic and cathodic processes.44
2.10. Comparison of corrosion inhibition efficiency of Rumex nepalensis extract with other natural extracts for mild steel in acidic media
The comparison table highlights the corrosion inhibition efficiency of various plant extracts on MS in different corrosive media. Moringa oleifera exhibits an inhibition efficiency of 75.19% in 0.5 M H2SO4, suggesting moderate protection against corrosion. In contrast, Azadirachta indica shows an impressive 94.11% inhibition efficiency in 1 M HCl, indicating its strong ability to protect steel in acidic environments.Catharanthus roseus, with an inhibition efficiency of 70% in 3.5% NaCl, demonstrates moderate protection, particularly in saline solutions. Zingiber officinale provides 81.30% efficiency in 5 M H2SO4, further emphasizing its effectiveness in highly acidic conditions. Eucalyptus globulus stands out with a remarkable 97% inhibition efficiency in 1 M HCl, showcasing its potential as a highly effective inhibitor in acidic media. Finally, Rumex nepalensis achieves the highest inhibition efficiency of 98.35% in 1 M H2SO4, making it a very promising alternative for corrosion protection in acidic environments. This comparison underscores that while different extracts offer varying levels of inhibition, Rumex nepalensis and Eucalyptus globulus appear to be particularly effective, with Rumex nepalensis showing the highest efficiency among those listed in Table 6.
| S. No. | Plant extract | Inhibition efficiency (%) | Media/material used |
|---|---|---|---|
| 1 | Moringa oleifera | 75.19 | MS/0.5 M H2SO4 (ref. 45) |
| 2 | Azadirachta indica | 94.11 | MS/1 M HCl46 |
| 3 | Catharanthus roseus | 70.00 | MS/3.5% NaCl47 |
| 4 | Zingiber officinale | 81.30 | MS/5 M H2SO4 (ref. 48) |
| 5 | Eucalyptus globulus | 97.00 | MS/1 M HCl49 |
| 6 | Rumex nepalensis | 98.35 | MS/1 M H2SO4 (this work) |
3 Materials and methods
3.1. Materials
The MS plate was collected from local steel industries (Bansal Alloys & Metals Pvt Ltd, Mandi Gobindgarh, Punjab, India) [30° 40′ 58.0872′′ N and 76° 17′ 39.1632′′ E]. The composition percentage by weight of MS is Cu (0.06), Ni (0.09), S (0.057), Cr (0.14), Mo (0.02), Mn (0.51), C (0.18), Si (0.19), P (0.044), V (<0.01) and with the remaining balance as Fe. The 1 M H2SO4 electrolyte solution was prepared with 95% analytical grade sulfuric acid (Loba Chemie) with double distilled water. Rumex nepalensis was collected from the hills of Haripurdhar, Himachal Pradesh, India.3.2. Methodology
3.3. Weight loss calculations
To measure the weight loss of the MS chips for immersion periods of 6, 12, and 24 hours, pre-cleaned and dried MS chips were weighed before and after being immersed with or without the plant extract at various concentrations in 1 M H2SO4. Different grades of SiC emery paper were used for polishing, by successive washing with distilled water and acetone. The samples were then dried in a moisture-free desiccator. After submerging the sample again, it was washed and removed with distilled water and kept in a vacuum oven for half an hour to dry. The weight loss data was calculated by using the following eqn (1)–(3), respectively.
 | (1) |
 | (2) |
 | (3) |
3.4. Electrochemical measurements
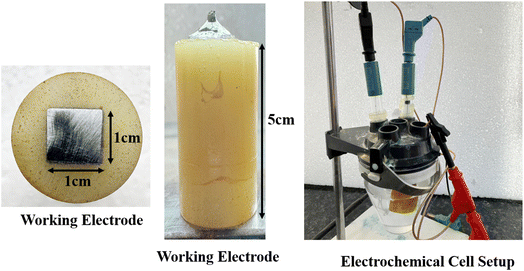
The electrochemical analysis, Electrochemical Impedance Spectroscopy (EIS), and Potentiodynamic Polarization (PDP), of the MS chips were conducted by using an Autolab electrochemical analyzer, (Metrohm, Model PGSTAT 101, Chandigarh University, Gharuan, Punjab, India). The corrosion cell contained three electrodes, i.e., the platinum counter electrode, MS working electrode, and a saturated calomel reference electrode. The EIS measurements were performed over a frequency range of 100 kHz to 0.01 Hz, using a single amplitude perturbation of 5 mV at the open-circuit potential (OCP) and a scan rate of 1 mV s−1. Potentiodynamic polarization curves were obtained at a scan rate of 1 mV s−1, starting from −250 mV relative to the OCP and extending to +250 mV versus the saturated calomel electrode (SCE) and the efficiency was calculated by applying the eqn (4).
 | (4) |
 | (5) |
3.5. Contact angle analysis
The water contact angle analysis was conducted to evaluate the surface properties of the mild steel chips under various conditions. First, the contact angle of the freshly polished chip was measured to establish a baseline for comparison. Subsequently, the analysis was performed on a chip placed in an open environment after applying the inhibitor coating, to observe any changes in hydrophobicity due to environmental exposure. Additionally, the contact angle was measured for chips immersed in 1 M H2SO4 without the inhibitor, to assess the effects of acidic corrosion on the surface. Finally, the contact angle of chips immersed in 1 M H2SO4 with the inhibitor was analyzed, demonstrating the protective effect of the inhibitor in maintaining or improving hydrophobicity under corrosive conditions. The analysis of the contact angle was performed using Ossila contact angle software, and all the calculations were carried out in the triplicate.3.6. UV characterization
To assess the interactions between iron cations (i.e., Fe2+ and Fe3+) and Rumex nepalensis extract inhibitor molecules, the analysis was performed through a UV spectrophotometer (Shimadzu, Model 1900, Chandigarh University, Gharuan, Punjab, India). The analysis was performed both before and after immersion of mild steel chip 1 M H2SO4 solution containing Rumex nepalensis extract at a concentration of 400 ppm. The change in the absorption maximum value (λmax) or changes in absorbance, suggesting the creation of some complexes were discussed in the result and discussion section.3.7. Surface analysis
The scanning electron microscope (JEOL Ltd, Model JSM IT500, Chandigarh University, Gharuan, Punjab, India) technique was used to study the surface morphology during corrosion protection. By using the SEM technique, the images of both MS chips in an acidic medium, with and without plant extract, were captured at different resolutions to carefully examine the surface morphology.3.8. Zeta-potential analysis
The zeta potential measurements for mild steel in 1 M H2SO4, with and without the presence of Rumex nepalensis inhibitor (400 ppm), were performed using a Malvern-Zetasizer Lab blue-ZSU3100 instrument, in UCRD Department, Chandigarh University. Prior to the analysis, mild steel specimens were cleaned according to standard procedures and immersed in the test solution for a defined period to achieve stable interaction with the electrolyte. Measurements were conducted at three stages: before immersion, during immersion at specific intervals, and after prolonged exposure, to monitor the evolution of surface charge and particle dispersion. The plant extract inhibitor solution was prepared by dissolving the extract in 1 M H2SO4 under continuous stirring to ensure homogeneity. The analyzer was calibrated before use, and all measurements were carried out at a controlled temperature of 25 °C. Zeta potential values and particle counts were recorded, with each data point averaged over three runs for accuracy and reproducibility. These data were used to evaluate the adsorption behavior of the inhibitor, the stability of corrosion products, and their impact on corrosion mitigation.4 Conclusion
In conclusion, Rumex nepalensis was found to be a green and efficient corrosion inhibitor for MS in a 1 M H2SO4 solution. The inhibitor was shown to greatly reduce corrosion, particularly at higher concentrations of 300–400 ppm when the highest protection was attained. The studies like weight loss measures, inhibition efficiency, and corrosion rate studies indicated that the polar extract of Rumex nepalensis is 98.35% efficient against the MS used in an acidic solution. The multilayer adsorption of the inhibitor onto the MS surface, which enhances its efficacy with time, is suggested by the Freundlich adsorption isotherm. The capacity of the inhibitor to create a barrier that prevents electrochemical corrosion was further confirmed using electrochemical impedance spectroscopy. The SEM pictures showed smoother surface morphology in the presence of the inhibitor, whereas contact angle and UV-Vis measurements verified less interaction between the MS surface and the corrosive medium. Overall, the Rumex nepalensis extract offers both immediate and sustained protection, making it a promising solution for corrosion control in acidic media.Data availability
All data generated or analyzed during this study are included in this published article.Author contributions
Writing—original draft, A. T.; methodology, H. S. S., M. K.; investigation, F. M. H.; and H. S. S.; writing—review and editing, M. K., N. K., and H. S. S.; supervision, M. K., and H. S. S. All authors have read and agreed to the published version of the manuscript.Conflicts of interest
The authors state that they do not have any conflicts of interest.Acknowledgements
The authors thank the Researchers Supporting Project Number (RSPD2025R729), King Saud University, Riyadh, Saudi Arabia. The authors also thank Chandigarh University, Gharuan, Punjab, India for providing all the basic facilities to carry out this research. All authors confirmed that no AI tool was used to prepare this manuscript.References
- J. P. Gerhardus Koch, J. Varney, N. Thompson, O. Moghissi and M. Gould, International Measures of Prevention, Application, and Economics of Corrosion Technologies Study, 2012 Search PubMed.
- S. A. Al Kiey, M. S. Hasanin and S. Dacrory, J. Mol. Liq., 2021, 338, 116604 CrossRef CAS.
- S. Pletincx, L. L. I. Fockaert, J. M. C. Mol, T. Hauffman and H. Terryn, Nat. Partn., 2019, 3, 1–12 Search PubMed.
- M. Faiz, A. Zahari, K. Awang and H. Hussin, RSC Adv., 2020, 10, 6547–6562 RSC.
- T. Wirtanen, T. Prenzel, J. P. Tessonnier and S. R. Waldvogel, Chem. Rev., 2021, 121, 10241–10270 CrossRef CAS.
- F. Boudjellal, H. B. Ouici, A. Guendouzi, O. Benali and A. Sehmi, J. Mol. Struct., 2020, 1199, 127051 CrossRef CAS.
- N. Betti, A. A. Al-Amiery, W. K. Al-Azzawi and W. N. R. W. Isahak, Sci. Rep., 2023, 13, 1–17 CrossRef PubMed.
- O. D. Agboola and N. U. Benson, Front. Environ. Sci., 2021, 9, 1–27 Search PubMed.
- A. O. Alao, A. P. Popoola, M. O. Dada and O. Sanni, Front. Energy Res., 2023, 10, 1–21 Search PubMed.
- H. Heinz, C. Pramanik, O. Heinz, Y. Ding, R. K. Mishra, D. Marchon, R. J. Flatt, I. Estrela-Lopis, J. Llop, S. Moya and R. F. Ziolo, Surf. Sci. Rep., 2017, 72, 1–58 CrossRef CAS.
- A. Miralrio and A. E. Vázquez, Processes, 2020, 8, 1–27 CrossRef.
- B. E. A. Rani and B. B. J. Basu, Int. J. Corros., 2012, 2012, 1–15 CrossRef.
- S. Marzorati, L. Verotta and S. P. Trasatti, Molecules, 2019, 24, 1–24 Search PubMed.
- A. Zakeri, E. Bahmani and A. S. R. Aghdam, Corros. Commun., 2022, 5, 25–38 CrossRef.
- C. B. Pradeep Kumar and K. N. Mohana, Egypt. J. Pet., 2014, 23, 201–211 CrossRef.
- M. Tourabi, A. Metouekel, A. E. L. Ghouizi, M. Jeddi, G. Nouioura, H. Laaroussi, M. E. Hosen, K. F. Benbrahim, M. Bourhia, A. M. Salamatullah, H. A. Nafidi, G. F. Wondmie, B. Lyoussi and E. Derwich, Sci. Rep., 2023, 13, 1–15 CrossRef PubMed.
- N. A. A. A. A. Khadom and A. N. Abd, Results Chem., 2022, 4, 100668–100679 CrossRef.
- E. A. M. Shahsavari and A. Imani, Mater. Res. Express, 2022, 9, 1–22 Search PubMed.
- A. Y. El-Etre, J. Colloid Interface Sci., 2007, 2, 578–583 CrossRef.
- A. Vasas, O. Orbán-Gyapai and J. Hohmann, J. Ethnopharmacol., 2015, 175, 198–228 CrossRef CAS.
- Y. H. Gonfa, F. Beshah, M. G. Tadesse, A. Bachheti and R. K. Bachheti, Beni-Suef Univ. J. Basic Appl. Sci., 2021, 10, 1–11 CrossRef.
- S. Ch and D. Banji, J. Drugs Med., 2011, 3, 76–88 Search PubMed.
- P. Feduraev, L. Skrypnik, S. Nebreeva, G. Dzhobadze, A. Vatagina, E. Kalinina, A. Pungin, P. Maslennikov, A. Riabova, O. Krol and G. Chupakhina, Antioxidants, 2022, 11, 1–16 CrossRef.
- P. Jain, G. Parkhe and C. Prabhat Jain, Pharma Innovation, 2018, 7, 175–181 CrossRef CAS.
- A. N. Shikov, I. A. Narkevich, E. V. Flisyuk, V. G. Luzhanin and O. N. Pozharitskaya, J. Ethnopharmacol., 2021, 268, 113685–113697 CrossRef CAS PubMed.
- R. S. Sharma, V. Mishra, R. Singh, N. Seth and C. R. Babu, Fitoterapia, 2008, 79, 589–591 CrossRef PubMed.
- K. Wangchuk, J. Anim. Sci. Technol., 2015, 57, 1–5 CrossRef.
- S. Kumar and P. K. Singh, Mater. Today: Proc., 2019, 26, 3442–3448 Search PubMed.
- Y. Liu, M. Curioni and Z. Liu, Electrochim. Acta, 2018, 264, 101–108 CrossRef CAS.
- G. Karthik and M. Sundaravadivelu, Egypt. J. Pet., 2016, 25, 183–191 CrossRef.
- S. A. Xavier Stango and U. Vijayalakshmi, J. Asian Ceram. Soc., 2018, 6, 20–29 CrossRef.
- S. Paramasivam, K. Kulanthai, G. Sadhasivam and R. Subramani, Int. J. Electrochem. Sci., 2016, 11, 3393–3414 CrossRef CAS.
- Z. Aribou, M. Ouakki, F. El Hajri, E. Ech-chihbi, I. Saber, Z. Benzekri, S. Boukhris, M. K. Al-Sadoon, M. Galai, J. Charafeddine and M. E. Touhami, Int. J. Electrochem. Sci., 2024, 19, 1–21 Search PubMed.
- B. G. Yacobi, S. Martin, K. Davis, A. Hudson and M. Hubert, J. Appl. Phys., 2002, 91, 6227–6262 CrossRef CAS.
- T. Mitteramskogler, A. Fuchsluger, R. Ecker, K. Harsanyi, A. Tröls, T. Wilfinger and B. Jakoby, Micro Nano Eng., 2023, 19, 100197–100209 CrossRef CAS.
- S. hao Deng, H. Lu and D. Y. Li, Sci. Rep., 2020, 10, 1–16 CrossRef.
- M. Ghaderi, S. A. Ahmad Ramazani, A. Kordzadeh, M. Mahdavian, E. Alibakhshi and A. Ghaderi, Sci. Rep., 2022, 12, 1–20 CrossRef.
- A. A. Al-Amiery, A. B. Mohamad, A. A. H. Kadhum, L. M. Shaker, W. N. R. W. Isahak and M. S. Takriff, Sci. Rep., 2022, 12, 1–21 CrossRef.
- M. A. Abbas, M. A. Bedair, O. E. El-Azabawy and E. S. Gad, ACS Omega, 2021, 6, 15089–15102 CrossRef CAS PubMed.
- F. Bahremand, T. Shahrabi, B. Ramezanzadeh and S. A. Hosseini, Sci. Rep., 2023, 13, 1–14 CrossRef PubMed.
- M. Alimohammadi, M. Ghaderi, A. Ramazani S.A and M. Mahdavian, Sci. Rep., 2023, 13, 1–16 CrossRef.
- H. B. Oli, J. Thapa Magar, N. Khadka, A. Subedee, D. P. Bhattarai and B. Pant, Electrochem., 2022, 3, 713–727 CrossRef CAS.
- B. R. Holla, R. Mahesh, H. R. Manjunath and V. R. Anjanapura, Heliyon, 2024, 10, 1–20 CrossRef.
- N. Al Otaibi and H. H. Hammud, Molecules, 2021, 26, 1–19 CrossRef.
- M. Farhat, T. Abdullaha, F. Mansour and R. Alsadiq, Acad. J. Basic Appl. Sci., 2022, 4, 1–18 Search PubMed.
- P. Desai, Electron. J., 2022, 1, 1–22 Search PubMed.
- N. Palaniappan, I. Cole, F. Caballero-Briones, S. Manickam, K. R. Justin Thomas and D. Santos, RSC Adv., 2020, 10, 5399–5411 RSC.
- O. Samson Olanrele, J. Femi-Dagunro, E. Andrew Ofudje, M. Algarni, A. A. Al-Ghamdi, R. H. Aldahiri, M. R. Alrahili and A. A. Alsaiari, Heliyon, 2024, 10, e37493 CrossRef CAS.
- D. Azzouni, S. Alaoui Mrani, R. Bertani, M. M. Alanazi, G. En-nabety and M. Taleb, Molecules, 2024, 29, 1–20 CrossRef PubMed.
| This journal is © The Royal Society of Chemistry 2025 |

