 Open Access Article
Effect of oxalic acid treatment on the oxidation efficiency of maize stover cellulose and controllable preparation of nanocellulose†
Weishuai Han‡
 a,
Hui Xu‡a,
Fengqi Qiu‡a,
Jinwei Liua,
Haojie Gua and
Zhenhua Xue*abc
aCollege of Material Science and Art Design, Inner Mongolia Agricultural University, Hohhot, 010018, China. E-mail: x_zhenhua@126.com
bInner Mongolia Key Laboratory for Sand Shrubs Fibrosis and Energy Development and Utilization, China
cNational Forestry Grassland Engineering Technology Research Center for Efficient Development and Utilization of Sandy Shrubs, China
First published on 24th January 2025
Abstract
Corn stover was used as raw material, and purification, oxalic acid treatment, oxidation treatment, and ultrasonic treatment were performed to realize the preparation of corn stover nanocellulose with low energy consumption. The effects of oxalic acid concentration (1 wt%, 2 wt%, 3 wt%, 4 wt%, and 5 wt%) on the purity, morphology, crystalline structure and oxidation efficiency of corn stover cellulose during oxalic acid treatment were investigated. The controllable preparation of corn stover nanocellulose was achieved by changing the parameter conditions of ultrasonic treatment. The optimal oxalic acid treatment conditions at room temperature were determined as follows: oxalic acid concentration of 3 wt% and treatment time of 24 h. Oxidized corn stover cellulose was ultrasonically pulverized at 480 W. The average particle size of cellulose was 78.5 d nm at 80 min, which reached 9.75 d·nm at 120 min. This study realized the controllable preparation of corn stover nanofibrillar cellulose, thus providing a research basis for further improving the high value-added conversion of corn stover.
1 Introduction
Nanocellulose is widely used in various fields because of its biocompatibility, biodegradability, high specific surface area, high surface chemical activity, and high dispersibility of corresponding aqueous suspension. Cotton and hemp crops are the common materials used for the preparation of nanocellulose owing to their ultra-high cellulose content.1 In addition, studies on the preparation of nanocellulose from industrial wastes with high cellulose content, such as bagasse and pulp, have been widely reported.2 Currently, the extraction of cellulose from agricultural waste and its conversion into nanocellulose is a research hotspot,3 as it not only reuses waste resources, but also produces a high value-added product.In the process of preparing nanocellulose with sulfuric acid,4 hydrochloric acid5 and other strong acids, although the preparation efficiency is high, there are disadvantages of easy corrosion of equipment, production of a large amount of waste acid, and reaction residues polluting the environment. Therefore, organic acids are gradually used in the preparation of nanocellulose because of their associated mild reaction conditions, low pollution levels, and their possible recovery via distillation. Chen et al.6 prepared nanocellulose from wood pulp of eucalyptus using high concentration of oxalic acid. Jia et al.7 prepared corresponding nanocellulose from bleached eucalyptus wood pulp, spruce dissolving pulp, and filter paper fibers treated with oxalic acid and explored the differences between them. Xu et al.8 studied the effect of oxalic acid dosage, reaction temperature, and catalyst dosage on nanocellulose morphology, size and thermal stability.
Later, researchers found that combining different treatments could help in the efficient preparation of nanocellulose. Combining organic acid treatment with oxidation treatment can effectively improve the preparation efficiency of cellulose.9 Moreover, combining oxidation treatment with mechanical treatment can allow better dispersion of cellulose solution, thus efficiently preparing nanocellulose.10 However, there are still limitations associated with the use of existing technology to prepare nanocellulose from waste straw: (1) compared with raw materials with high cellulose content, such as cotton, straw exhibits a low cellulose content, and cellulose, lignin and hemicellulose are more tightly bound, which can damage cellulose in the process of treatment, and thus, the yield is not high. (2) Compared with strong acids, organic acids are mild because of the associated mild reaction conditions, which can be used to purify cellulose when treating straw. (3) Purification efficiency is not high when straw is treated. Although the combination of organic acid treatment and oxidation treatment can improve preparation efficiency, the mechanism is not clear. (4) Applying the physical ultrasonic method to the preparation of nanocellulose from corn stover, the equipment uses a large amount of power and consumes a large amount of electrical energy.
Considering the above factors, this paper used four steps to prepare corn stover cellulose: firstly, corn stover cellulose was pre-purified by removing most of the lignin and hemicellulose, and a cellulose content of 76.8% was obtained. Next, cellulose was treated with oxalic acid at different concentrations, followed by oxidation using TEMPO. Finally, cellulose was oxidized using the ultrasonic pulverization method to prepare nanocellulose. The effects of different concentrations of oxalic acid treatment on the purity, surface morphology, crystalline structure and oxidation efficiency of corn stover cellulose were investigated to determine oxalic acid treatment conditions with the highest oxidation efficiency. Moreover, the relationship between the particle size of corn stover cellulose and ultrasonic power and time was investigated by changing ultrasonic parameter conditions to realize the controllable preparation of corn stover nanocellulose.
2 Materials and instruments
2.1 Materials
Corn straw (200 mesh) was obtained from Lianyungang Surui Straw Processing Co., Ltd. Sodium hydroxide (analytically pure), oxalic acid (analytically pure), methylene chloride (analytically pure) were obtained from Fuchen Chemical Reagent Co., Ltd. Sodium chlorite (analytically pure) and TEMPO (analytically pure) were obtained from Shanghai Aladdin Biochemical Science and Technology Co, Ltd. Glacial acetic acid (analytically pure) was obtained from Xilong Chemical Co. Sodium bicarbonate (analytically pure) was obtained from Sinopharm Group Chemical Reagent Co., Ltd. Sodium bromide (analytically pure) was obtained from Sheng'ao Chemical Reagent Co.2.2 Instruments
Experimental instruments: an electrothermal constant temperature water bath (JC-H-H-S24; Jinan Jingcheng Experimental Instrument Co. Ltd), a circulating water multipurpose vacuum pump (SHB-III; Yuhua Instrument Co., Ltd), and an ultrasonic cell pulverizer (SCIENTZ-IID; Xinzhi Biological Co).Testing instruments: a conductivity meter (DDS-11A; Hangzhou Leimagnet Analytical Instrument Factory), a scanning electron microscope (Phenom Pro Generation 5; Feiner Scientific Instrument Co. Ltd), a Fourier infrared spectrometer (INVENIOS; Bruker Ltd, Germany); an X-ray diffractometer (TD-3700; Dandong Tonda Science and Technology Co), and a spectrophotometer (PE Lambda 850; PerkinElmer Co).
3 Methods
3.1 Preparation method
The cellulose, lignin and hemicellulose contents of the purified treated corn stover powder were 76.8%, 11.4% and 11.5%, respectively.
3.2 Characterization methods
| T = M1/M2 × 100%, | (1) |
The yield of cellulose after oxalic acid treatment was determined by employing the weighing method, and the yield of cellulose was calculated using eqn (2):
| Y = W2/W1 × 100%, | (2) |
Crystallinity indices were correlated via peak fitting, peak area or peak deconvolution methods (1977); Gaussian fitting of the diffraction images using Origin software; and calculation of the characteristic peak areas at the crystalline surfaces of (1–10), (110), (102/012), (200), and (004) using eqn (3):
 | (3) |
Parameters related to the three directions of the crystal cell were calculated using UnitCell software.
| HCOOH = C × (V2 − V1) × 10−3/w, | (4) |
The yield of oxidized cellulose was determined using the weighing method, and the yield of oxidized cellulose was calculated using eqn (5):
| Y = W2/W1 × 100%, | (5) |
4 Results and discussion
4.1 Analysis of the effect of different oxalic acid concentration treatments on corn stover cellulose
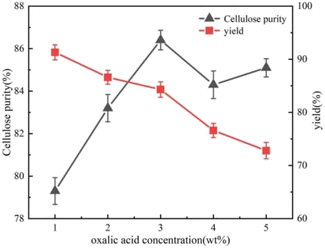
Fig. 1 shows the plots of cellulose purity and yield after treatment with different concentrations of oxalic acid (1 wt%, 2 wt%, 3 wt%, 4 wt% and 5 wt%). Cellulose purity before oxalic acid treatment was 76.8%. After treatment with oxalic acid at different concentrations, cellulose purity improved. With an increase in the concentration of oxalic acid treatment, cellulose purity showed a general increasing trend, which then slowly decreased. When the concentration of oxalic acid treatment reached 3 wt%, cellulose purity reached the highest, 86.4%. This trend also indicates that oxalic acid has a further purification effect on corn stover cellulose, which can dissolve a certain amount of lignin and hemicellulose, and this conclusion is consistent with the results of other researchers.11 With a continuous increase in the concentration of oxalic acid treatment, not only lignin and hemicellulose were degraded, but it also had a destructive effect on cellulose, which promoted the hydrolysis the cellulose.12 The destructive effect of oxalic acid on cellulose was gradually dominant, resulting in the reduction of the overall purity of cellulose. In addition, it can be found that with an increase in oxalic acid concentration, the yield demonstrated a trend of slowly decreasing first and then rapidly decreasing. This indicates that oxalic acid at low concentrations mainly degraded some of the lignin and hemicellulose remaining in the cellulose,13 while oxalic acid at high concentration hydrolyzed the cellulose, which caused a large amount of quality loss.4.2 Effect of oxalic acid treatment on cellulose surface morphology
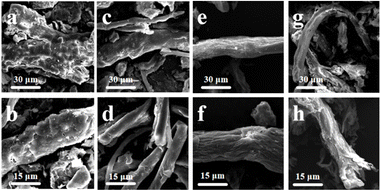
By analysing the cellulose content in corn stover, it was found that oxalic acid treatment degraded lignin, hemicellulose as well as cellulose in the stover fibers to a certain extent, which led to an increase and then a decrease in cellulose purity. To further elucidate the process of oxalic acid treatment on straw fibers, scanning electron microscopy was used to observe the morphology of straw fibers after oxalic acid treatment.Fig. 2a and b depict straw fibers without oxalic acid treatment. They show that the cellulose without oxalic acid treatment is still in the state of fiber bundles wrapped around each other and agglomerated. Straw fiber bundles treated with 1 wt% oxalic acid solution gradually started to depolymerize and slowly peeled off from the agglomerated state, and the surface of the peeled fibers was smoother. The reason for this phenomenon is that the degradation of hemicellulose, lignin and other components occurs at this concentration. With the dissolution of lignin, the supporting properties of the fiber bundles decreased, and the original surface morphology could not be maintained. When the concentration of oxalic acid increased to 3 wt%, the surface of the separated fibers gradually roughened and wrinkled, showing an uneven shape. This is because as the concentration of oxalic acid increases, oxalic acid on the cellulose itself erodes and destruction of the effect began to appear; however, at this time, the integrity of the fiber as a whole is not damaged. When the concentration of oxalic acid continues to increase to 5 wt%, the erosion of oxalic acid on the surface of the fiber gradually penetrates the interior, causing the fiber to fracture and break (Henschen et al. 2019),14 and the overall structure of the fiber is damaged. The reason for this situation is that the destructive effect on cellulose dominates when treated with high concentrations of oxalic acid. Moreover, a part of the cellulose is hydrolyzed, leading to the breakage of fiber bundles and the reduction of the overall size. This result is consistent with the results in Fig. 1 where the cellulose yield was drastically reduced.
4.3 Effect of oxalic acid pretreatment on the crystalline structure of cellulose
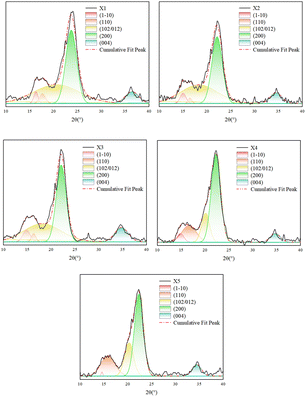
The cellulose treated with different oxalic acid concentrations ×1 (1 wt%), ×2 (2 wt%), ×3 (3 wt%), ×4 (4 wt%), and ×5 (5 wt%) was tested using X-ray diffraction (XRD), and the results of Gaussian fitting are shown in Fig. 3. The computed (1–10), (110), (102/012), (200), and (004) characteristic peak areas at the crystalline surface and cell dimensions (a–c) are shown in Table 1.| Number | ×1 | ×2 | ×3 | ×4 | ×5 |
|---|---|---|---|---|---|
| A(1–10) | 39.03 | 46.08 | 65.8 | 44.95 | 5.49 |
| A(110) | 45.94 | 15.48 | 28.81 | 189.16 | 208.33 |
| A(102/012) | 669.59 | 533.95 | 519.37 | 181.02 | 216.41 |
| A(200) | 619.13 | 544.22 | 587.22 | 636.43 | 527.31 |
| A(004) | 122.20 | 97.54 | 148.39 | 68.65 | 76.86 |
| CI | 55.24 | 56.84 | 61.52 | 83.84 | 79.08 |
| a | 7.66 | 8.46 | 8.54 | 8.06 | 8.08 |
| b | 7.26 | 7.91 | 8.04 | 8.30 | 7.93 |
| c | 9.32 | 10.08 | 10.11 | 9.68 | 9.65 |
As can be seen in Fig. 3, ×1, ×2, and ×3 showed distinct characteristic peaks at (200), (004), (1–10), and (110), and a distinct broad peak at (102/012), which can be attributed to cellulose type Iβ according to the existing research criteria. However, the (1–10) and (110) peaks of ×4 and ×5 gradually overlapped, the peak at (102/012) shifted to the right and the width of the half-peak significantly reduced, suggesting that there is a small amount of cellulose Iβ type to cellulose II type transition.15–17 Currently, many methods are available for the measurement of cellulose crystallinity (Segal et al., 1959; Thygesen et al., 2005),18,19 as well as for the improvement of20,21 and comparative evaluation of22 fibers. However, the characteristic peaks of ×1, ×2, ×3, and ×4, ×5 at (102/012) differed greatly in the present experiments. Therefore, the half-peak-width method was not considered for the calculation of the degree of crystallinity, and the peak-area method was used for the calculation.
As can be seen from Table 1, when the concentration of oxalic acid treatment was increased from 1 wt% to 3 wt%, the cellulose crystallinity index, grain size, and cellulose crystallinity increased, primarily because non-cellulosic components such as hemicellulose and lignin were degraded and dissolved after the oxalic acid treatment, and therefore, more cellulose was exposed. When the treatment concentration was 4 wt%, the cellulose crystallinity index reached 83.84%, grain sizes in the a and c directions became smaller, and the peak width of the (102/012) crystalline surface gradually became narrower. Moreover, the peak area was greatly reduced, which may be due to the fact that with the gradual exposure of the cellulose, oxalic acid affected the amorphous and crystalline regions of the cellulose at the same time and the amorphous region was more susceptible to hydrolysis and destruction compared with the crystalline region,23 which resulted in an additional increase in the crystallinity index of cellulose. When the concentration of oxalic acid treatment continued to increase to 5 wt%, the characteristic peaks at the interface of (1–10) and (110) gradually overlapped, and the b-direction grain size became smaller.24 Furthermore, the cellulose crystallinity index appeared to decrease to some extent, which was attributed to the increasing disruptive effect on the crystalline zone during oxalic acid treatment at high concentrations,25 which led to the dissociation of some of the crystalline zones after wetting up and thus the transformation into non-crystalline zones.
4.4 Effect of oxalic acid treatment on the carboxyl group content and yield of oxidized cellulose
The effect of oxalic acid treatment concentration on cellulose oxidation efficiency was investigated. Fig. 4 shows the carboxyl group content and yield of oxidized cellulose after treatment with different oxalic acid concentrations (1 wt%, 2 wt%, 3 wt%, 4 wt%, and 5 wt%). As can be seen from Fig. 4, the carboxyl group content in oxidized cellulose increased and then decreased with an increase in oxalic acid treatment concentration. Table 1 shows that when the concentration of oxalic acid treatment was low (1 wt%), oxalic acid first reacted with the residual lignin and hemicellulose in the cellulose, causing the non-cellulosic components to dissolve. As the concentration of oxalic acid treatment increased to 3 wt%, the effect of oxalic acid on the non-cellulosic components became stronger, thus exposing more cellulose and more relevant binding sites on cellulose that can be oxidized, resulting in the carboxylate content of the oxidized cellulose to greatly increase,26 and the carboxylate content reached a maximum value of 1.66 mmol g−1. When the concentration of oxalic acid increased to 4 wt%, the hydrolysis of the amorphous zone of cellulose by oxalic acid began, resulting in a decrease in the binding sites on cellulose that could be oxidized,27 and thus a decrease in the carboxyl group content. When the concentration of oxalic acid increases to 5% by weight, the destructive effect of oxalic acid on the cellulose crystallization zone is enhanced, leading to the transformation of the crystallization zone into an amorphous zone. Moreover, the binding sites on cellulose that could be oxidized increased to some extent, resulting in a corresponding increase in the carboxyl group content. In addition, the yield of cellulose after oxidation decreased with an increase in the concentration of oxalic acid treatment, but the overall yield was high, between 80% and 90%, which provides the possibility of achieving low-cost and large-volume preparation of nanocellulose in industry.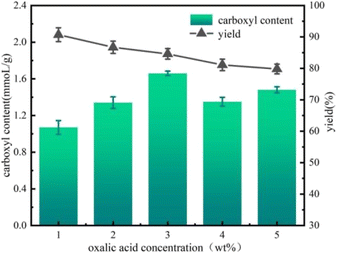 | ||
| Fig. 4 Effect of oxalic acid treatment concentration on the carboxyl content of cellulose and its yield. | ||
4.5 Analysis of oxidized cellulose functional groups of corn stover
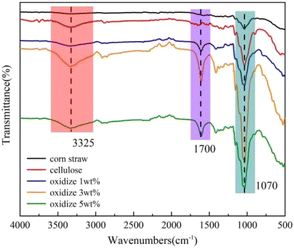
The infrared spectra of raw corn stover, cellulose without oxalic acid treatment, and oxidized cellulose after treatment with different concentrations of the acid (1 wt%, 3 wt%, and 5 wt%) are shown in Fig. 5. In the IR spectra of corn stover and maize stover, it can be seen that cellulose has a strong absorption peak near 1070 cm−1 and between 1000 cm−1 and 1200 cm−1 compared to stover because of the –C–O–C group stretching vibration,28 which is a characteristic peak of cellulose. In addition, cellulose exhibits a broader absorption peak near 3325 cm−1 and between 3200 cm−1 and 3600 cm−1),29 which is a characteristic peak of cellulose due to –OH stretching vibration. From the spectra of oxidized cellulose treated with different concentrations (1 wt%, 3 wt%, and 5 wt%), it can be seen that they all have characteristic peaks between 1000 cm−1 and 1200 cm−1 and between 3200 cm−1 and 3600 cm−1, and the peak strength of the characteristic peaks is stronger than that of the cellulose peaks, which is an evidence to illustrate that the purity of the oxidized cellulose improves to some extent. This shows that the purity of cellulose after oxidation treatment improves to a certain extent. However, unlike the cellulose spectra, the oxidized cellulose spectra showed the characteristic absorption peak of –C![[double bond, length as m-dash]](https://www.rsc.org/images/entities/char_e001.gif) O– in –COOH near 1700 cm−1,29 also indicating that the cellulose has been oxidized by TEMPO to introduce carboxyl groups into the cellulose macromolecular chain. The presence of a broad peak near 3325 cm−1 in the oxidized cellulose spectrum is also interesting as it indicates that TEMPO oxidation does not oxidize all hydroxyl groups on the cellulose but rather oxidizes the primary hydroxyl group on C6, which is the most active group in the cellulose molecular chain, to the carboxyl group.30 In addition, Fig. 5 shows that the cellulose oxidized after 3 wt% oxalic acid treatment depicts the largest peak intensity at 1700 cm−1, which is consistent with the results of the previous carboxyl group content plot, where both too low and too high concentration treatments resulted in a decrease in the efficiency of cellulose oxidation.
O– in –COOH near 1700 cm−1,29 also indicating that the cellulose has been oxidized by TEMPO to introduce carboxyl groups into the cellulose macromolecular chain. The presence of a broad peak near 3325 cm−1 in the oxidized cellulose spectrum is also interesting as it indicates that TEMPO oxidation does not oxidize all hydroxyl groups on the cellulose but rather oxidizes the primary hydroxyl group on C6, which is the most active group in the cellulose molecular chain, to the carboxyl group.30 In addition, Fig. 5 shows that the cellulose oxidized after 3 wt% oxalic acid treatment depicts the largest peak intensity at 1700 cm−1, which is consistent with the results of the previous carboxyl group content plot, where both too low and too high concentration treatments resulted in a decrease in the efficiency of cellulose oxidation.
4.6 Nanocellulose particle size analysis
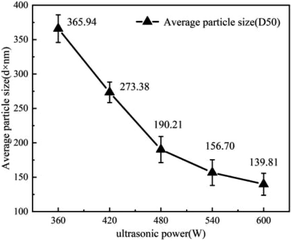
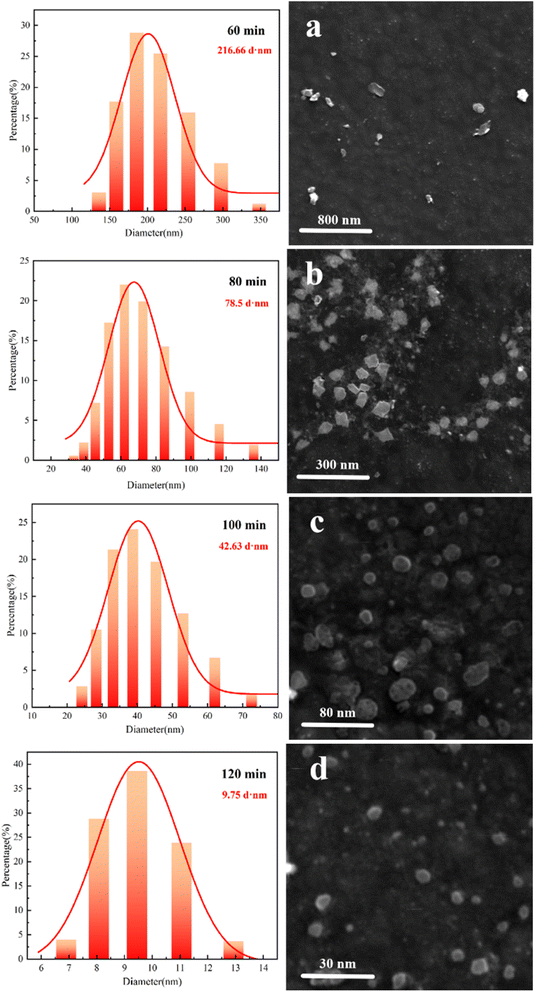
Cellulose treated and oxidized with 3 wt% oxalic acid was selected to be configured as 0.05 wt% aqueous solution for physical sonication. Fig. 6 shows the variation in the average particle size of cellulose after 60 min of ultrasonication under ultrasonic powers of 360 W, 420 W, 480 W, 540 W and 600 W (the average particle size is uniformly expressed as D50). As can be seen in Fig. 6, the particle size decreased by 92.56 d·nm, 83.71 d·nm, 33.51 d·nm, and 16.89 d·nm when the power was increased from 360 W to 600 W. This was attributed to the fact that oxalic acid treatment increased the oxidation efficiency of cellulose and further disrupted inter- and intramolecular hydrogen bonding, thus reducing the hydrogen bonding energy.31 Thus, the intermolecular bonds of cellulose could be broken more effectively when the power was around 480 W, which reduced the average particle size of cellulose to less than 200 d·nm. This also demonstrates that oxalic acid treatment prior to oxidation treatment enables the preparation of corn stover cellulose for nanosizing at low power (480 W).Fig. 7 shows the average cellulose particle size distribution plots and SEM images obtained at a power of 480 W and different sonication times. From the comparative analysis in Fig. 7, it can be seen that the average particle sizes reached 216.66 d·nm, 78.5 d·nm, 42.63 d·nm and 9.75 d·nm when the ultrasonic time was 60 min, 80 min, 100 min and 120 min, respectively, and the range of particle size intervals became gradually narrower. This is due to the fact that when the power reaches a point where the intermolecular bonding of cellulose can be sufficiently destroyed, the average particle size of cellulose decreases more significantly with an increase in ultrasonication time. After oxalic acid treatment of corn stover cellulose at an ultrasonic power of 480 W, preparation of corn stover nanocellulose with an average particle size of <100 d·nm took 80 min; at an ultrasonic power of 480 W, the preparation of corn stover nanocellulose with an average particle size of <10 d·nm required 120 min. This confirms that the combination of oxalic acid treatment, oxidation treatment, and ultrasonic treatment can realize the preparation of corn stover nanocellulose with different particle sizes at room temperature and normal pressure. Moreover, it is safe, environmentally friendly, and consumed low power during the whole preparation process.
5 Conclusions
The effect of oxalic acid treatment on corn stover cellulose varies with the concentration of the acid. When the concentration of oxalic acid is less than 3 wt%, lignin and hemicellulose are mainly dissolved. The support performance of fiber bundle decreases, and gradually decomposes into a single fiber bundle. The purity of cellulose is improved, and the crystallinity is increased. By increasing the treatment concentration to 4 wt%, oxalic acid produces a certain destructive effect in the crystalline and amorphous zones of cellulose: non-crystalline zone hydrolysis, crystalline zone dissociation into the non-crystalline zone, and the degree of destruction of the non-crystalline zone at this time is much larger than the degree of dissociation of the crystalline zone such that the degree of crystallinity of cellulose increases again. When the processing concentration is further increased to 5 wt%, oxalic acid on the cellulose crystalline zone and non-crystalline zone have a more obvious destructive effect. Moreover, cellulose crystallinity decreased and the whole fiber bundle gradually breaks, losing its wholeness.The oxidation efficiency of cellulose is related to the crystallinity of cellulose, and the C6 in the amorphous zone is more easily oxidized compared to that in the crystalline zone of cellulose. The highest oxidation efficiency was achieved when oxidation was carried out after 3 wt% oxalic acid treatment, and the carboxyl group content reached 1.66 mmol L−1 g−1. Ultrasonic pulverization was then performed at 480 W. The average particle size of cellulose at 80 min was 78.5 d·nm, and the average particle size at 120 min reached 9.75 d·nm. The combination of oxalic acid treatment, oxidation treatment and ultrasonic treatment not only enabled the preparation of cellulose nanoparticles at low power, but also helped achieve the controllable preparation of the particle size of cellulose nanoparticles according to corn stover nanoparticles by changing the ultrasonication time.
Data availability
Data can be requested from the corresponding author.Author contributions
Weishuai Han: writing – original draft and review, data curation, software, and methodology. Hui Xu: formal analysis and validation. Fengqi Qiu: writing – review, visualization, and conceptualization. Jinwei Liu: investigation, data curation, and supervision. Haojie Gu: methodology and validation. Zhenhua Xue: writing – review, funding acquisition, and project administration.Conflicts of interest
There are no conflicts to declare.References
- Z. Gling, J. V. Edwards and Z. Guo, Cellulose, 2019, 26, 861–876 CrossRef.
- Q. Yu, P. Tiantian and H. HE, Cellulose, 2023, 30, 9379–9390 CrossRef.
- S. R. D. Petroudy, S. A. Kahagh and E. Vatankhan, Carbohydr. Polym., 2021, 251, 117087 CrossRef PubMed.
- A. Y. Melikoglu, S. E. Bilek and S. Cesur, Carbohydr. Polym., 2019, 215, 330–337 CrossRef CAS PubMed.
- N. Hastuti, K. Kanomata and T. Kitaoka, J. Polym. Environ., 2018, 26, 3698–3709 CrossRef CAS.
- L. Chen, J. Y. Zhu and C. Baez, Green Chem., 2016, 18, 3835–3843 RSC.
- C. Jia, L. H. Chen and Z. Q. Shao, Cellulose, 2017, 24, 2483–2498 CrossRef CAS.
- W. Y. Xu, H. Grenman and J. Liu, ChemNanoMat, 2017, 3, 109–119 CrossRef CAS.
- M. Xu, H. Q. Dai and X. Sun, Bioresources, 2012, 7, 1633–1642 Search PubMed.
- S. P. Mishra, A.-S. Manent and B. Chabot, J. Wood Chem. Technol., 2012, 32, 137–148 CrossRef CAS.
- X. Zhao, K. Cheng and D. Liu, Appl. Microbiol. Biotechnol., 2009, 82, 815–827 CrossRef CAS PubMed.
- J. Jiang, Y. Zhu and S. Zargar, Ind. Crops Prod., 2021, 173, 114148 CrossRef CAS.
- L. F. Zambrano-Mite, Y. Villasana and M. L. Bejarano, Heliyon, 2023, 9(6), e17258 CrossRef CAS PubMed.
- J. Henschen, D. Li and M. Ek, Carbohydr. Polym., 2019, 213, 208–216 CrossRef CAS PubMed.
- A. D. French, Cellulose, 2014, 21, 885–896 CrossRef CAS.
- A. D. French, Cellulose, 2020, 27, 5445–5448 CrossRef.
- A. D. French, BioRes, 2022, 17, 5557–5561 CAS.
- L. Segal, J. J. Creely, A. E. Martin and C. M. Conrad, Text. Res. J., 1959, 29, 786–794 CrossRef CAS.
- A. Thygesen, J. Oddershede and H. Lilholt, Cellulose, 2005, 12, 563–576 CrossRef CAS.
- X. Ju, M. Bowden, E. E. Brown and X. Zhang, Carbohydr. Polym., 2015, 123, 476–481 CrossRef CAS PubMed.
- W. Yao, Y. Weng and J. M. Catchmark, Cellulose, 2020, 27, 5563–5579 CrossRef CAS.
- K. S. Salem, N. K. Kasera and M. A. Rahman, Chem. Soc. Rev., 2023, 52, 6417–6446 RSC.
- R. Sindhu, P. Binod and K. Satyanagalakshmi, Appl. Biochem. Biotechnol., 2010, 162, 2313–2323 CrossRef CAS PubMed.
- A. D. French and C. M. Santiago, Cellulose, 2013, 20, 583–588 CrossRef CAS.
- L.-Q. Jin, N. Zhao and Z.-Q. Liu, Bioprocess Biosyst. Eng., 2018, 41, 57–64 CrossRef CAS PubMed.
- D. Li, J. Henschen and M. Ek, Green Chem., 2017, 19, 5564–5567 RSC.
- Y. Qian, Z. Qin and N.-M. Vu, BioResources, 7, 4952–4964 Search PubMed.
- R. A. Ilyas, S. Sapuan, M. Ishak and E. S. Zainudin, BioResources, 2017, 12, 8734–8754 CAS.
- A. F. Lourenço, J. A. F. Gamelas and T. Nunes, Cellulose, 2017, 24, 349–362 CrossRef.
- Z. Tang, W. Li and X. Lin, Polymers, 2017, 9, 421 CrossRef PubMed.
- Z. Wei, D. Wang and Y. Chen, Cellulose, 2022, 29, 3675–3687 CrossRef CAS.
Footnotes |
| † Electronic supplementary information (ESI) available. See DOI: https://doi.org/10.1039/d4ra08079c |
| ‡ These authors contributed equally to this work and should be considered co-first authors. |
| This journal is © The Royal Society of Chemistry 2025 |

