 Open Access Article
Creative Commons Attribution 3.0 Unported Licence
Archaerhodopsin 3 is an ideal template for the engineering of highly fluorescent optogenetic reporters†
Krystyna
Herasymenko‡
 a,
Danushka
Walisinghe‡
 b,
Masae
Konno‡
 c,
Leonardo
Barneschi
d,
Isabelle
de Waele
e,
Michel
Sliwa
ef,
Keiichi
Inoue
 *c,
Massimo
Olivucci
 *bd and
Stefan
Haacke
 *a
*a
aUniversity of Strasbourg, CNRS, IPCMS, 23 Rue du Loess, 67034 Strasbourg, France. E-mail: stefan.haacke@ipcms.unistra.fr
bDepartment of Chemistry, Bowling Green State University, Bowling Green, OH 43403, USA. E-mail: molivuc@bgsu.edu
cThe Institute for Solid State Physics, University of Tokyo 5-1-5, Kashiwano-ha, Kashiwa, Chiba 277-8581, Japan. E-mail: inoue@issp.u-tokyo.ac.jp
dDipartimento di Biotecnologie, Chimica e Farmacia, Università di Siena, I-53100 Siena, Italy
eLASIRE, Université de Lille, CNRS, 59000, Lille, France
fLOB, CNRS, INSERM, École Polytechnique, Inst. Polytechnique de Paris, 91120 Palaiseau, France
First published on 18th November 2024
Abstract
Archaerhodopsin-3 (AR-3) variants stand out among other rhodopsins in that they display a weak, but voltage-sensitive, near-infrared fluorescence emission. This has led to their application in optogenetics both in cell cultures and small animals. However, in the context of improving the fluorescence characteristics of the next generation of AR-3 reporters, an understanding of their ultrafast light-response in light-adapted conditions, is mandatory. To this end, we present a combined experimental and computational investigation of the excited state dynamics and quantum yields of AR-3 and its DETC and Arch-5 variants. The latter always display a mixture of all-trans/15-anti and 13-cis/15-syn isomers, which leads to a bi-exponential excited state decay. The isomerisation quantum yield is reduced more than 20 times as compared to WT AR-3 and proves that the steady-state fluorescence is induced by a single absorption photon event. In wild-type AR-3, we show that a 300 fs, barrier-less and vibrationally coherent isomerization is driven by an unusual covalent electronic character of its all-trans retinal chromophore leading to a metastable twisted diradical (TIDIR), in clear contrast to the standard charge-transfer scenario established for other microbial rhodopsins. We discuss how the presence of TIDIR makes AR-3 an ideal candidate for the design of variants with a one-photon induced fluorescence possibly reaching the emission quantum yield of the top natural emitter neorhodopsin (NeoR).
1 Introduction
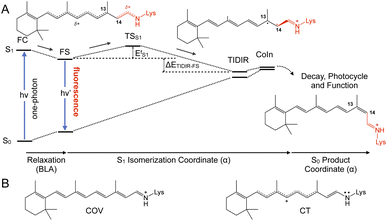
In spite of its tiny fluorescence quantum yield (Φf), archaerhodopsin-3 (AR-3) from the halobacterium Halorubrum sodomense, has been successfully used as fluorescent genetically encoded voltage indicator (GEVIs), thus enabling the visualization of neuronal activity with spatiotemporal precision.1–4 To enhance the relatively low Φf of AR-3 and expand its applicability as GEVI, several AR-3 variants were designed over the past years by screening libraries with randomly mutated AR-3.5–8 However, the highest Φf reported for the seven-fold mutated ARCH-7 is only 1.2%,5 still much lower than the ca. 20% value recently found for the exceptional naturally fluorescent neorhodopsin (NeoR).9,10 There is therefore a need to understand if AR-3 can be engineered to generate variants approaching or overcoming, the NeoR limit or if, alternatively, there are fundamental reasons why this is not possible.A first step towards an understanding of AR-3 was achieved by some of us via a theoretical/computational study of the electronic structure of the first excited state (S1) of its retinal protonated Schiff base (RPSB) chromophore (and fluorophore).11 A schematic representation of the established fluorescence mechanism in AR-3 mutants is given in Fig. 1. A potential energy surface (PES) barrier along the S1 isomerization path of RPSB was found to control the lifetime of the fluorescent state (FS) and prevent its efficient decay into the region of an S1/S0 conical intersection (CoIn). By computing the height of the barrier  for different AR-3 mutants, a correlation was established between barrier height and mutation-dependent Φf.11 This result indicated that: (i) the higher fluorescence of randomly engineered variants is due to a 1-photon excitation process that is ineffective in WT AR-3 (ref. 12 and 13) and (ii) the increase in 1-photon Φf correlates with the stability (ETIDIR-FS) of an unusual S1 twisted bi-radical (TIDIR) of RPSB displaying a covalent (COV) electronic character, in stark contrast to the dominant charge transfer (CT) character of the S1 state in other microbial rhodopsins.14–19 Remarkably, in a more recent computational study the same mechanism was shown to be responsible for the record Φf of NeoR.10,20
Two central questions remain to be answered to establish WT AR-3 as a suitable starting point for fluorescent GEVI engineering. The first is whether the transient TIDIR intermediate is also a characteristic of WT AR-3 in spite of a substantial absence of 1-photon fluorescence in this species (WT AR-3 fluorescence originates from a complex 3-photon process).12,13 The second is whether it is possible to provide direct or indirect experimental evidence for the existence of TIDIR. Experimental studies on the fluorescence lifetimes of QuasAr1, QuasAr2 and Archon1 and its mutants were recently reported,21–23 confirming that the fluorescence is induced by a 1-photon process. Importantly, in contrast with the fact that light-adapted (LA) WT AR-3 contains a single all-trans chromophore isomer, the chromophore of the variants mentioned above was found to correspond to a mixture of all-trans and 13-cis RPSBs.22,23 For Archon1, it was also argued that the trans-membrane voltage acts on the ground isomer composition, and hence on the Φf.22
In the present paper, we address the two questions above via a combination of spectroscopic and non-adiabatic molecular dynamics studies. Experimentally, we study the transient spectroscopy and photoisomerization efficiency of WT AR-3 and, additionally, of two specific AR-3 mutants: the double mutant DETC (D95E, T99C) and the five-fold mutant ARCH-5 (V59A, P60L, D95E, T99C, P196S) initially reported by McIsaac et al.5 For WT AR-3 at pH6, the excited state lifetimes (τS1)and isomerization quantum yield (Φiso) were measured for the first time, providing indirect evidence for an excited state barrier  induced by the TIDIR. Computationally, we focus on the simulation of the photoinduced dynamics of the WT AR-3 using a set of 200 quantum-classical trajectories. The results consistently support the existence of a TIDIR intermediate indicating that the mechanism illustrated in Fig. 1 is general and valid for WT AR-3, its variants as well as for NeoR. Accordingly, one concludes that the problem of finding highly fluorescent AR-3 variants, namely by increasing the average excited state lifetime 〈τ〉 of the system, can be solved by finding mutations that sufficiently destabilize TIDIR with respect to FS. This conclusion is indirectly supported by the spectroscopic data of the two AR-3 mutants, as we report that the 〈τ〉 dramatically increases to 29 and 66 ps for DETC and ARCH-5, respectively, and that the Φiso is reduced by more than 20 times.
2 Experimental results and discussion
2.1 Retinal configuration analysis in dark- and light-adapted proteins determined by HPLC
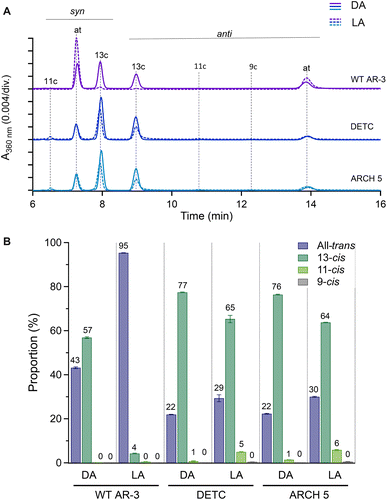
High-performance liquid chromatography (HPLC) analysis was used to investigate the isomeric configurations of the RPSB in light- and dark-adapted forms of WT AR-3 and the two mutants (vide supra). The results are given in Fig. 2. For the light-adaptation procedure, details are given in Fig. S8† together with the common associated red-shifts of absorption spectra, indicating accumulation of all-trans RPSB. In all proteins, the retinal primarily existed in all-trans/15-syn (AT) and 13-cis/15-anti (13-C) forms. In the dark-adapted state, 43 and 57% of WT AR-3 had AT and 13-C retinal, respectively, whereas 95% of the chromophore was in the AT form in the light-adapted state like in bR.24 For DETC and ARCH-5, the dark-adapted state contained ∼80% of the retinal in the 13-C form. Upon light adaptation, although a slight increase in the AT form was observed, but the 13-C remains in majority, accounting for ∼63% and ∼65% of the retinal in DETC and ARCH-5, respectively.2.2 Raman spectroscopy of light-adapted proteins
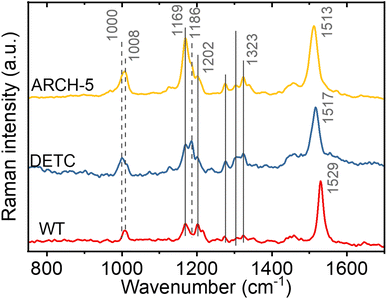
To investigate the retinal isomer composition in the LA WT AR-3, DETC and ARCH-5 Fourier transform Raman spectroscopy was used. Light adaptation was performed with the same protocol as for the HPLC experiments above (Fig. S8†). Fig. 3 presents the obtained Raman spectra for each of the proteins. For the fingerprint region (C–C single bond stretching) we can see that the WT has predominantly all-trans configuration of the retinal chromophore (1169 cm−1 and 1202 cm−1 bands).25 On the other hand, in DETC, a peak at 1186 cm−1, previously assigned to the 13-cis, 15-syn configuration,25,26 is observed. In ARCH-5, both peaks are unresolved, which could indicate a slight red-shift of the 13-cis-related vibration in this mutant. Moreover, in the methyl group rocking region around 1000 cm−1, WT and ARCH-5 display a single peak at 1008 cm−1, while DETC shows an additional peak at 1000 cm−1, which could also be a sign of the existence of two isomers. However, in the hydrogen-out-of-plane (HOOP) region around 800 cm−1 that was previously reported to be an indicator of a distorted 13-cis isomer26 no peak is observed for any of the three proteins. In addition, the red-shift of the C![[double bond, length as m-dash]](https://www.rsc.org/images/entities/char_e001.gif) C double frequency (from 1529 cm−1 in WT to 1513 cm−1 in ARCH-5) is observed for mutants, in line with the red shift of the mutants' absorption spectra with respect to the WT.
C double frequency (from 1529 cm−1 in WT to 1513 cm−1 in ARCH-5) is observed for mutants, in line with the red shift of the mutants' absorption spectra with respect to the WT.
In conclusion, the isomer composition of the light-adapted proteins determined by Fourier transform Raman spectroscopy is qualitatively in agreement with the more precise and quantitative HPLC method (vide supra), with the additional information that the 13-cis, 15-syn isomer appears to be planar since no HOOP activity is observed.
2.3 Excited state lifetimes
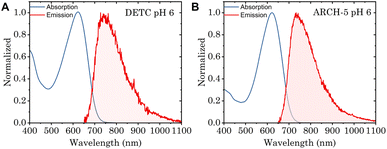
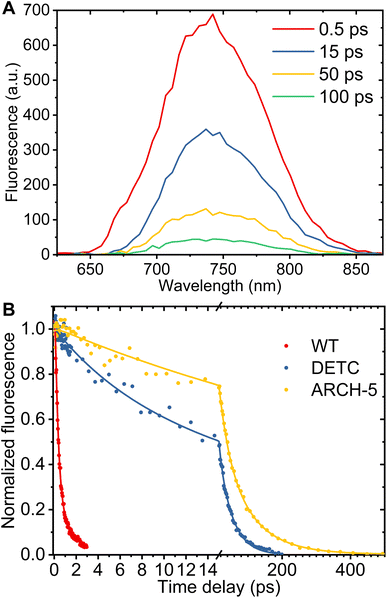
To study the impact of point mutations on the in vitro fluorescence properties, the Φf and fluorescence lifetimes were studied for DETC and ARCH-5 in their LA forms. The absorption and emission spectra of these mutants were measured (Fig. 4). These are known to be red-shifted with respect to the WT.5 Moreover, Φf for DETC and ARCH-5 at pH 6 were calculated as described in Methods.† The obtained values of 3.6 ± 0.6 × 10⁻³ and 9 ± 1 × 10⁻³ for DETC and ARCH-5 respectively are in agreement with the ones previously obtained for slightly lower pH values.5Broadband fluorescence up-conversion spectroscopy (FLUPS)27,28 with ∼150 fs time resolution (see Methods†) was used to investigate the fluorescence lifetimes of LA WT AR-3 and the two mutants at pH 6. Fig. 5A presents an example of the time evolution of DETC fluorescence spectra. According to this figure, the spectral shape does not change with time, only the fluorescent intensity decays. This indicates that the excited state dynamics do not depend on the detection wavelength and that both single and integrated kinetic analyses are relevant.
For an analysis of the kinetics, a spectral range of 15 nm around the fluorescence maximum (WT 722 nm, DETC and ARCH-5 735 nm) was averaged. The panel B of Fig. 5 presents experimental data (dots) for normalized kinetic traces for WT AR-3 (blue) and its mutants DETC (red) and ARCH-5 (yellow). It is clearly seen, that the WT fluorescence decays in a few ps while the mutants' fluorescence lives significantly longer. The kinetics have bi-exponential decay character for all the samples (Fig. S2†). Solid lines display the results of the multi-exponential fit. A Gauss function (representing the instrument response function) convoluted with two decaying exponents was used as a fitting function. A three-exponential fit was used for ARCH-5 kinetics to take into account the 0.4 ps rise of the fluorescence signal. Extracted decay time constants and their relative amplitudes are condensed in Table 1 along with calculated average fluorescence lifetimes for each of the proteins. The amplitude-weighted average fluorescence lifetimes for DETC and ARCH-5 are 29 ps and 66 ps, respectively. This approach is explained and justified in the ESI (Section 2.2†). Note that they are proportional to the above-determined Φf of these proteins.
| Sample | τ 1, ps | A 1, % | τ 2, ps | A 2, % | 〈τfluo〉, ps | Φ f | k nr, ns−1 | k r, ns−1 |
|---|---|---|---|---|---|---|---|---|
| AR 3 pH 6 | 0.34 ± 0.02 | 85 ± 2 | 1.4 ± 0.1 | 15 ± 2 | 0.5 | 2000 | ||
| DETC pH 6 | 7.7 ± 1.1 | 37 ± 6 | 42 ± 3 | 63 ± 6 | 29 | 3.6 ± 0.6 × 10⁻³ | 34 | 0.12 |
| ARCH-5 pH 6 | 31 ± 8 | 43 ± 9 | 91 ± 15 | 56 ± 3 | 66 | 9 ± 1 × 10⁻³ | 15 | 0.14 |
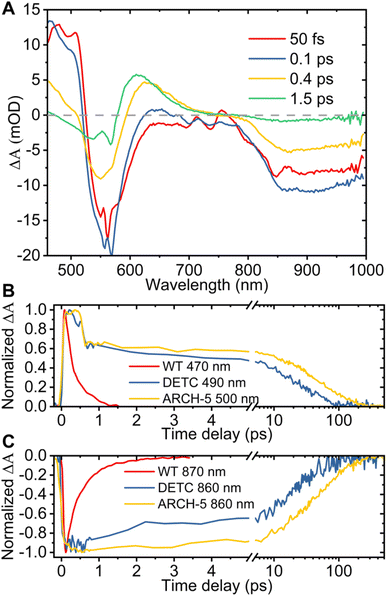
Additionally, to investigate the photoisomerization reaction and dynamics in the excited state of the proteins, ultrafast transient absorption spectroscopy (TAS) experiments were performed for the three proteins in their LA forms. In this method, the absorption changes in the 470–1000 nm range were monitored with 60 fs resolution after photoexcitation. The results of the TAS experiments are shown in Fig. 6. Panel A presents the time evolution of the difference absorption spectra of WT AR-3 (results for DETC and ARCH-5 are presented in the ESI†). We observe difference spectra typical for microbial retinal proteins, such as bR,29–32 highlighting excited state decay and isomerization on a sub-picosecond time scale. Indeed, at 50 fs the positive peak around 470–530 nm is due to excited state absorption (ESA) and the negative bands around 550 nm and 800–1000 nm range are assigned to the ground state bleaching (GSB) and stimulated emission (SE), respectively. Noise in the GSB region at 570 nm is caused by residual pump laser scattering. In the first 100 fs range ultrafast relaxation out of the Frank–Condon region takes place which explains the blue shift of the ESA and rise of SE in the near-IR. Later, along with the decay of the excited state (decay of ESA and SE) a new positive band appears around 630 nm. It reflects the all-trans to 13-cis isomerization of retinal, forming the vibrationally hot J intermediate, which in the next ps cools down (blue shift of its absorption to 610 nm) leading to the first ground state photoproduct of AR-3 (K intermediate).
The bottom part of Fig. 6 shows the comparison of the normalized ESA (panel B) and SE (panel C) dynamics of WT (red), DETC (blue) and ARCH-5 (yellow). Similar to the FLUPS results, DETC and ARCH-5 have significantly longer-lived excited states. At the short times (before 0.5 ps) the excited state kinetic traces of the mutants show an unusual sudden drop at 0.6 ps, which is due to excited state relaxation from the Franck–Condon region, but without the loss of its excited state population. Indeed, the stimulated emission remains constant during this time interval (see the complete time-dependent spectra for DETC and ARCH-5 in ESI,† panels A of Fig. S3 and S5†). In contrast with the WT, only a small absorption trace of photoproduct formation is detected for DETC and even weaker so for ARCH-5 for delays of hundreds of picoseconds, i.e. after excited state decay (Fig. S6†). The TAS results were globally fitted with three time constants. Results of the fit are presented in Table 2 and in panel C of Fig. S3–S5,† which represent the decay-associated difference spectra for each of the samples, respectively. For WT AR-3, short-lived components τ1 and τ2 are mainly attributed to the excited state decay and formation of the hot photoproduct. The decay time of the photoproduct (K intermediate) is beyond the detection time range of these experiments. For the mutants, on the other hand, τ1 is attributed to the thermal relaxation of the excited state and τ2 and τ3 to the excited state decay. Excited state lifetimes are consistent with the ones obtained in the FLUPS experiments. A direct comparison of the kinetic traces relevant to the excited state decay displays perfect agreement (not shown). The differences in the value of τ1 for WT AR-3 (Tables 1 and 2) are a consequence of the assumption of wavelength-independent lifetimes (global fit) for the TAS data.
| WT AR-3 | DETC | ARCH-5 | |
|---|---|---|---|
| τ 1, ps | 0.25 ± 0.02 | 0.4 ± 0.07 | 0.43 ± 0.03 |
| τ 2, ps | 1.4 ± 0.2 | 7 ± 1 | 28 ± 5 |
| τ 3, ps | ∞ | 42 ± 4 | 79 ± 6 |
2.4 Isomerization quantum yield
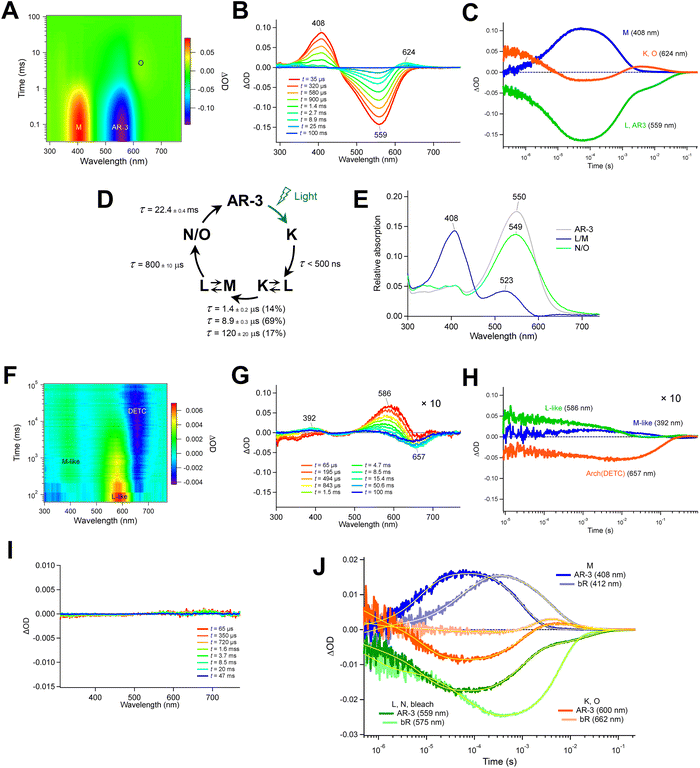
To determine the isomerization quantum yield of the WT AR-3 (ΦAR-3iso), we performed a nano-second transient absorption measurement and compared the bleach signal intensity with bR. ΦAR-3isois expressed as,31 | (1) |
![[thin space (1/6-em)]](https://www.rsc.org/images/entities/char_2009.gif) 600 M−1 cm−1 (ref. 33)) and the ratio between the absorption of the retinal oxime and the bleaching of the initial AR-3, the εAR-3 (600 nm) was determined to be 24
600 M−1 cm−1 (ref. 33)) and the ratio between the absorption of the retinal oxime and the bleaching of the initial AR-3, the εAR-3 (600 nm) was determined to be 24![[thin space (1/6-em)]](https://www.rsc.org/images/entities/char_2009.gif) 900 ± 300 M−1 cm−1 (εAR-3 (559 nm) was 48
900 ± 300 M−1 cm−1 (εAR-3 (559 nm) was 48![[thin space (1/6-em)]](https://www.rsc.org/images/entities/char_2009.gif) 900 ± 300 M−1 cm−1 at the peak maximum). Based on these values, ΦbRiso = 0.64 ± 0.04,34 and εbR(575 nm) 62
900 ± 300 M−1 cm−1 at the peak maximum). Based on these values, ΦbRiso = 0.64 ± 0.04,34 and εbR(575 nm) 62![[thin space (1/6-em)]](https://www.rsc.org/images/entities/char_2009.gif) 000 ± 1000 M−1 cm−1,35ΦAR-3iso was determined to be 0.54 ± 0.03.
000 ± 1000 M−1 cm−1,35ΦAR-3iso was determined to be 0.54 ± 0.03.
Then, we investigated the photoreaction of DETC and ARCH-5 mutants. DETC excited at 600 nm exhibited two blue-shifted photointermediates at 586 and 392 nm (Fig. 7, panels F and G). Because the former appeared faster than the latter, whose absorption wavelength is in the near-UV region indicating to have a deprotonated retinal Schiff-base, the 586 and 392 nm species were named L-like and M-like intermediates. It was difficult to determine the precise lifetimes of these intermediates due to the extremely small transient absorption signals of DETC. The signal intensity of the transient absorption change of DETC is less than 1/20 of the WT AR-3, indicating its isomerization efficiency is considerably smaller than that of the WT AR-3, i.e. in the range of 0.02–0.03. ARCH-5 excited at 600 nm did not exhibit any significant transient absorption change (Fig. 7, panel I), indicating the photoisomerization reaction hardly occurs in this mutant.
We also searched for a photo-product signal on the sub-nanosecond time scale by performing femtosecond TAS. The K-like intermediate shows up in WT AR-3 as a pronounced absorption band peaking at 605 nm (Fig. 6A), red-shifted, as usual, with respect to the ground state absorption spectrum. Similar signatures hardly emerge from the noise for DETC and ARCH-5 in the range of 650–700 nm, and the very weak GSB is obscured by pump light scattering (570–600 nm, Fig. S6†). A quantitative evaluation of the quantum yield Φiso is therefore impossible, also due to the strong spectral overlap of GSB and the K-like absorption band. We note however, that these data are in agreement with the nano-second TAS (see above), in that ARCH-5 has a lower Φiso than DETC, and ΦAR-3iso > 10 × ΦDETCiso.
The low Φiso values in the mutants support the conclusion that, relative to WT AR-3, the brighter steady-state emission of DETC and ARCH-5 at pH 6 is induced by a 1-photon absorption process, like in other AR-3-based GEVIs22,23 and in NeoR.9 Not only is the fluorescence intensity proportional to the excitation power, these mutants have a too low Φiso to form a putative fluorescent intermediate of sufficient amount, in stark contrast to WT AR-3. In addition, the fact that the ratio of the average fluorescence lifetimes agrees with the ratio of the Φf's for both mutants is in strong support of the 1-photon excitation process. Interestingly, a comparison with the S1 lifetime and Φf of NeoR9 shows that DETC and ARCH-5 have a radiative rate very similar to the former (cf.Table 1, kr ≈ 1.7 × 10⁸ s−1 for NeoR). Note however that in both mutants, the RPSB is present in a mixture of all-trans/15-anti and 13-cis/15-syn isomers, as demonstrated by both the HPLC analysis and Raman spectroscopy. Light-adaptation only enhances the proportion of the all-trans/15-anti, but it remains limited to 30%. Both fluorescence up-conversion and TAS experiments show a bi-exponential excited state decay, with relative amplitudes similar to the isomer composition (cf.Table 1). The most direct interpretation is then that the decay times τ1 and τ2 represent the decay of all-trans/15-anti and 13-cis/15-syn isomers, respectively (Fig. S9†). This assignment may be questioned since for other microbial rhodopsins, it was shown that the excited state lifetime of 13-cis/15-syn is shorter than the one of all-trans/15-anti.36–38 The assignment is therefore preliminary and will be substantiated through ongoing work comparing the temperature-dependant excited state decays of both mutants in light- and dark-adapted states. Unfortunately, since the absorption spectra of both all-trans/15-anti and 13-cis/15-syn isomers largely overlap (Fig. S8B and C†), it is impossible to determine the Φiso and Φf independently for one or the other isomer. The quoted values are thus an average over the relative amount both forms.
3 Computational results and discussion
3.1 Computed excited state dynamics of AR-3
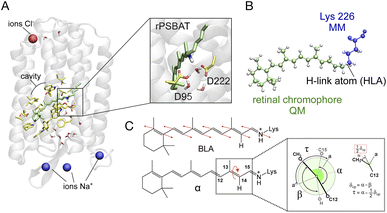
We use an automatically constructed quantum mechanics molecular mechanics (QM/MM) model of AR-3 to simulate its room-temperature photoisomerization dynamics at the population level (see details in Fig. 8A, B and the Method section†). The result provides a validation of the constructed QM/MM model as well as a basis for the assignment of part of the spectroscopy data presented above. Most importantly, it discloses different mechanistic aspects of the photoisomerization dynamics in this class of archaea-rhodopsins at both the geometrical and electronic structure levels.As illustrated in Fig. 9A the simulated isomerization, occurs on a sub-picosecond timescale indicating the existence of a substantially barrierless path connecting the Franck–Condon (FC) (i.e. vertical excitation) region of the population to an intersection seam (ISS1/S0) formed by CoIn points with values of α (i.e. of the C12–C13–C14–C15 dihedral, see Fig. 8C) spanning a ca. 70–120° range. By fitting the change in the S1 population fraction as a function of simulation time (see Fig. 9B), it is possible to compute an τS1of ∼190 fs at the complete active space self-consistent field (CASSCF) level39(see ESI for details†). This should be compared with the average fluorescence lifetime result reported in Table 1 above, where a larger time constant of ∼340 fs is determined. In Fig. 9C we also show how the isomerization coordinate is dominated by the C13![[double bond, length as m-dash]](https://www.rsc.org/images/entities/char_e001.gif) C14 torsional deformation α.
C14 torsional deformation α.
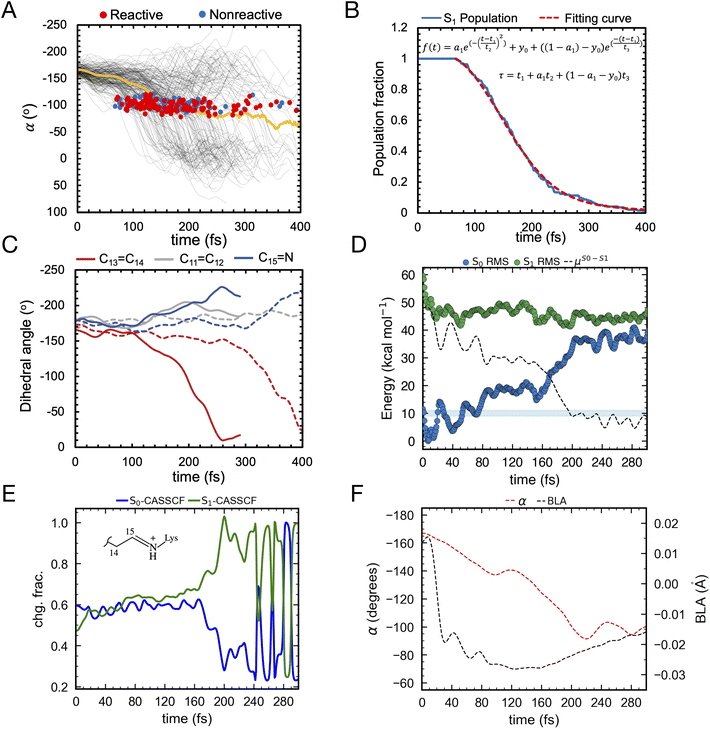 | ||
Fig. 9 (A) Evolution of α in all-trans AR-3 WT population dynamics. The evolution of α along S1 trajectories (in black) and the corresponding average value (in yellow). Reactive (leading to isomerization) and non-reactive (aborted isomerization) decay points are represented by red and blue circles, respectively computed using 200 trajectories. (B) τ fitting from population dynamics (details in the ESI† and ref. 39). The S1 population fraction as a function of time and the fitting function are given in blue and red, respectively. (C) Change in average dihedral angles of C11![[double bond, length as m-dash]](https://www.rsc.org/images/entities/char_e001.gif) C12 (ash), C13 C12 (ash), C13![[double bond, length as m-dash]](https://www.rsc.org/images/entities/char_e001.gif) C14 (red), and C15 C14 (red), and C15![[double bond, length as m-dash]](https://www.rsc.org/images/entities/char_e001.gif) N (blue) bonds across five randomly selected fast (solid lines) and five slow (dashed lines) trajectories. (D) Energy profiles along a single RMS-CASPT2 FC trajectory for AR-3 WT assuming zero kinetic energy. S0 and S1 profiles are reported as blue and green diamonds, respectively. The average S1–S0 energy is also given, while the horizontal blue bar indicates a 10 kcal mol−1 threshold to emphasize the approaching of ISS1/S0. (E) Evolution of the zeroth-order CASSCF charges associated to the AR-3 WT RMS-CASPT2 FC trajectory. The profiles correspond to the sum of such charges for the depicted moiety. (F) Evolution of α and BLA along the RMS-CASPT2 FC trajectory. N (blue) bonds across five randomly selected fast (solid lines) and five slow (dashed lines) trajectories. (D) Energy profiles along a single RMS-CASPT2 FC trajectory for AR-3 WT assuming zero kinetic energy. S0 and S1 profiles are reported as blue and green diamonds, respectively. The average S1–S0 energy is also given, while the horizontal blue bar indicates a 10 kcal mol−1 threshold to emphasize the approaching of ISS1/S0. (E) Evolution of the zeroth-order CASSCF charges associated to the AR-3 WT RMS-CASPT2 FC trajectory. The profiles correspond to the sum of such charges for the depicted moiety. (F) Evolution of α and BLA along the RMS-CASPT2 FC trajectory. | ||
While a ∼150 fs difference is significant when considering the short reaction time scale, we notice that this could, in part, depend on factors such as the limited accuracy of the PES and forces calculated at the CASSCF level that miss a significant portion of dynamic electron correlation energy. We will further discuss this point below. In Fig. 9A we also see that only part of the population reaches the photoproduct configuration (i.e. the K intermediate). By counting the number of reactive trajectories and calculating their fraction with respect to the total number of trajectories (reactive + unreactive), it is possible to estimate an Φiso that is 0.63 and, therefore, relatively close to the experimentally determined value of 0.54 ± 0.03. In conclusion, both the calculated τS1and Φiso seem to support a quantitatively correct use of the constructed AR-3 model for mechanistic studies.
An effort has been made to calculate a more accurate τS1value. To do so we used the state-of-the-art rotated multistate complete active space second-order perturbation theory (RMS-CASPT2)40 for equilibrium structures and trajectory calculation. In fact, like CASSCF, RMS-CASPT2 correctly describes the intersecting S1 and S0 PESs near the CoIn but also accounts for the dynamic electron correlation missing in CASSCF energy and gradient computations.40,41 In spite of their availability, running hundreds of RMS-CASPT2 quantum-classical trajectories is still highly unpractical. Therefore, we determining a scaling coefficient “ascale”, relating CASSCF and RMS-CASPT2 gradients and resulting in a correction for the τS1(tRMS-CASPT2 = ascale × tCASSCF, details in the ESI† and ref. 42). The resulting ascale value of 1.25 produces an improved τS1 of 239 fs. This finding suggests that, as expected from previous studies43 the inclusion of dynamic electron correlation leads to a flatter S1 PES, or on the contrary, that the CASSCF method tends to produce systematically steeper excited state PESs.
To confirm the conclusion above, we were able to propagate a single RMS-CASPT2 quantum-classical trajectory released from the FC geometry with zero initial kinetic energy to approximately estimate the average dynamics of the population.44 As shown in Fig. 9D, we found that such a trajectory indeed spans a shallower PES. The time necessary to approach the ISS1/S0, that we conveniently define with a threshold of e.g. 10 kcal mol−1 (see Fig. 9D) is significantly longer than in the corresponding CASSCF trajectory consistent with the scaling. However, a significant discrepancy between the computationally corrected τS1 and the experimental one remains, which is most probably due to our computations being based on a zero initial velocity single FC trajectory which does not properly account for the real ensemble of populations at room temperature.
3.2 Mechanistic aspects
In this section we look at some characteristics of the FC trajectory computed at the RMS-CASPT2 (and for comparison CASSCF) level of theory to discuss the general structural and electronic features of the S1 relaxation of AR-3 towards the ISS1/S0. We will then use the population dynamics simulated at the CASSCF level to discuss additional mechanistic features emerging from the population statistics. As shown in Fig. 9E, in the FC geometry the S0 state of WT AR-3 is characterized by a mixed COV/CT electronic character, i.e. its wavefunction is described in terms of these “diabatic states” (see also next section). In more detail, the S0 delocalized iminium positive charge is primarily (60%) residing in the chromophore portion incorporating the Schiff base moiety (e.g. with respect to the C13![[double bond, length as m-dash]](https://www.rsc.org/images/entities/char_e001.gif) C14 bond, see inset) and in S1 away from the Schiff base moiety. This situation changes rapidly, after 160 fs, along the S1 relaxation where the S0 state becomes dominated by the CT character and the S1 state by the COV character.
C14 bond, see inset) and in S1 away from the Schiff base moiety. This situation changes rapidly, after 160 fs, along the S1 relaxation where the S0 state becomes dominated by the CT character and the S1 state by the COV character.
This rather distinct behavior with respect to, for instance, animal rhodopins45 has been previously reported for certain AR-3 variants11 but, also, for extremely red-shifted rhodopsins such as NeoR.46 As the C13![[double bond, length as m-dash]](https://www.rsc.org/images/entities/char_e001.gif) C14 bond twists, S1 further increases in COV character until an α value of ≈90° (see Fig. 9F) where the π-conjugation along the chromophore backbone is substantially broken and now S1 features an almost pure COV character. The S1 electronic character change is mirrored by less negative values of the BLA. In fact, as displayed in Fig. 9F, the BLA value (i.e. the difference between average single and average double bond lengths) increases as the COV character increases, along the trajectory.
C14 bond twists, S1 further increases in COV character until an α value of ≈90° (see Fig. 9F) where the π-conjugation along the chromophore backbone is substantially broken and now S1 features an almost pure COV character. The S1 electronic character change is mirrored by less negative values of the BLA. In fact, as displayed in Fig. 9F, the BLA value (i.e. the difference between average single and average double bond lengths) increases as the COV character increases, along the trajectory.
As noted in a previous contribution by some of the authors,11,46 as the conjugation is broken, the COV character coincides with that of two unpaired electrons, thus it is more appropriate to reference this area of the S1 PES as that of a short lived (or even transient) TIDIR as, indeed, a shallow S1 energy minimum could be located. The COV character appears evident both by looking at the charges of the zeroth-order CASSCF and RMS-CASPT2 wavefunctions. In fact, this is naturally related to non-dynamic rather than dynamic electron correlation. Further inspection of Fig. 9D and F shows, consistently with existence of a TIDIR species, a small trajectory segment where the S1 energy, S1–S0 energy gap and COV character do not change. In the case of the CASSCF wavefunction the nature of the S1 electronic character oscillates revealing the presence of a nearby CoIn that, presumably, is not crossed in the RMS-CASPT2 description.
Going back to the CASSCF/6-31G* population dynamics, inspection of the geometrical changes associated with other relevant torsional degrees of freedom and accompanying the progression of α (see Fig. 8C) along the S1 PES are documented in Fig. 9C. One can see that both the C15![[double bond, length as m-dash]](https://www.rsc.org/images/entities/char_e001.gif) N and C11
N and C11![[double bond, length as m-dash]](https://www.rsc.org/images/entities/char_e001.gif) C12 bonds (measured using the skeletal dihedral angles C14–C15–N–C and C10–C11–C12–C13, respectively) undergo significant twisting in the counterclockwise direction relative to the clockwise α change and, thus, revealing a bicycle pedal motion active at the population level irrespective of whether the decay is slow or fast. On the other hand, such coupled motion is aborted upon decay as the “reactive” trajectories produce exclusively the 13-cis isomer of the chromophore upon S0 relaxation. This is reminiscent of the isomerization coordinate of other animal47 and microbial rhodopsins48,49 as originally proposed by Warshel.47
C12 bonds (measured using the skeletal dihedral angles C14–C15–N–C and C10–C11–C12–C13, respectively) undergo significant twisting in the counterclockwise direction relative to the clockwise α change and, thus, revealing a bicycle pedal motion active at the population level irrespective of whether the decay is slow or fast. On the other hand, such coupled motion is aborted upon decay as the “reactive” trajectories produce exclusively the 13-cis isomer of the chromophore upon S0 relaxation. This is reminiscent of the isomerization coordinate of other animal47 and microbial rhodopsins48,49 as originally proposed by Warshel.47
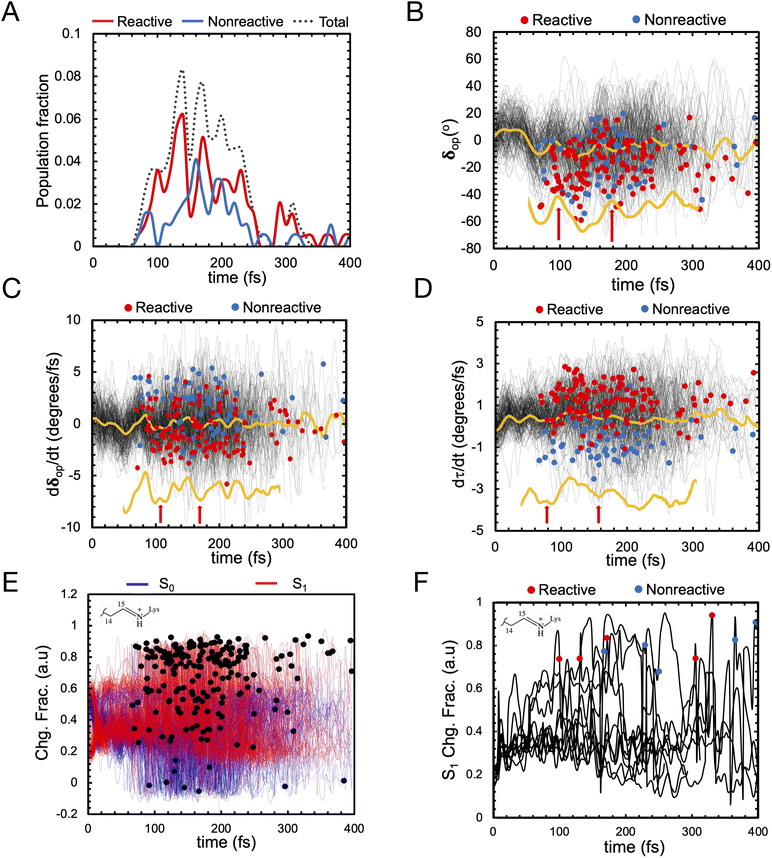
Let us now discuss the vibrationally coherent character of the excited state reaction. Inspection of the distribution of the reactive “hop” events (see red line, Fig. 10A) displays, for delays of 100–250 fs, at least two reactive waves that are separated by a ca. 40–50 fs period. Importantly, a plot of the geometrical variable δop (see Fig. 10B) corresponding to an out-of-plane hydrogen wag at C14 somehow coupled with the wag of the heavier methyl substituent at C13, displays a similar periodicity indicating an impact of the δop wag phase at the time of the decay on the trajectory reactivity. Indeed, these data support the hypothesis that the so-called “HOOP mechanism” demonstrated in bovine rhodopsin is also active in this microbial rhodopsin whose isomerization occurs on the C13![[double bond, length as m-dash]](https://www.rsc.org/images/entities/char_e001.gif) C14 double bond. Thus the AR-3 simulation provides evidence that the replacement of a H–C11
C14 double bond. Thus the AR-3 simulation provides evidence that the replacement of a H–C11![[double bond, length as m-dash]](https://www.rsc.org/images/entities/char_e001.gif) C12–H moiety of animal rhodopsins with the Me–C13
C12–H moiety of animal rhodopsins with the Me–C13![[double bond, length as m-dash]](https://www.rsc.org/images/entities/char_e001.gif) C14–H moiety of microbial rhodopsins does not quench the HOOP mechanism for the control of trajectory reactivity (and, in turn, Φiso, see ref. 45) through a phase matching between the Me–C13
C14–H moiety of microbial rhodopsins does not quench the HOOP mechanism for the control of trajectory reactivity (and, in turn, Φiso, see ref. 45) through a phase matching between the Me–C13![[double bond, length as m-dash]](https://www.rsc.org/images/entities/char_e001.gif) C14–H wag velocity and the α velocity. This implies that the larger is the population fraction decaying with a negative δop velocity at decay (the phase of α at decay is statistically positive due to the clockwise motion), the higher is the achieved Φiso value. Similar to the case of H–C11
C14–H wag velocity and the α velocity. This implies that the larger is the population fraction decaying with a negative δop velocity at decay (the phase of α at decay is statistically positive due to the clockwise motion), the higher is the achieved Φiso value. Similar to the case of H–C11![[double bond, length as m-dash]](https://www.rsc.org/images/entities/char_e001.gif) C12–H wag in animal rhodopsins, the phase dependent reactivity is explained by a change in overlap velocity at the moment of decay.45 This is illustrated by the compound geometrical variable τ (see Fig. 8C above), which is a combination of the variable describing the Me–C13
C12–H wag in animal rhodopsins, the phase dependent reactivity is explained by a change in overlap velocity at the moment of decay.45 This is illustrated by the compound geometrical variable τ (see Fig. 8C above), which is a combination of the variable describing the Me–C13![[double bond, length as m-dash]](https://www.rsc.org/images/entities/char_e001.gif) C14–H wag (HOOP) and the variable describing the C13
C14–H wag (HOOP) and the variable describing the C13![[double bond, length as m-dash]](https://www.rsc.org/images/entities/char_e001.gif) C14 isomerization (α), and that is proportional to the overlap between the fragment of π-orbitals whose interaction generates the C13
C14 isomerization (α), and that is proportional to the overlap between the fragment of π-orbitals whose interaction generates the C13![[double bond, length as m-dash]](https://www.rsc.org/images/entities/char_e001.gif) C14 π bond. The figure shows how the phase of the τ velocity is substantially dominated by the phase of the δop velocity (Fig. 10C) and that a positive τ velocity at decay marks reactive trajectories (see Fig. 10D).
C14 π bond. The figure shows how the phase of the τ velocity is substantially dominated by the phase of the δop velocity (Fig. 10C) and that a positive τ velocity at decay marks reactive trajectories (see Fig. 10D).
The above results convey a wealth of new information both on the S1 dynamics as well as on the optogenetically relevance of WT AR-3 as a template for the development of novel fluorescent reporters (see next section). In fact, on one hand, the spectroscopy of LA WT AR-3 at pH 6, shows that both the fluorescence decay kinetics and the ultrafast isomerization reaction monitored by TAS are consistent with several examples reported in the literature for other microbial rhodopsins, including bR.50–54 The dominant ≈300 fs decay time is due to the all-trans-to-13-cis isomerization process; an assignment supported by the QM/MM-based simulation of the light-induced population dynamics. In addition, these calculations also reveal that photoisomerisation occurs via a bicycle-pedal mechanism similar to the one found in animal rhodopsins (but occurring on the C13![[double bond, length as m-dash]](https://www.rsc.org/images/entities/char_e001.gif) C14–C15
C14–C15![[double bond, length as m-dash]](https://www.rsc.org/images/entities/char_e001.gif) N moiety rather than the C9
N moiety rather than the C9![[double bond, length as m-dash]](https://www.rsc.org/images/entities/char_e001.gif) C10–C11
C10–C11![[double bond, length as m-dash]](https://www.rsc.org/images/entities/char_e001.gif) C12) and that Φiso is modulated by coherent oscillations of Me–C13
C12) and that Φiso is modulated by coherent oscillations of Me–C13![[double bond, length as m-dash]](https://www.rsc.org/images/entities/char_e001.gif) C14–H wagging motion, which is a feature of barrier-less and ballistic isomerisation as seen, again, in animal rhodopins.45
C14–H wagging motion, which is a feature of barrier-less and ballistic isomerisation as seen, again, in animal rhodopins.45
On the other hand, and in spite of the above similarities, it is shown here for the first time that WT AR-3 is electronically different from reference (e.g. bR) microbial rhodopsins and animal rhodopsins: it has an unusual degree of mixed COV and CT characters (described by the chromophore positive charge distribution. See Fig. 9E, 10E and F) in both the S0 and S1 states already present in the Franck–Condon region and then conserved all along the reaction path. This and the related existence of a TIDIR intermediate close to the CoIn support the hypothesis that certain (presently unknown) fluorescent mutants of AR-3 may behave like NeoR.11,46 However, WT AR-3 shows that the conclusion indicating that the an S1 TIDIR with COV character necessarily implies an isomerisation-preventing S1 barrier20 is not valid any more. It is rather the destabilization of a pre-existing TIDIR “transient state” that modulates the barrier. It remains to be understood which exact electrostatic features of the RPSB-binding protein pocket WT AR-3, its mutants and in NeoR lead to their unusual electronic properties, i.e. the formation of the S1 TIDIR with COV character (cf.Fig. 11).
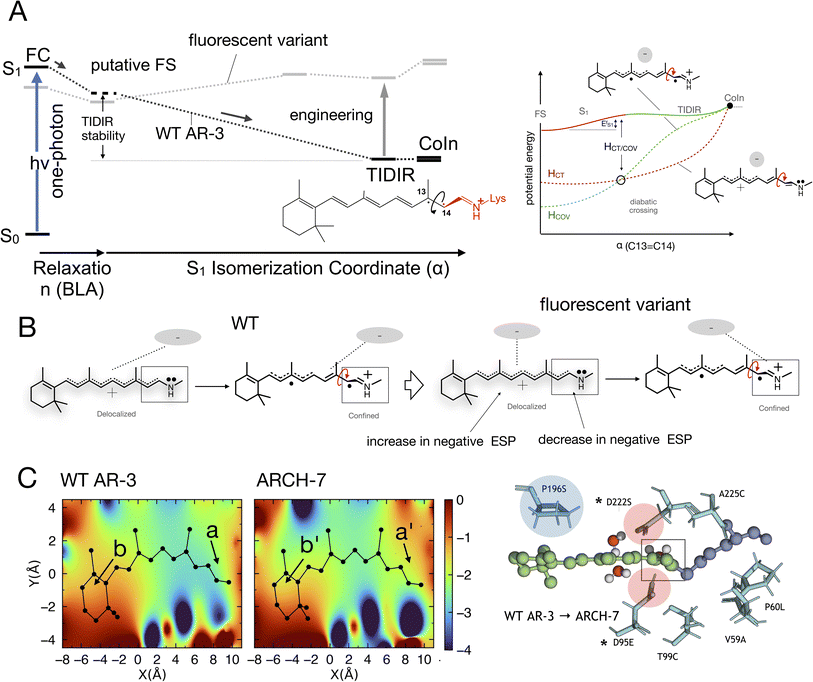 | ||
| Fig. 11 (A) Schematic comparison between the WT AR-3 S1 isomerization energy profiles (black) and the energy profile of a strongly emissive AR-3 variant (grey) (see also Fig. 1). It is evident that an engineering effort targeting high fluorescent AR-3 variants must destabilize the TIDIR region relative to the putative fluorescent state FS (bold vertical arrow). (B) Representation of the ESP changes through the displacement of a negative charge centroid when shifting from WT AR-3 to a fluorescent variant. (C) ESP cross-section computed for a WT AR-3 model and for the model of its ARCH-7 variant. A representation of the chromophore cavity mutation sites affecting the ESP is shown on the right (panel adapted from a previous work).11 The position of two relevant carboxylic side chains is marked with a*. | ||
4 Engineering aspects
When considering the rational engineering of AR-3 towards more fluorescent variants, one has to deal with the overwhelming structural complexity of the cavity hosting the chromophore. Indeed, the fact that the cavity may incorporate the chromophore counterion in different positions and polar residues in different orientations in response to both electrostatic and steric factors, leads to patterns of electrostatic potential (ESP) and steric interactions whose effect is not obvious and very difficult to predict. For this reason, here we do not explicitly focus on the effect of amino acid replacements but, rather, on the changes in cavity electrostatics that, in principle, would lead to an increased excited state lifetime of DETC and ARCH-5 and other fluorescent AR-3 variants. This is assumed to be the most important factor for controlling the 1-photon Φf.We start by noticing that the AR-3 population dynamics reported above shows that the S1 electronic character changes accompanying the isomerization, are confirmed at the statistical level. Indeed, Fig. 10E and F show that the majority of trajectories display a COV character at the moment of S1 decay (S1 Schiff base charge fraction >0.8). In other words, the theory of photoisomerization in AR-3 mutants and NeoR11,46 illustrated in Fig. 1 must also apply to WT AR-3. Again, this is different from the classical picture documented for bovine rhodopsin45 and bacteriorhodopsin,55 according to which S1 has a CT character at decay (S1 Schiff base charge fraction <0.2). It is this specific electronic character of the AR-3 chromophore that accounts for the impact of site-specific mutations on the variants' S1 lifetime.14–16,44
We now discuss which exact electrostatic features of the RPSB-binding protein pocket of WT AR-3 have to change to generate its brighter mutants such as DETC and ARCH-5 or, in perspective, variants as bright as NeoR. As anticipated above, our reasoning relies on the formation of the S1 TIDIR with COV character (cf. left panel in Fig. 11A). This implies that, (i) along the C13![[double bond, length as m-dash]](https://www.rsc.org/images/entities/char_e001.gif) C14 isomerization coordinate the diabatic states representing the CT and COV electronic characters cross (cf. right panel in Fig. 11A)11 and that the height of the crossing is proportional to the
C14 isomerization coordinate the diabatic states representing the CT and COV electronic characters cross (cf. right panel in Fig. 11A)11 and that the height of the crossing is proportional to the  barrier, (ii) the cavity electrostatics acts according to a mechanism called “charge delocalization and confinement”46 illustrated in Fig. 11B, and (iii) due to the initial mixed CT/COV character the FC and putative FS regions feature a chromophore with a “delocalized” positive charge while such charge is firmly “confined” in the C–C
![[double bond, length as m-dash]](https://www.rsc.org/images/entities/char_e001.gif) N moiety in TIDIR (or the CoIn region accessed by the trajectories). The consequence is that an increase of negative ESP (or a decrease of positive ESP) in a chromophore cavity region located far from the C–C
N moiety in TIDIR (or the CoIn region accessed by the trajectories). The consequence is that an increase of negative ESP (or a decrease of positive ESP) in a chromophore cavity region located far from the C–C![[double bond, length as m-dash]](https://www.rsc.org/images/entities/char_e001.gif) N moiety must destabilize the TIDIR region and increase
N moiety must destabilize the TIDIR region and increase  (see Fig. 11A and B). Due to lack of structural data, we could not computationally assess the above hypothesis for DETC and ARCH-5. Thus, in Fig. 11C we compare the ESP cross-section of WT AR-3 and its bright variant ARCH-7 whose QM/MM model has been reported.11 It can be seen that the electrostatic potential becomes more positive in the C–C
![[double bond, length as m-dash]](https://www.rsc.org/images/entities/char_e001.gif) N moiety (compare a with a′) region and more negative in the region close to the chromophore ring (compare b and b′) when going from WT to the variant.
N moiety (compare a with a′) region and more negative in the region close to the chromophore ring (compare b and b′) when going from WT to the variant.
Of course, these changes in ESP must be induced by the corresponding amino acid replacements that are shown on the right-end of the same figure. For instance, the replacements of the negatively charged oxygens of residue 222 with a single neutral serine oxygen combined with transferring the lost negative charge to residue 95 at a larger distance from the Schiff base, would contribute to projecting a less negative ESP on the C–C![[double bond, length as m-dash]](https://www.rsc.org/images/entities/char_e001.gif) N moiety. Similarly, the proline to serine replacement at position 196 could contribute to increasing the negative ESP far from the Schiff base. However, while one can attempt a rationalization of the ESP changes on the basis of the specific change in partial charge distribution and orientation induced by the replacements, the “inverse” problem of predicting which amino acid replacements would induce the wanted cavity ESP appears extremely complex and presently difficult to tackle if not in a highly hypothetical fashion. For this reason, we do not further elaborate on such point.
N moiety. Similarly, the proline to serine replacement at position 196 could contribute to increasing the negative ESP far from the Schiff base. However, while one can attempt a rationalization of the ESP changes on the basis of the specific change in partial charge distribution and orientation induced by the replacements, the “inverse” problem of predicting which amino acid replacements would induce the wanted cavity ESP appears extremely complex and presently difficult to tackle if not in a highly hypothetical fashion. For this reason, we do not further elaborate on such point.
Regarding the voltage sensitivity of the fluorescence intensity, in AR-3, its D95N mutant, and Archon1, its origin is proposed to result from the voltage-dependent change in the hydrogen-bonding network. These changes are induced by shifts in the orientation of R92 or D125, which in turn affect the equilibrium between the protonated and deprotonated states of the RSB, leading to the change in the fluorescent state.1,22,56 Therefore, to improve the fluorescence quantum yields of AR-3 variants while maintaining their voltage sensitivity, amino acid residues not involved in the hydrogen bonding network around RSB, R82, and D125 should be targeted for mutation to increase the excited state barrier.
5 Conclusions
In the context of establishing WT AR-3 as an ideal template for engineering fluorescent GEVIs, we motivated the present combined experimental and computational study by two questions: does the TIDIR intermediate with COV character also exist in WT AR-3, and how to provide experimental evidence for the TIDIR-related PES barrier in mutants? The latter is addressed by a set of spectroscopic studies of the DETC and ARCH-5 mutants, which highlight the extended, barrier-induced excited state lifetimes of the all-trans/15-anti and 13-cis/15-syn isomers; a fact also found in other AR-3-based mutants.22,23 In addition, the larger excited state barriers in the mutants correlate with a largely reduced isomerization quantum yield, Φiso. The first question is addressed by an unprecedented non-adiabatic dynamics simulation of the WT AR-3 photoisomerization at the population level, which allows to compute both the excited state lifetime and Φiso thus providing a basis for a mechanistic interpretation of the experimental results. The most important message from the simulated population dynamics is that the WT AR-3 displays indeed a significant CT character in S0 and a TIDIR intermediate with COV character in S1. This supports the hypothesis that the WT form of AR-3 has the same type of electronic character as the one found computationally in its weakly fluorescent AR-3 variants as well as in the strongly fluorescent NeoR. However, WT AR-3 does not feature an S1 isomerization barrier ( is negligible or absent), and therefore decays rapidly to S0. Since other microbial rhodopsins failed to produce fluorescent variants with Φf's similar to the ones obtained with AR-3 variants,15 we conjecture that the specific COV/CT mixture in S0 and S1, as well as the presence of a TIDIR intermediate with full COV character, is the reason for the WT AR-3 propensity to form isomerisation-restraining S1 barriers upon suitable genetic engineering.
The mechanism for the transition from WT AR-3 to a fluorescent form has been discussed and justified under the hypothesis that is controlled by variations in the cavity electrostatics and its interaction with the delocalized positive charge computed near the FC point and the TIDIR charge that is confined in the Schiff base moiety. This provides a rational route to engineering. In fact, it is possible to conclude that the problem of engineering highly fluorescent AR-3 variants, namely to increase the τS1of the system, can be solved by finding mutations creating an ESP that destabilizes TIDIR with respect to FS. However, the problem of how to exactly identify the necessary mutation pattern (or group of different mutation patterns) remains to be further investigated.
Data availability
Additional data for this article, including HPLC, time-resolved spectroscopy, computational results, and the calculation of average fluorescence lifetimes are available in the ESI.†Author contributions
The present paper is the result of a collaborative project of the teams led by M. O., M. S., K. I. and S. H. M. K. expressed and purified the proteins. K. H., M. K., I. W. and M. S. carried out the experiments and collected the data. D. W. and L. B. generated the QM/MM models and carried out all the calculations. All the authors contributed to analyzing, discussing, and interpreting the results, and to improving the different versions of the manuscript. K. H., D. W., M. K., L. B., M. O., K. I. and S. H. wrote the manuscript and ESI.†Conflicts of interest
The authors declare no conflict of interest.Acknowledgements
K. H and S. H. acknowledge the contributions of B. Marekha (ENS Lyon) in the early stage of the project, of O. Crégut for expert help in laser maintenance and development of data acquisition software and of L. Charbonnière (IPHC Strasbourg) for providing access to the near-IR Edinburgh fluorimeter. D. W., L. B. and M. O. are grateful to X. Yang (University of Siena) for his help in the computational part. Insightful discussions with the group of I. Moraes (NPL, London), and with N. Ferré and his team (Aix-Marseille University – CNRS) and with J. Léonard are acknowledged as well. French partners are funded by the ANR project UltrArchae (grant no. ANR-21-CE11-0029). The Strasbourg team acknowledges financial support from ITI QMAT, funded by IdEx Unistra program (ANR 10 IDEX 0002). The Japanese partners are funded by JSPS KAKENHI Grants-in-Aid (grant number: JP23K05007 to M. K.; JP21H01875, JP23K18090, and JP23H04404 to K. I.), JST CREST (grant number: JPMJCR22N2 to K. I.), and MEXT Promotion of Development of a Joint Usage/Research System Project: Coalition of Universities for Research Excellence Program (CURE) (grant number: JPMXP1323015482 to K. I.). K. H, I. W. and M. S. thank the vibrational spectroscopy facility of the Advanced Characterization Platform of the Chevreul Institute, Lille (FR 2638). M. O. is grateful to the NSF CHE-SDM A for Grant No. 2102619. L. B. and M. O. are also grateful for partial support provided by EU funding within the MUR PNRR “National Center for Gene Therapy and Drugs based on RNA Technology” (Project no. CN00000041 CN3 RNA) – Spoke 6.Notes and references
- X. Meng, S. Ganapathy, L. van Roemburg, M. Post and D. Brinks, ACS Phys. Chem. Au, 2023, 3, 320–333 CrossRef CAS
.
- H. Kandori, Bull. Chem. Soc. Jpn., 2020, 93, 76–85 CrossRef CAS
.
- J. Kralj, A. Douglass and D. Hochbaum, Nat. Methods, 2012, 9, 90–95 CrossRef CAS
.
- K. Kojima, A. Shibukawa and Y. Sudo, Biochemistry, 2020, 59, 218–229 CrossRef CAS PubMed
.
- R. S. McIsaac, M. K. M. Engqvist, T. Wannier, A. Z. Rosenthal, L. Herwiga, N. C. Flytzanis, E. S. Imashevac, J. K. Lanyic, S. P. Balashovc, V. Gradinarub and F. H. Arnolda, Proc. Natl. Acad. Sci. U.S.A., 2014, 11, 13034–13039 CrossRef
.
- N. C. Flytzanis, C. N. Bedbrook, H. Chiu, M. K. M. Engqvist, C. Xiao, K. Y. Chan, P. W. Sternberg, F. H. Arnold and V. Gradinaru, Nat. Commun., 2014, 5, 4894 CrossRef CAS PubMed
.
- D. R. Hochbaum, Y. Zhao, S. L. Farhi, N. Klapoetke, V. K. Christopher A Werley, P. Zou, J. M. Kralj, N. S.-M. Dougal Maclaurin, J. L. Saulnier, G. L. Boulting, C. Straub, Y. K. Cho, M. Melkonian, G. K.-S. Wong, D. J. Harrison, V. N. Murthy, B. L. Sabatini, E. S. Boyden, R. E. Campbell and A. E. Cohen, Nat. Methods, 2014, 11, 825–833 CrossRef CAS
.
- K. D. Piatkevich, E. E. Jung, C. Straub, C. Linghu, D. Park, H.-J. Suk, D. R. Hochbaum, D. Goodwin, E. Pnevmatikakis, N. Pak, T. Kawashima, C.-T. Yang, J. L. Rhoades, O. Shemesh, S. Asano, Y.-G. Yoon, L. Freifeld, J. L. Saulnier, C. Riegler, F. Engert, T. Hughes, M. Drobizhev, B. Szabo, M. B. Ahrens, S. W. Flavell, B. L. Sabatini and E. S. Boyden, Nat. Chem. Biol., 2018, 14, 352–360 CrossRef CAS
.
- M. Broser, A. Spreen, P. E. Konold, E. Peter, S. Adam, V. Borin, I. Schapiro, R. Seifert, J. T. M. Kennis, Y. A. Bernal Sierra and P. Hegemann, Nat. Commun., 2020, 11, 5682 CrossRef CAS
.
- R. Palombo, L. Barneschi, L. Pedraza-González, D. Padula, I. Schapiro and M. Olivucci, Nat. Commun., 2022, 13, 6652 CrossRef CAS
.
- L. Barneschi, E. Marsili, L. Pedraza-González, D. Padula, L. De Vico, D. Kaliakin, A. Blanco-González, N. Ferré, M. Huix-Rotllant, M. Filatov and M. Olivucci, Nat. Commun., 2022, 13, 6432 CrossRef CAS PubMed
.
- D. Maclaurin, V. Venkatachalam, H. Lee and A. E. Cohen, Proc. Natl. Acad. Sci. U.S.A., 2013, 110, 5939–5944 CrossRef CAS PubMed
.
- K. Kojima, R. Kurihara, M. Sakamoto, T. Takanashi, H. Kuramochi, X. M. Zhang, H. Bito, T. Tahara and Y. Sudo, J. Phys. Chem. B, 2020, 124, 7361–7367 CrossRef CAS
.
- S. Gozem, H. L. Luk, I. Schapiro and M. Olivucci, Chem. Rev., 2017, 117, 13502–13565 CrossRef CAS
.
- M. d. C. Marín, D. Agathangelou, Y. Orozco-Gonzalez, A. Valentini, Y. Kato, R. Abe-Yoshizumi, H. Kandori, A. Choi, K.-H. Jung, S. Haacke and M. Olivucci, J. Am. Chem. Soc., 2019, 141, 262–271 CrossRef PubMed
.
- D. Agathangelou, P. P. Roy, M. del Carmen Marín, N. Ferré, M. Olivucci, T. Buckup, J. Léonard and S. Haacke, C. R. Phys., 2021, 22, 111–138 CrossRef
.
- J. Zhang, P. Singh, D. Engel, B. P. Fingerhut, M. Broser, P. Hegemann and T. Elsaesser, Proc. Natl. Acad. Sci. U.S.A., 2024, 121, e2319676121 CrossRef CAS
.
- S. Schenkl, F. van Mourik, G. van der Zwan, S. Haacke and M. Chergui, Science, 2005, 309, 917–920 CrossRef CAS PubMed
.
- J. Léonard, E. Portuondo-Campa, A. Cannizzo, F. van Mourik, G. van der Zwan, J. Tittor, S. Haacke and M. Chergui, Proc. Natl. Acad. Sci. U.S.A., 2009, 106, 7718–7723 CrossRef
.
- M. Broser, T. Andruniów, A. Kraskov, R. Palombo, S. Katz, M. Kloz, J. Dostál, C. Bernardo, J. T. M. Kennis, P. Hegemann, M. Olivucci and P. Hildebrandt, J. Phys. Chem. Lett., 2023, 14, 9291–9295 CrossRef CAS PubMed
.
- A. Penzkofer, A. Silapetere and P. Hegemann, Int. J. Mol. Sci., 2019, 21, 160 CrossRef
.
- A. Silapetere, S. Hwang, Y. Hontani, R. G. Fernandez Lahore, J. Balke, F. Velazquez Escobar, M. Tros, P. E. Konold, R. Matis, R. Croce, P. J. Walla, P. Hildebrandt, U. Alexiev, J. T. M. Kennis, H. Sun, T. Utesch and P. Hegemann, Nat. Commun., 2022, 13, 5501 CrossRef CAS
.
- D. M. Nikolaev, V. N. Mironov, E. M. Metelkina, A. A. Shtyrov, A. S. Mereshchenko, N. A. Demidov, S. Y. Vyazmin, T. B. Tennikova, S. E. Moskalenko, S. A. Bondarev, G. A. Zhouravleva, A. V. Vasin, M. S. Panov and M. N. Ryazantsev, ACS Phys. Chem. Au, 2024, 4(4), 347–362 CrossRef CAS
.
- S. Oesterhelt, M. Meentzen and L. Schuhmann, Eur. J. Biochem., 1973, 40, 453–463 CrossRef PubMed
.
- S. O. Smith, M. S. Braiman, A. B. Myers, J. A. Pardoen, J. M. L. Courtin, C. Winkel, J. Lugtenburg and R. A. Mathies, J. Am. Chem. Soc., 1987, 109, 3108–3125 CrossRef CAS
.
- S. O. Smith, J. A. Pardoen, J. Lugtenburg and R. A. Mathies, J. Phys. Chem., 1987, 91, 804–819 CrossRef CAS
.
-
J. Léonard, T. Gelot, K. Torgasin and S. Haacke, 9th International Conference on Photonics and Imaging in Biology and Medicine (Pibm 2010), 2011, vol. 277 Search PubMed
.
- M. Gerecke, G. Bierhance, M. Gutmann, N. P. Ernsting and A. Rosspeintner, Rev. Sci. Instrum., 2016, 87, 053115 CrossRef
.
- K. Hasson, F. Gai and P. A. Anfinrud, Proc. Natl. Acad. Sci. U.S.A., 1996, 93, 15124–15129 CrossRef CAS
.
- O. Bismuth, N. Friedman, M. Sheves and S. Ruhman, J. Phys. Chem. B, 2007, 111, 2327–2334 CrossRef CAS
.
- K. Inoue, Y. Sudo, M. Homma and H. Kandori, J. Phys. Chem. B, 2011, 115, 4500–4508 CrossRef CAS PubMed
.
- I. Chizhov, D. S. Chernavskii, M. Engelhard, K. H. Mueller, B. V. Zubov and B. Hess, Biophys. J., 1996, 71, 2329–2345 CrossRef CAS
.
- B. Scharf, B. Pevec, B. Hess and M. Engelhard, Eur. J. Biochem., 1992, 206, 359–366 CrossRef CAS PubMed
.
- J. Tittor and D. Oesterhelt, FEBS Lett., 1990, 263, 269–273 CrossRef CAS
.
- S. Hashimoto, K. Obata, H. Takeuchi, R. Needleman and J. K. Lanyi, Biochemistry, 1997, 36, 11583–11590 CrossRef CAS
.
- A. Wand, R. Rozin, T. Eliash, K.-H. Jung, M. Sheves and S. Ruhman, J. Am. Chem. Soc., 2011, 133, 20922–20932 CrossRef CAS PubMed
.
- A. Wand, N. Friedman, M. Sheves and S. Ruhman, J. Phys. Chem. B, 2012, 116, 10444–10452 CrossRef CAS PubMed
.
- A. Cheminal, J. Léonard, S.-Y. Kim, K.-H. Jung, H. Kandori and S. Haacke, Phys. Chem. Chem. Phys., 2015, 17, 25429–25439 RSC
.
- M. Manathunga, X. Yang, H. L. Luk, S. Gozem, L. M. Frutos, A. Valentini, N. Ferrè and M. Olivucci, J. Chem. Theory Comput., 2016, 12, 839–850 CrossRef CAS PubMed
.
- S. Battaglia and R. Lindh, J. Chem. Theory Comput., 2020, 16, 1555–1567 CrossRef CAS PubMed
.
- Y. Nishimoto, S. Battaglia and R. Lindh, J. Chem. Theory Comput., 2022, 18, 4269–4281 CrossRef CAS PubMed
.
- L. M. Frutos, T. Andruniów, F. Santoro, N. Ferré and M. Olivucci, Proc. Natl. Acad. Sci. U.S.A., 2007, 104, 7764–7769 CrossRef CAS PubMed
.
- L. Barneschi, D. Kaliakin, M. Huix-Rotllant, N. Ferré, M. Filatov and M. Olivucci, J. Chem. Theory Comput., 2023, 19, 8189–8200 CrossRef CAS PubMed
.
- S. Gozem, H. L. Luk, I. Schapiro and M. Olivucci, Chem. Rev., 2017, 117, 13502–13565 CrossRef CAS
.
- X. Yang, M. Manathunga, S. Gozem, J. Léonard, T. Andruniów and M. Olivucci, Nat. Chem., 2022, 14, 441–449 CrossRef CAS PubMed
.
- R. Palombo, L. Barneschi, L. Pedraza-González, D. Padula, I. Schapiro and M. Olivucci, Nat. Commun., 2022, 13, 6652 CrossRef CAS PubMed
.
- A. Warshel, Nature, 1976, 260, 679–683 CrossRef CAS
.
- R. Palombo, L. Barneschi, L. Pedraza-González, X. Yang and M. Olivucci, Phys. Chem. Chem. Phys., 2024, 26, 10343–10356 RSC
.
- P. Altoè, A. Cembran, M. Olivucci and M. Garavelli, Proc. Natl. Acad. Sci. U.S.A., 2010, 107, 20172–20177 CrossRef
.
- R. A. Mathies, C. H. Brito Cruz, W. T. Pollard and C. V. Shank, Science, 1988, 240, 777–779 CrossRef CAS PubMed
.
- M. Du and G. R. Fleming, Biophys. Chem., 1993, 48, 101–111 CrossRef CAS
.
- K. Hasson, F. Gai and P. Anfinrud, Proc. Natl. Acad. Sci. U.S.A., 1996, 93, 15124–15129 CrossRef CAS
.
- J. Briand, J. Léonard and S. Haacke, J. Opt., 2010, 12, 084004–084016 CrossRef
.
- A. Wand, I. Gdor, J. Zhu, M. Sheves and S. Ruhman, Annu. Rev. Phys. Chem., 2013, 64, 437–458 CrossRef CAS
.
- S. Gozem, P. J. Johnson, A. Halpin, H. L. Luk, T. Morizumi, V. I. Prokhorenko, O. P. Ernst, M. Olivucci and R. D. Miller, J. Phys. Chem. Lett., 2020, 11, 3889–3896 CrossRef CAS
.
- E. C. Saint Clair, J. I. Ogren, S. Mamaev, D. Russano, J. M. Kralj and K. J. Rothschild, J. Phys. Chem. B, 2012, 116, 14592–14601 CrossRef CAS PubMed
.
Footnotes |
| † Electronic supplementary information (ESI) available: Experimental and computational methods, additional data and figures femtosecond spectroscopy, protocol light adaptation, etc. See DOI: https://doi.org/10.1039/d4sc05120c |
| ‡ These authors contributed equally. |
| This journal is © The Royal Society of Chemistry 2025 |

