Highly dispersed copper-based nanocomposite synthesis via spray pyrolysis: towards waste-to-hydrogen production through the water-gas shift reaction†
I-Jeong
Jeon‡
a,
Jae Seob
Lee‡
bc,
Kun Woo
Baek
b,
Chang-Hyeon
Kim
a,
Ji-Hyeon
Gong
d,
Won-Jun
Jang
 *de,
Jung Sang
Cho
 *bfg and
Jae-Oh
Shim
 *a
*a
aDepartment of Chemical Engineering/Nanoscale Environmental Sciences and Technology Institute, Wonkwang University, 460 Iksan-daero, Iksan-si, Jeollabuk-do 54538, Republic of Korea. E-mail: joshim85@wku.ac.kr
bDepartment of Engineering Chemistry, Chungbuk National University, Chungbuk 28644, Republic of Korea. E-mail: jscho@cbnu.ac.kr
cDepartment of Materials Science and Engineering, Korea University, Anam-Dong, Seongbuk-Gu, Seoul, 02841, Republic of Korea
dDepartment of Environmental Engineering, Ajou University, 206 World Cup-ro, Suwon-si, Gyeonggi-do 16499, Republic of Korea. E-mail: wjjang@ajou.ac.kr
eDepartment of Environmental and Safety Engineering, Ajou University, 206 World Cup-ro, Suwon-si, Gyeonggi-do 16499, Republic of Korea
fBiomedical Research Institute, Chungbuk National University Hospital, Chungbuk 28644, Republic of Korea
gAdvanced Energy Research Institute, Chungbuk National University, Cheongju, Chungbuk 28644, Republic of Korea
First published on 2nd December 2024
Abstract
In this study, we synthesized a Cu–ZrCeO2 catalyst using spray pyrolysis, which exhibited high activity, stability, and reusability at high temperatures. The catalyst was applied to a high-temperature water–gas shift reaction under practical conditions using waste-derived synthesis gas. Various reducible supports, including CeO2, ZrO2, TiO2, ZrCeO2, and TiCeO2 were evaluated. Among these, the Cu–ZrCeO2 (SPCZC) catalyst exhibited the highest activity and stability, attributed to its abundant oxygen defects, high Cu dispersion, and significant oxygen storage capacity. The SPCZC catalyst achieved 76% CO conversion and 100% CO2 selectivity at 400 °C. It also maintained stable catalytic performance for 50 h, showing resistance to Cu sintering and preservation of the yolk–shell structure, indicating high reusability. A comprehensive deactivation study was conducted on the catalysts. Rapid Cu sintering was observed when CeO2 was used as the sole support, leading to the breakdown of the yolk–shell structure. Catalysts supported on ZrO2, TiO2, and TiCeO2 also experienced Cu sintering and carbon deposition, leading to deactivation.
Introduction
The growing population, urbanization, and industrialization have significantly increased waste generation.1 In 2020, the global population of around 8 billion produced 2.5 billion tons of waste, a number expected to rise to 3.4 billion tons by 2050.2 The COVID-19 pandemic has exacerbated this issue by increasing municipal solid waste, including disposable items. Traditionally, waste management has relied on incineration and landfilling, both of which pose serious environmental challenges. Consequently, several countries are moving away from these approaches, restricting untreated waste landfilling and promoting environmentally friendly alternatives. This shift has spurred research into waste-to-energy (WtE) technologies as a sustainable waste management approach. One promising WtE solution is gasification, which transforms waste into gaseous products such as CO, H2, CH4, and CO2.3 Hydrogen can be produced from these gases through a series of steps: gasification, purification, the water–gas shift (WGS) reaction, and separation.4 The WGS reaction plays a critical role in producing high-purity hydrogen from waste.4 It is widely used to supply high-purity hydrogen from natural-gas-derived syngas for the Haber process, which produces nitrogen fertilizer. In this process, CO must be removed, as it deactivates the iron catalyst used in the Haber process, making the WGS reaction essential. Similarly, when hydrogen is produced for fuel cells, CO must be reduced to ppm levels in syngas to prevent catalyst poisoning. The WGS reaction is crucial in this context, as it reduces CO concentration while generating additional hydrogen for polymer electrolyte membrane fuel cells.The WGS reaction converts CO and H2O into CO2 and H2. In general, the WGS reaction is performed in two temperature ranges considering both thermodynamic and kinetic aspects: high-temperature shift (HT-WGS, 350–500 °C) and low-temperature shift (LT-WGS, 190–250 °C).5–8 While the LT-WGS reaction is thermodynamically favorable for hydrogen production, the HT-WGS reaction is more suitable for waste-derived syngas due to the high temperatures present after gasification and the rapid temperature increase in the catalyst bed.9,10 Fe–Cr-based catalysts are commercially used to convert synthesis gas derived from natural gas, but more active catalysts are required to convert synthesis gas derived from waste gasification, which contains a higher concentration of CO (∼40%). Furthermore, high CO concentrations increase the risk of carbon deposition via the Boudouard reaction (2CO → C + CO2).11 Cu, a non-precious metal, is effective in increasing the activity of WGS catalysts. Commercial HT-WGS catalysts often contain copper,9,12 although Cu is prone to sintering, which limits its use to low temperatures. However, research is being conducted to improve the performance of Cu with appropriate supports, synthesis methods, and structured catalysts.4,13–16 Na et al. conducted a study on the effect of adding Ba, Zr, and Nd to Ce/Cu/Al2O3 catalysts in the HT-WGS reaction, where the catalysts with Ba and Zr showed higher activity and stability. Their research concluded that the catalytic activity and stability are significantly influenced by the oxygen vacancy concentration and strong metal-to-support interaction (SMSI). Chang et al. investigated Cu catalysts on MgAl2O4 (MAO) supports, prepared by impregnation and by atomic layer deposition (ALD) of ZnO, CeO2, Mn2O3, and CoO, followed by Cu deposition.13 The Cu/MAO catalyst prepared by ALD showed twice the Cu dispersion and 10 times higher activity compared to the Cu/MAO catalyst prepared by impregnation, demonstrating the structural sensitivity of catalytic activity. Catalysts prepared with ZnO, CeO2, and Mn2O3 showed similar activity to Cu/MAO, while the catalyst with CoO exhibited slightly lower activity due to alloy formation. Lee et al. studied HT-WGS catalysts prepared by co-precipitation, using supports with varying Ce/Mg ratios along with Cu.14 The CCM75 catalyst (Ce/Mg = 75/25) showed high activity and stability, attributed to its high Cu dispersion and OSC value, and they concluded that Cu dispersion contributes to OSC formation.
Spray pyrolysis is a technique that includes both spray drying and flame spray pyrolysis.17 Generally, it involves atomizing droplets from a precursor solution using ultrasonic power, followed by evaporation and decomposition in a thermal reactor.17,18 This process allows the synthesis of materials with precise stoichiometry by spraying micron-sized droplets from the precursor solution at the desired ratio.18 The spray pyrolysis process comprises two steps: the “spray” step, where ultrasonic force atomizes the precursor solution into droplets, and the “pyrolysis” step, where these droplets evaporate and decompose in a thermal reactor. This method efficiently produces carbon-composite microspheres with various compositions.17 Spray pyrolysis is well-suited for commercial applications due to its scalability, cost-effectiveness, and continuous process.17,18 The incorporation of additives into the spray solution and control of the process in a thermal reactor facilitates the production of nano-powders with homogeneous compositions, making it advantageous for nanostructured powder synthesis.19 In our previous study, we used spray pyrolysis to synthesize Pt-loaded Ce0.75Zr0.25O2 catalysts for the LT-WGS reaction,20 achieving improved stability while maintaining high activity. We attribute this performance to the yolk–shell structure synthesized via spray pyrolysis, which prevents Pt sintering and sustains catalytic efficiency.
Despite the high activity of Cu catalysts in the WGS reaction, their application to WGS reactions using waste gasification syngas has been rare. Furthermore, the use of unique synthesis methods, such as spray pyrolysis for WGS applications is scarcely reported. The aim of this study was to apply Cu-loaded catalysts on various reducible supports (CeO2, ZrO2, TiO2, ZrCeO2, and TiCeO2) for HT-WGS reactions using simulated waste-derived syngas. The catalysts, synthesized using spray pyrolysis and denoted as SPC catalysts, were characterized to elucidate the reasons behind their high activity. Additionally, to investigate deactivation mechanisms, we monitored changes in the physical properties of the Cu-based catalyst synthesized by spray pyrolysis over different reaction times (initial, after 2 h, after 10 h, and after 50 h). Based on these observations, the causes of catalyst deactivation were investigated. Furthermore, the optimized catalyst was subjected to daily start-up and shut down (DSS) tests to assess its reusability in hydrogen production from waste.
Materials and methods
Catalyst preparation
SPC catalysts containing CeO2, ZrO2, and TiO2, denoted as SPCC, SPCZ, and SPCT, respectively, were synthesized via one-pot spray pyrolysis. For the synthesis, three spray solutions were prepared by adding 0.1 M copper(II) nitrate trihydrate [Cu(NO3)2·3H2O, DAEJUNG, 99.0%] and 0.3 M sucrose [C12H22O11, DAEJUNG] to 200 mL of distilled water, followed by stirring for 1 h. Subsequently, 0.2 M metal salts–cerium(III) nitrate hexahydrate [Ce(NO3)3·6H2O, SAMCHUN, 98.0%], zirconyl(IV) nitrate hydrate [Zr(NO3)2·xH2O, Thermo Fisher Scientific, 99.5%], and titanium(IV) isopropoxide [Ti[OCH(CH3)2]4, JUNSEI, 98.0%]–were added to each spray solution. The three prepared solutions were then transferred to an ultrasonic nebulizer connected to a vertical quartz reactor (length, 1200 mm; diameter, 50 mm). Droplets generated by the nebulizer passed through the reactor fixed at 600 °C under an air atmosphere with a flow rate of 10 L min−1, resulting in the synthesis of SPCC, SPCZ, and SPCT catalysts. Additionally, Cu-based catalysts with binary metal oxide substrates (CeO2/ZrO2 and CeO2/TiO2), denoted as SPCZC and SPCTC, were synthesized. The base spray solution was prepared by dissolving 0.1 M Cu precursor and 0.3 M sucrose in distilled water. For the synthesis of SPCZC and SPCTC catalysts, 0.15 M Ce precursor and 0.05 M Zr and Ti precursor were added to the base spray solution. Both SPCZC and SPCTC catalysts were synthesized under identical spray pyrolysis conditions.Catalyst characterization
Field emission scanning electron microscopy (FE-SEM) images of the catalysts were obtained using an Ultra Plus field emission SEM (Zeiss) operating at 20 kV, and field emission transmission electron microscopy (FE-TEM) images were obtained using a JEM-2100F (JEOL, Korea Basic Science Institute). The prepared catalysts were reduced under the same reaction conditions in a 5% H2/N2 atmosphere at 400 °C for 1 h. The Brunauer–Emmett–Teller (BET) surface area of the catalysts was measured at −196 °C using N2 adsorption/desorption methods after pretreatment at 200 °C for 4 h using an ASAP 2020 PLUS instrument (Micromeritics, Waste to Energy and Catalyst Laboratory of Ajou University). X-ray diffraction (XRD) patterns of the catalysts were determined using a MiniFlex 600 (Rigaku) with Ni-filtered Cu-Kα radiation at 40 kV and 15 mA. N2O chemisorption was performed using an Autochem II 2920 instrument (Micromeritics, Waste to Energy and Catalyst Laboratory, Ajou University). The surface area of Cu metal was measured using the N2O surface titration method. Prior to the N2O titration, 0.1 g of the fresh samples were reduced at 400 °C for 1 h with a 10% H2/Ar flow. The consumption of N2O and the release of N2 on the metallic Cu sites (N2O + 2Cu = Cu2O + N2) were measured at 100 °C by using a thermal conductivity detector (TCD). The surface area of metallic Cu was calculated assuming 1.46 × 10¹⁹ Cu atoms per m2 and a molar ratio of 0.5, for N2O/Cus (Cu atom on the surface). The particle size of Cu was calculated using the equation: 6000/(8.92 × Cu metal surface area/Cu fraction in grams of catalyst). H2-TPR analysis was performed using an Autochem II 2920 instrument (Micromeritics, Waste to Energy and Catalyst Laboratory of Ajou University) to determine the reduction temperatures of the catalysts. A 0.1 g sample was loaded into a quartz reactor, and TPR analysis was performed using 10% H2/Ar from 20 °C to 800 °C at a heating rate of 10 °C min−1. X-ray photoelectron spectroscopy (XPS) was performed using a Thermo/K-Alpha ESCA System (Thermo Fisher Scientific), maintaining a chamber pressure of 4.8 × 10⁻⁹ mbar. The detector was operated in constant energy mode with a pass energy of 100 eV for survey spectra and 50 eV for detailed scans. Oxygen storage complete capacity (OSCC) analysis was performed using an Autochem II 2920 instrument (Micromeritics, Waste to Energy and Catalyst Laboratory of Ajou University). After reducing the catalysts in a 10% H2/Ar atmosphere, 10% O2/He gas was injected until no further adsorption occurred.Catalytic reaction
The activity of the catalyst for the HT-WGS reaction was measured in a microtubular quartz reactor with a length of 600 mm and an inner diameter of 4 mm. The catalyst (50 mg) was placed on quartz wool inside the reactor, and the reaction was conducted. The HT-WGS reaction was carried out in the temperature range of 350–550 °C, with the reaction temperature measured and controlled using a K-type thermocouple. Before the reaction, the catalyst was reduced at 400 °C for 1 h in 5 vol% H2/N2 in the reactor. The reaction gas mixture consisted of H2 (29.44 vol%), N2 (9.05 vol%), CH4 (2.29 vol%), CO (37.91 vol%), and CO2 (21.31 vol%). A mass flow controller (Brooks-instrument-5850E) was used for the continuous injection of the reaction gas. The feed H2O/(CH4 + CO + CO2) ratio of the reaction gas was maintained at 2.0, with the gas injected using a syringe pump. The injected water was preheated to 180 °C before reaching the reactor. The activity tests of the catalyst were conducted at a gas hourly space velocity (GHSV) of 25![[thin space (1/6-em)]](https://www.rsc.org/images/entities/char_2009.gif) 023 mL g−1 h−1. The gas produced during the catalytic reaction was analyzed online using micro gas chromatography (Micro GC Fusion, Inficon, Waste to Energy and Catalyst Laboratory, Ajou University). The CO conversion and selectivity for CH4 and CO2 of the produced gas were calculated using the following equations:
023 mL g−1 h−1. The gas produced during the catalytic reaction was analyzed online using micro gas chromatography (Micro GC Fusion, Inficon, Waste to Energy and Catalyst Laboratory, Ajou University). The CO conversion and selectivity for CH4 and CO2 of the produced gas were calculated using the following equations:Results and discussion
Catalyst characterization
The formation mechanism of the Cu-based yolk–shell catalysts prepared via one-pot spray pyrolysis is described in Scheme 1. Aqueous droplets comprising homogeneously distributed Cu salt, metal (Ce, Zr, and Ti) salts, and sucrose as a carbon source were generated using an ultrasonic nebulizer (Scheme 1-①). These droplets were fed into a vertical quartz reactor tube maintained at 600 °C in an air atmosphere. During spray pyrolysis, the solvent evaporated and the metal salts decomposed, leading to a compact form. Simultaneously, sucrose also decomposed into carbonaceous products, leading to the formation of CuO/MeOx/carbon composite microspheres (Scheme 1-②) as intermediate products. The carbonaceous materials on the outer surface of the CuO/MeOx/carbon microspheres combusted into CO2, forming a rigid CuO/MeOx shell without carbon (Scheme 1-③ and ④). In addition, the consistent application of heat during spray pyrolysis induced thermal contraction of the inner part of the microspheres (Scheme 1-④). In a subsequent stage, further combustion within the core of the microspheres generated a CuO/MeOx yolk (Scheme 1-⑤). In summary, the resulting catalyst featured a yolk–shell structure with a void space between the yolk and shell, composed of CuO/MeOx through continuous combustion and contraction of the sphere. Overall, Cu-based yolk–shell catalysts incorporating CeO2, ZrO2, and TiO2 were successfully synthesized by the one-pot spray pyrolysis process without requiring post-heat treatment.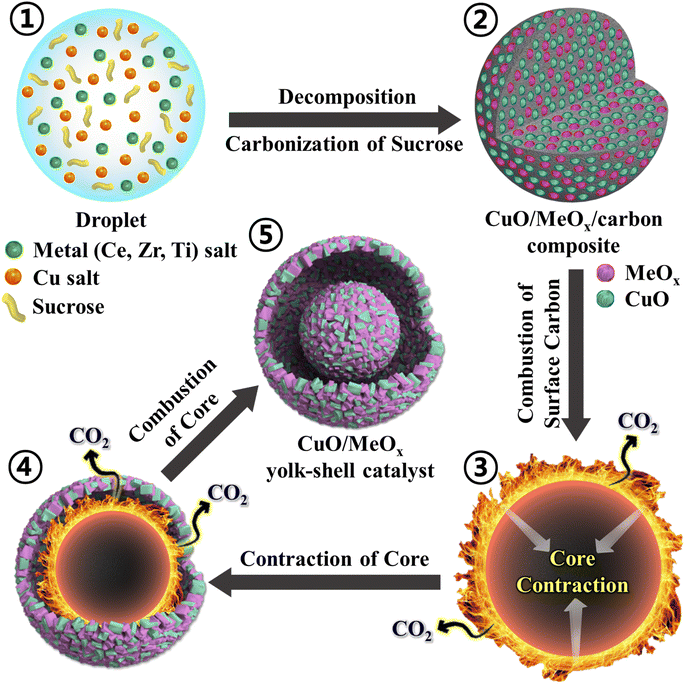 | ||
| Scheme 1 Schematic illustration of the formation mechanism (①–⑤) of the CuO/MeOx yolk–shell catalyst. | ||
Table 1 shows the BET analysis results of the SPC catalysts with various supports. The surface area of the SPCC catalyst was the largest among the prepared catalysts. Notably, the surface area of the SPC catalyst supported on pure supports (e.g., SPCC, SPCT, and SPCZ) without any mixture with other materials was higher. In contrast, the surface areas of the mixed oxides (SPCZC and SPCTC) were smaller than those of the pure supports. According to the literature, the addition of ZrO2 to CeO2 in a ZrCeO2 support synthesized by co-precipitation results in an increase in the surface area due to the transformation of the ZrO2 phase from crystalline into amorphous.21 In contrast, the spray pyrolysis method, which omits the digestion process, results in a decrease in surface area due to the CeO2 and ZrO2 mixture, and ZrO2 retains its crystalline structure, leading to a decrease in the surface area when mixed with CeO2. The surface area of the prepared SPC catalysts decreased in the following order: SPCC (84.2 m2 g−1) > SPCT (80.0 m2 g−1) > SPCZ (61.8 m2 g−1) > SPCZC (52.1 m2 g−1) > SPCTC (30.6 m2 g−1).
| Catalyst | BET surface areaa (m2 g−1) | Cu dispersionb (%) | Crystallite sizeb (nm) | Metallic surface areab (m2 g−1) |
|---|---|---|---|---|
| a Estimated from N2 adsorption at −196 °C. b Estimated from N2O chemisorption. | ||||
| SPCC | 84.2 | 17.1 | 5.1 | 110.4 |
| SPCZ | 61.8 | 3.3 | 26.0 | 21.4 |
| SPCT | 80.0 | 6.8 | 12.7 | 44.0 |
| SPCZC | 52.1 | 9.6 | 9.1 | 61.6 |
| SPCTC | 30.6 | 2.0 | 44.2 | 12.6 |
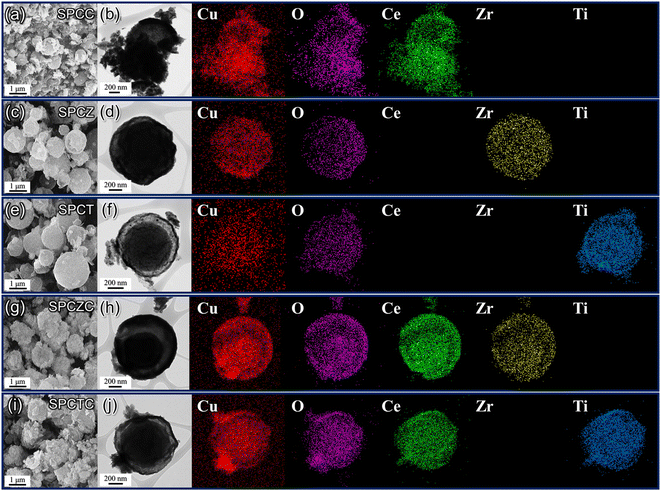
The morphologies of the SPC catalysts prepared with various supports are shown in Fig. S1(a), (c), (e), (g), and (i).† The SPC catalysts produced by spray pyrolysis exhibited rough surfaces and well-dispersed spherical shapes. To verify the shell structure, a physical impact was applied to break the shell, and the results are depicted in Fig. S1 (insets of Fig. S1(a), (c), (e), (g), and (i)†). It was observed that all the fractured SPC catalysts had multiple shells with hollow interiors, displaying a yolk–shell structure. Generally, the spray pyrolysis process is advantageous to prepare uniform spherical particles with controlled stoichiometry by generating aqueous droplets from a precursor solution containing the desired composition using an ultrasonic nebulizer.22–24 As a result, the elemental mapping analysis results demonstrated that the same components were uniformly distributed across each multi-shell layer in all the catalysts (Fig. S1(b), (d), (f), (h), and (j)†). The homogeneous distribution of Cu active species within the support enhances the resistance to sintering of the active metals during the HT-WGS reaction. The yolk–shell structure ensures superior catalytic activity during the reaction compared to dense spherical particles.25–27 As shown in Scheme S1,† the hollow space between the yolk and shell facilitates the penetration of reacting gases and provides numerous Cu active sites for adsorbing CO(g) molecules, not only on the surface of the yolk but also on both the inner and outer surfaces of the shell. As a result, the abundance of active sites enhances the surface absorption of CO gas, thereby improving the overall catalytic efficiency of the SPC.
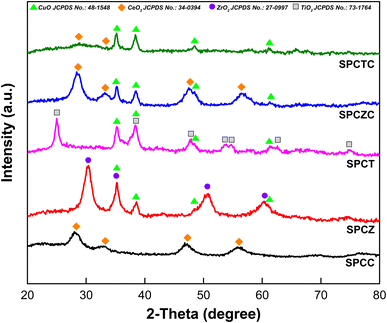
Fig. 1 shows the XRD patterns of fresh SPC catalysts supported on various supports. For the SPCC catalyst, peaks were observed at 28.1°, 33.2°, 47.5°, and 56.1°, corresponding to the distinct cubic structure of CeO2 (JCPDS No. 34-0394).28 The SPCZ catalyst showed a clear crystalline nature, as indicated by the BET surface area results. The XRD diffractogram of the SPCZ catalyst revealed peaks at 30.4°, 35.3°, 50.7°, and 60.4°, attributable to the cubic ZrO2 structure (JCPDS No. 27-0997), which belongs to the Fm3m (face-centered lattice) space group.29,30 For the SPCT catalyst, seven peaks were observed at 25°, 37.6° (overlapping with the CuO diffraction peak), 47.9°, 53.7°, 54.6°, 62.5°, and 74.9°, corresponding to the characteristic peaks of anatase TiO2 (JCPDS No. 73-1764).31–33 The SPCZC catalyst exhibited a trend similar to that of the SPCC catalyst, except for the CuO peak. However, compared to the SPCC catalyst, the major peaks of the SPCZC catalyst were shifted to higher angles. This shift can be attributed to the insertion of Zr into the Ce lattice, resulting in the formation of a solid solution.32 According to the literature, the formation of a ZrCeO2 solid solution enhances the thermal stability, redox properties, and oxygen storage capacity of CeO2.34 Except for the characteristic peaks of CuO, the SPCTC catalyst did not exhibit any peaks corresponding to CeO2 or TiO2, indicating that TiCeO2 has low crystallinity. Notably, no CuO peaks were detected in the SPCC catalyst, which is speculated to be due to the good dispersion of CuO.
Table 1 also displays the copper dispersion data obtained from N2O chemisorption analysis. Among SPC catalysts, the SPCC catalyst supported on CeO2 exhibited the highest copper dispersion (17.1% and 5.1 nm Cu crystallite size). Therefore, the excellent dispersion of Cu in the yolk–shell structure of CeO2 resulted in the absence of CuO peaks in the XRD pattern of the SPCC catalyst. The addition of Zr and Ti to CeO2 resulted in decreased Cu dispersion. Therefore, the SPCZC and SPCTC catalysts exhibited lower copper dispersions than SPCC, with the SPCTC catalyst showing the lowest copper dispersion among the prepared catalysts. The Cu dispersion of the prepared SPC catalysts decreased in the following order: SPCC (17.1%) > SPCZC (9.6%) > SPCT (6.8%) > SPCZ (3.3%) > SPCTC (2.0%). Notably, despite a high Cu content of 20 wt%, the catalysts supported on CeO2 and ZrCeO2 exhibited very high Cu dispersions compared to previously reported liquid- and solid-phase process-based research,8,10,35 highlighting the suitability of spray pyrolysis for uniformly synthesizing materials with certain compositions. In this study, the synthesis of Cu–CeO2 and Cu–ZrCeO2 catalysts resulted in a high dispersion of Cu. The metal crystallite size and surface area were also determined using N2O chemisorption analysis, following a trend consistent with that of the copper dispersion.
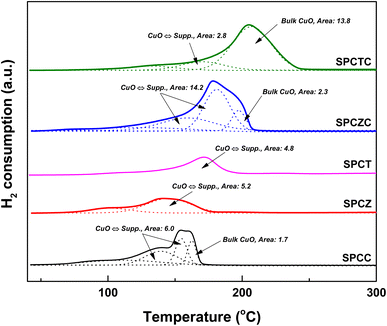
Fig. 2 shows the TPR patterns of the prepared catalysts. The reduction profiles of SPCC and SPCZC were deconvoluted into four peaks with Gaussian line shapes, with an estimated fitting error of less than 3%. The first deconvoluted peak is attributed to the reduction of surface CuO or metallic Cu species, independent of the support. The second and third peaks correspond to the reduction of CuO species dispersed on the support lattice, strongly interacting with the support and active phase of the WGS reaction. The last peak is a characteristic peak of bulk CuO. The reduction profile reflects H2 consumption by the catalyst, and the calculated peak area indicates the amount of the characterized species. The calculated peak areas are shown in Fig. 2. The amount of active Cu species in the SPCZC catalyst (14.2) was approximately 2.4 times higher than that in the SPCC catalyst (6.0). In the SPCTC catalyst, the reduction peak was divided into three, showing a similar configuration to the previous SPCC and SPCZC catalysts. One noteworthy point is that while the amount of Cu active species in the SPCTC catalyst was very small (2.8), the area of the bulk CuO species was the highest (13.8) among all the catalysts, with the most Cu forming bulk CuO species. Most of the active Cu species were formed in the SPCT and SPCZ catalysts (4.8 and 5.2%, respectively). The amount of active Cu species in the prepared catalysts decreases in the following order: SPCZC (14.2) > SPCC (6.0) > SPCZ (5.2) > SPCT (4.8) > SPCTC (2.8). The atomic valence states of Cu and O on the surfaces of the prepared catalysts were characterized by XPS. Additionally, X-ray photoelectron spectroscopy (XPS) was used to verify the amount of active Cu species calculated from the TPR analysis. Fig. 3(a) shows the Cu 2p spectra of SPC catalysts with various supports. The signal detected in the broad range of 931–945 eV indicates the presence of various valence states of Cu species. Satellite peaks at approximately 939–945 eV were assigned to copper oxide species. The detected Cu 2p signal was deconvoluted into two peaks, as shown in Fig. 3(a). The first peak, at a lower binding energy of approximately 933 eV, corresponds to reduced (active) Cu species (Cu0/Cu+).36 The ratio of active Cu species on the surface calculated from the XPS analysis followed the same trend as the amount of active Cu species calculated by TPR analysis. The calculated surface concentrations of the Cu species are listed in Table 2. The ratio of Cu active species on the surface was the highest for the SPCZC catalyst and the lowest for the SPCTC catalyst. The surface ratio of Cu2+ species differed from the TPR-derived values, as XPS reflects surface species ratios, whereas TPR reflects overall reduction performance.
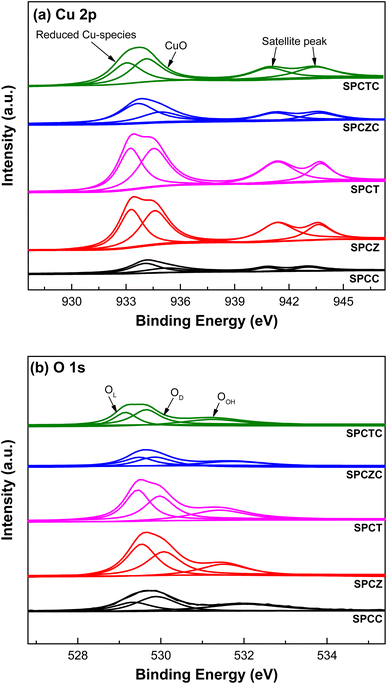 | ||
| Fig. 3 The XPS patterns of the fresh SPC catalysts supported on various supports ((a): Cu 2p and (b): O 1s). | ||
| Catalyst | The surface atomic ratios by XPS (%) | ||
|---|---|---|---|
| Reduced Cu | CuO | OD/(OL + OD + OOH) | |
| SPCC | 54.79 | 45.21 | 38.08 |
| SPCZ | 47.95 | 52.05 | 30.99 |
| SPCT | 45.01 | 54.99 | 27.89 |
| SPCZC | 63.23 | 36.77 | 39.49 |
| SPCTC | 40.51 | 59.49 | 34.08 |
The O 1s spectra of the SPC catalysts on various supports are shown in Fig. 3(b). The spectra were deconvoluted into three peaks.37 The peak near the lowest binding energy of 529 eV corresponds to lattice oxygen (OL). The second peak, near 530 eV, is attributed to the presence of oxygen vacancies or oxygen defects (OD). The last peak, at the highest binding energy, is attributed to hydroxyl groups (OH) on the catalyst surface (OOH). The ratios of oxygen defects to the total number of peaks are summarized in Table 2. According to the literature, the presence of oxygen defects in a catalyst can promote oxygen mobility, providing active sites for the dissociation of H2O molecules.5 Therefore, the more oxygen defects in the catalyst, the more effective the WGS reaction. XPS analysis of the SPCZC catalyst confirmed not only the highest amount of active Cu species but also the highest ratio of oxygen defects. The number of oxygen defects decreased in the following order: SPCZC (39.49%) > SPCC (38.08%) > SPCTC (34.08%) > SPCZ (30.99%) > SPCT (27.89%).
The Ce 3d spectra of the SPCC, SPCZC, and SPCTC catalysts containing a CeO2 support are presented in Fig. S2(a).† The peaks labeled as v (881.7 eV), v′′ (888.1 eV), v′′′ (897.6 eV), u (900.1 eV), u′′ (906.8 eV), and u′′′ (916.0 eV) correspond to CeO2 (the 3d104f0 state of Ce4+), while peaks v′ (883.9 eV) and u′ (901.8 eV) are associated with Ce2O3 (the 3d104f1 state of Ce3+).5 A higher concentration of Ce3+ is associated with a larger number of oxygen defects. The SPCZC catalyst demonstrated the highest Ce3+/Ce4+ ratio, with the ratios decreasing in the following order: SPCZC (23.61%) > SPCC (17.20%) > SPCTC (3.99%). The Zr 3d spectra of SPC catalysts containing ZrO2, namely the SPCZ and SPCZC catalysts, are depicted in Fig. S2(b).† Peaks corresponding to Zr 3d5/2 (182 ± 0.2 eV) and Zr 3d3/2 (184.4 ± 0.3 eV) indicate the presence of Zr–O bonds within the catalysts.38 This demonstrates that Zr exists exclusively in the form of Zr–O configurations in these catalysts. The Ti 2p spectra of the SPCT and SPCTC catalysts, which contain TiO2, are shown in Fig. S2(c).† Both catalysts exhibit Ti 2p3/2 and Ti 2p1/2 peaks, corresponding to Ti4+.39 The Ti 2p3/2 peak is observed at 458 ± 0.3 eV, and the Ti 2p1/2 peak is observed at 464 ± 0.2 eV.
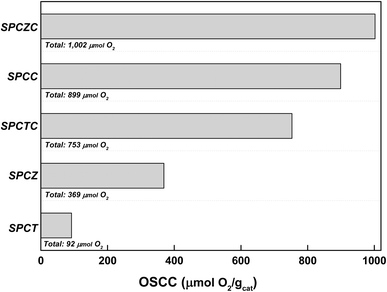
To further analyze the ratio of oxygen defects observed in the XPS analysis, the oxygen storage complete capacity (OSCC) was investigated through hydrogen–oxygen pulse chemisorption (Fig. 4). The OSCC analysis provides information on the maximum redox capacity of the catalyst, which is directly related to the concentration of oxygen defects.40,41 As shown in the XPS O 1s spectra, the calculated oxygen defect concentration from the OSCC analysis followed the same trend as the surface defect oxygen. The SPCZC catalyst displayed the highest oxygen adsorption capacity (1002 μmolO2 gcat−1), while the SPCT catalyst showed the lowest (92 μmolO2 gcat−1). These results indicate that Zr enhances the maximum redox capacity of Ce by increasing the concentration of oxygen defects, whereas Ti does not. Additionally, zirconium and titanium exhibit lower maximum redox capacities than cerium. As mentioned earlier, oxygen defects in the catalyst enhance the mobility of oxygen, and a high concentration of oxygen defects is expected to improve the activity for the WGS reaction.
Reaction results
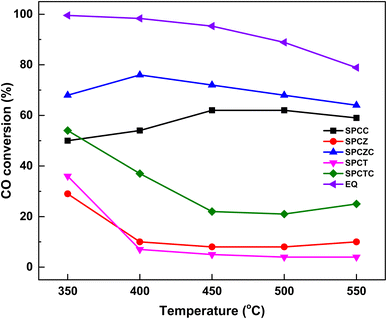
To develop a high-performance HT-WGS catalyst based on Cu with a yolk–shell structure, the catalytic reaction was conducted at a high GHSV of 25![[thin space (1/6-em)]](https://www.rsc.org/images/entities/char_2009.gif) 023 h−1. To enhance the practical applicability of the developed catalyst, a synthetic gas was used to simulate the gas composition generated downstream of an actual combustible waste gasifier. Fig. 5 shows the CO conversion rates for the catalysts studied and thermodynamic equilibrium (EQ) of the WGS reaction. The SPCZC catalyst exhibited the highest CO conversion rate across all temperature ranges, followed by the SPCC catalyst. From the HT-WGS reaction results, the concentration of oxygen defects and the quantity of active Cu species significantly influence catalyst performance. Notably, the SPCTC catalyst exhibited the third-highest activity, which is attributed to its relatively high concentration of oxygen defects, despite having the lowest amount of active Cu species derived from the TPR and XPS analyses compared to SPCZ and SPCT. Thus, of the two factors influencing the HT-WGS reaction (concentration of oxygen defects and quantity of active Cu species), the concentration of oxygen defects appears to play a more significant role. Among the reductive oxides (ceria, zirconia, and titania), ceria proved to be the most suitable Cu-based catalyst for the HT-WGS reaction due to its superior redox capacity compared to zirconia and titania supports. Additionally, incorporating zirconium into ceria to form a ceria–zirconia support further increased the concentration of oxygen defects, thereby enhancing the redox capacity and more effectively converting Cu into its active state, leading to superior catalytic performance in the HT-WGS reaction. However, mixing titania with ceria slightly reduced the concentration of oxygen defects and promoted Cu bulk transformation, resulting in lower catalytic activity compared to pure ceria.
023 h−1. To enhance the practical applicability of the developed catalyst, a synthetic gas was used to simulate the gas composition generated downstream of an actual combustible waste gasifier. Fig. 5 shows the CO conversion rates for the catalysts studied and thermodynamic equilibrium (EQ) of the WGS reaction. The SPCZC catalyst exhibited the highest CO conversion rate across all temperature ranges, followed by the SPCC catalyst. From the HT-WGS reaction results, the concentration of oxygen defects and the quantity of active Cu species significantly influence catalyst performance. Notably, the SPCTC catalyst exhibited the third-highest activity, which is attributed to its relatively high concentration of oxygen defects, despite having the lowest amount of active Cu species derived from the TPR and XPS analyses compared to SPCZ and SPCT. Thus, of the two factors influencing the HT-WGS reaction (concentration of oxygen defects and quantity of active Cu species), the concentration of oxygen defects appears to play a more significant role. Among the reductive oxides (ceria, zirconia, and titania), ceria proved to be the most suitable Cu-based catalyst for the HT-WGS reaction due to its superior redox capacity compared to zirconia and titania supports. Additionally, incorporating zirconium into ceria to form a ceria–zirconia support further increased the concentration of oxygen defects, thereby enhancing the redox capacity and more effectively converting Cu into its active state, leading to superior catalytic performance in the HT-WGS reaction. However, mixing titania with ceria slightly reduced the concentration of oxygen defects and promoted Cu bulk transformation, resulting in lower catalytic activity compared to pure ceria.
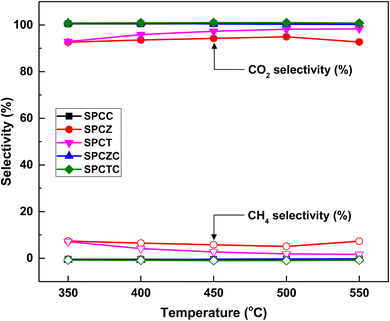
The WGS reaction selectively converts CO in syngas to CO2 while generating additional H2. The methanation reaction is a major side reaction of the WGS reaction that consumes excess hydrogen to produce methane, making CO2 and CH4 selectivities critical. Catalysts with a CO2 selectivity close to 100% and CH4 selectivity near 0% are considered highly selective. Fig. 6 shows the CO2 and CH4 selectivities for all the fabricated catalysts. All catalysts containing ceria (i.e., SPCC, SPCZC, and SPCTC) demonstrated a CO2 selectivity of 100% and CH4 selectivity of 0%, confirming the absence of side reactions.42 Conversely, the SPCZ and SPCT catalysts, which did not contain ceria, exhibited methanation side reactions. Hence, ceria serves as a support component that effectively suppresses the methanation side reactions in the HT-WGS process. The SPCZ catalyst displayed a CO2 selectivity of 93% (7% CH4 selectivity) across all temperatures, while the SPCT catalyst initially exhibited 93% CO2 selectivity, with a gradual trend toward eliminating side reactions. The methanation reaction involves 3 moles of hydrogen with one mole of carbon monoxide to produce one mole of methane and one mole of water (3H2 + CO → CH4 + H2O). Methanation reduces hydrogen production, making catalysts exhibiting this side reaction unsuitable for the WGS reaction.
To evaluate the stability of the copper-based catalysts synthesized by the spray pyrolysis method, the results of the HT-WGS reaction conducted at 400 °C for 50 h are presented in Fig. 7(a). The reaction temperature of 400 °C was selected because it not only highlights the difference in reaction activity but also stimulates the temperature at which synthetic gas is obtained in the downstream process of the waste gasification procedure.43 Notable observations emerged from the long-term stability evaluation results. All catalysts, except SPCZC, exhibited a significant decline in catalytic activity within the initial 2–3 h. The SPCZC catalyst also exhibited deactivation for up to 30 hours (from 76% to 61%, a decrease of 15%), but stabilized thereafter. In contrast, the SPCC catalyst initially exhibited a 55% CO conversion rate, which sharply dropped to 44% within 30 min and gradually decreased further to 31.4%, meaning a 43% reduction in activity from the initial level. Similarly, the SPCTC catalyst showed a 17% reduction in the CO conversion rate within the first 2 h compared to its initial activity, followed by a slow decline over 10 h, resulting in a total activity drop of 48%. The SPCZ and SPCT catalysts demonstrated sharp declines in catalytic activity within the first 2 h, with CO conversion rates as low as 7% and 4%, respectively. A closer examination of catalyst deactivation trends over the first 10 hours is provided in Fig. 7(b).
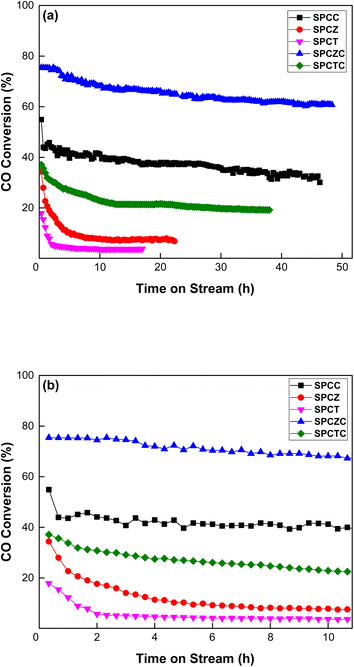 | ||
| Fig. 7 The stability evaluation results of the SPC catalysts at 400 °C for 50 hours ((a): 50 hours and (b): narrowed down to 10 hours). | ||
Detailed study of catalyst deactivation
To investigate the deactivation mechanisms, detailed characterization of the catalysts was conducted. Fig. 8 depicts the XRD analysis results of the catalysts after 50 h of the HT-WGS reaction at 400 °C. As shown in Fig. 8, the XRD analysis results of the fresh catalysts are overlapped with dashed lines to illustrate the differences compared to those of the used catalysts. For the SPCTC catalyst, only a change in the peak intensity was observed, likely due to its low crystallinity. No peaks associated with TiCeO2 were detected in the used catalyst. Additionally, while the fresh catalyst showed CuO peaks due to copper oxidation during the calcination process, the peak intensity of CuO decreased as it was reduced to metallic copper during the reaction. However, unlike other catalysts, no metallic copper peaks were observed. Apart from SPCTC, characteristic peaks of metallic Cu were observed for the other catalysts. In the case of the SPCZC and SPCC catalysts, there was no significant change compared to the fresh catalyst, with the CuO peaks disappearing and replaced by metallic Cu peaks. For the SPCT and SPCZ catalysts, metallic Cu was transformed into sintered clusters with distinct peaks. Notably, unlike the other catalysts containing ceria, peaks associated with graphitic carbon were observed. Thus, it can be inferred that catalyst deactivation occurred because of coke formation on the SPCT and SPCZ catalysts.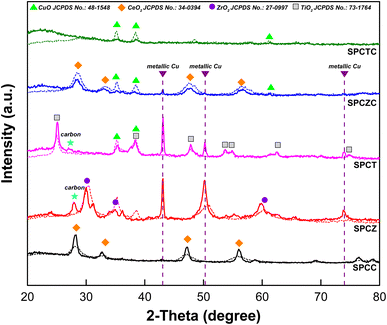 | ||
| Fig. 8 The XRD analysis results of the fresh catalysts overlapped with dashed lines to illustrate the differences compared to the used catalysts. | ||
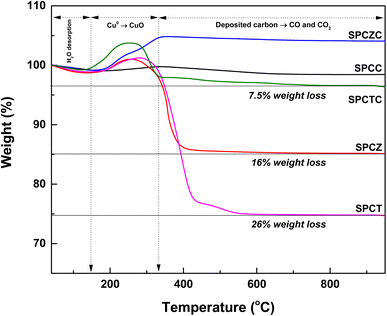
At high temperatures, the primary deactivation mechanism for Cu-based catalysts is Cu sintering. Sintered copper particles aggregate, reducing their dispersion. To verify this, the Cu dispersion in the catalyst used in the stability test was measured. Fig. 9 presents the N2O-chemisorption analysis results of the catalysts tested during the HT-WGS reaction for 50 h at 400 °C. Based on the catalyst stability test results, the Cu dispersion measurements of the used catalysts clearly indicated that the primary cause of deactivation in all the catalysts, except SPCZC, was Cu sintering. The SPCZC catalyst, which displayed relatively stable catalytic activity, showed a decrease in dispersion by approximately 10%, confirming that it maintained high catalytic activity through significant resistance to Cu sintering, even after 50 h of reaction. In contrast, the SPCC catalyst, despite having the highest dispersion among the fresh catalysts, exhibited a reduction in dispersion of over 56%. This reflects the rapid deactivation observed during the initial stage of the reaction due to drastic Cu sintering in the SPCC catalyst. The SPCTC catalyst, despite its initially low dispersion, demonstrated a 15% reduction. The Cu dispersion rates of the SPCZ and SPCT catalysts decreased by 48.5% and 44.1%, respectively. Accordingly, the actual CO conversion rates decreased substantially by 79.4% (from 34% to 7%) and 77.8% (from 18% to 4%). The higher rate of catalyst activity compared to the decrease in Cu dispersion is likely due to the graphitic carbon peak observed in the XRD analysis of the used catalysts, suggesting that both Cu sintering and additional carbon deposition contributed to deactivation by blocking active sites. To validate the speculated carbon deposition inferred from the XRD and N2O-chemisorption results of the used catalysts, TGA analysis was conducted on the catalysts tested for 10 h at 400 °C (Fig. 10). This duration was chosen to capture the complete deactivation of the SPCZ and SPCT catalysts (where carbon deposition is suspected to occur) after 10 h, but also to elucidate the detailed catalyst deactivation pathway. Up to 150 °C, the initial weight loss is detected, which is caused by the thermal desorption of H2O on the catalyst surface. From 150 °C to 330 °C, weight increased by 1–4%, which is due to the oxidation of reduced metallic Cu species to CuO species. The SPCZC and SPCC catalysts did not exhibit any weight changes above 330 °C, indicating the absence of carbon deposition. In contrast, the SPCTC, SPCZ, and SPCT catalysts demonstrated a weight loss beyond 330 °C, suggesting the conversion of deposited carbon to CO or CO2.44 The weight reduction rates revealed that the SPCT catalyst exhibited the highest carbon deposition, followed by the SPCZ and SPCTC catalysts. Carbon deposition at active sites blocked catalyst–reactant interactions, leading to deactivation. Therefore, it was confirmed that the SPCTC, SPCZ, and SPCT catalysts were deactivated by carbon deposition and Cu sintering.
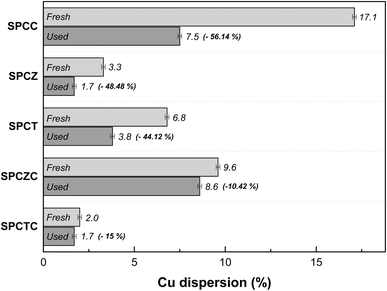 | ||
| Fig. 9 The N2O-chemisorption analysis results of the catalysts that were tested during the HT-WGS reaction for 50 hours at 400 °C. | ||
Fig. 11 shows the BET surface area analysis results for the catalysts tested during the HT-WGS reaction for 50 h at 400 °C. Interestingly, no significant reduction in BET surface area was observed for the deactivated SPCTC, SPCZ, and SPCT catalysts. Although these three types of catalysts experienced deactivation due to Cu sintering and carbon deposition, the surface area of the catalysts remains stable (within the margin of error), suggesting that the yolk–shell structures were well maintained. The SPCZC catalyst showed stable catalytic activity and exhibited a slight reduction in BET surface area (approximately 15%). The most notable data come from the SPCC catalyst, which displayed a sharp decrease in surface area (approximately 86%) compared to its initial value. Despite its initially high catalytic performance, the rapid deactivation of the SPCC catalyst is attributed to the failure to maintain its yolk–shell structure.
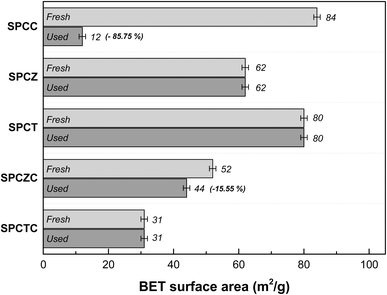 | ||
| Fig. 11 The BET surface area analysis results of the catalysts that were tested during the HT-WGS reaction for 50 hours at 400 °C. | ||
Based on the BET analysis results of the used catalysts, FE-SEM analysis was conducted to investigate the preservation of the structure of the catalysts after 50 h of the HT-WGS reaction at 400 °C. Fig. 12 shows that the SPCTC, SPCZ, and SPCT catalysts, which did not exhibit a decrease in BET surface area after use, maintained their yolk–shell structure. The SPCZC catalyst also showed a slight decrease in the BET surface area and appeared to maintain its yolk–shell structure. However, the SPCC catalyst exhibited complete shell destruction, which explains its significant loss of surface area.
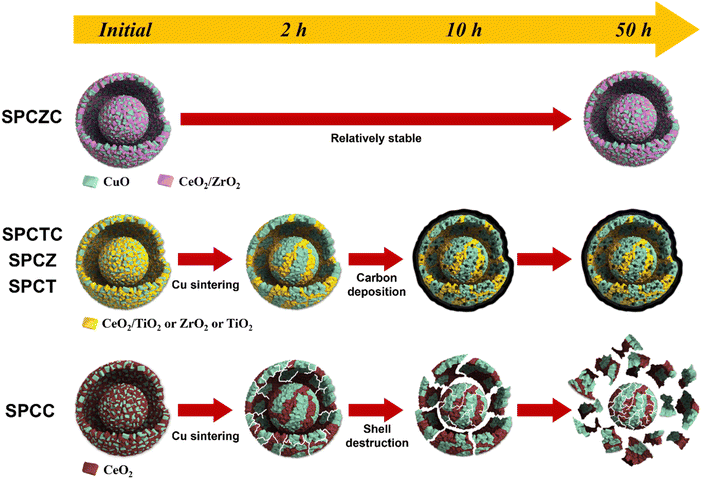
To clarify the deactivation pathway, it was necessary to analyze not only the initial characteristics and post-50 hour reaction properties, but also the characteristic analysis of the catalyst used for 2 h or 10 h of reaction (including the SPCC catalyst). Additionally, the TGA results after 10 h of the reaction were analyzed to clarify the deactivation mechanisms. Fig. 13(a)–(e) illustrate the changes in activity and characteristics for each catalyst over time. For the SPCC catalyst, a continuous decrease in Cu dispersion and CO conversion rate was observed as the reaction time progressed. Carbon deposition was absent in the TGA analysis results (10 h), and in the XRD analysis results (50 h). Based on the BET analysis, it is believed that severe Cu sintering, along with shell cracking or destruction, occurred within the initial 2 h. From 2 to 10 h, the BET surface area remained unchanged, but the continued shell destruction led to a final surface area of 12 m2 g−1 after 50 h. The deactivation processes for all catalysts, including the SPCC catalyst, are depicted in Scheme 2. The deactivation pathway for the SPCC catalyst proceeds as follows: (1) rapid Cu sintering, shell cracking or destruction; (2) continuous Cu sintering and shell destruction and (3) shell destruction and activity degradation. SPCZ, SPCT, and SPCTC exhibit similar deactivation pathways. All three catalysts underwent rapid Cu sintering within the first 2 h, with no additional sintering afterward. However, CO conversion rates continued to decrease until 10 h, indicating that additional catalyst deactivation occurred due to carbon deposition. After 10 h, the catalysts exhibited very low CO conversion rates, indicating full deactivation. BET and FE-SEM results confirmed that no structural destruction occurred in the SPCZ, SPCT, or SPCTC catalysts. Therefore, the deactivation pathways of the three catalysts are as follows: (1) an initial activity decrease due to rapid Cu sintering, (2) continuous activity decline caused by carbon deposition, and (3) complete catalyst deactivation within 10 h. The SPCZC catalyst showed no decline in activity within the initial 2 h, and slow Cu sintering occurred over the next 10 h. It maintained Cu dispersion and BET surface area until 50 h, with activity stabilizing after 30 h, and no further deactivation. However, a detailed study revealed that the ability to maintain the shell structure and prevent coke formation depends on the support material composition. Specifically, shells composed of TiCeO2, ZrO2, and TiO2 may fail to prevent deactivation. Therefore, it was confirmed that the synthesis of a support material with ceria-added zirconia in a yolk–shell structure demonstrated excellent Cu sintering resistance and structural stability (Fig. S3†).
 | ||
| Fig. 13 The changes in activity and characteristics of each catalyst over time on stream (a) SPCC, (b) SPCZ, (c) SPCT, (d) SPCZC, and (e) SPCTC. | ||
Feasibility evaluation of the SPCZC catalyst and summary
In industrial processes, catalysts often undergo repeated usage cycles, not only for regeneration but also for daily start-up and shutdown (DSS) operations. The ability of a catalyst to endure these cycles without a significant loss of activity is crucial for practical applications. To assess the reusability of the SPCZC catalyst, we performed additional cycling tests that simulated industrial conditions, including repeated start-ups and shutdowns. The goal was to understand how SPCZC responded over an extended operational period. A reusable catalyst offers long-term advantages by reducing the need for frequent replacement. To substantiate this, the chemical properties of the SPCZC catalyst were confirmed using XPS and OSCC analyses (Fig. S4 and Table S1†). Table S1† lists the OSCC values for both the fresh and used catalysts. The used SPCZC catalysts exhibited a high OSCC value of 1018 μmolO2 gcat−1 (fresh SPCZC catalyst: 1002 μmolO2 gcat−1) after the DSS reaction, indicating that its excellent chemical properties were regenerated and maintained during the reduction step. Table S1 and Fig. S4† present the XPS profiles of Cu, Ce, and O in the fresh and used SPCZC catalysts. The XPS analysis of the used SPCZC catalyst was similar to that of the fresh SPCZC catalyst, confirming that catalyst deactivation was not due to a decrease in chemical properties. The results of the cycling tests offer a more rounded view of the potential of SPCZC in industrial situations, emphasizing its reliability under practical operational conditions. Fig. 14 presents the reevaluation results for the SPCZC catalyst. To assess the reusability of the catalyst, the reaction gas supply was stopped after the first reaction, and the reactor was cooled to room temperature. Subsequently, the catalyst was reduced, and the reaction was repeated five times. After applying the SPCZC catalyst to the HT-WGS reaction for the first time and subsequent regeneration through a reduction process, the catalyst exhibited a 7% decrease in activity during the second run. In the third reaction, an additional 4% decrease was observed, leading to an overall 11% decrease in activity. By the fourth reaction, the CO conversion rate decreased by 13% compared to the initial rate. From the fifth HT-WGS reaction onward, the conversion rate remained consistent with that of the fourth reaction. This indicates that while the chemical properties of the catalyst, such as OSCC, are regenerated during the reduction process (Fig. S4 and Table S1†), the physical properties, such as the Cu particle size and BET surface area, are irreversible. A comparison of the physical structures of fresh and used SPCZC catalysts is shown in Fig. 15. Images of the fresh SPCZC catalyst are presented in Fig. 15(a)–(d), and those of the used SPCZC catalyst are shown in Fig. 15(e)–(h). According to the FE-SEM and TEM images, the SPCZC catalyst maintained its multi-shell structure even after the HT-WGS reaction. The HR-TEM images (Fig. 15(c)) reveal ultrafine nanocrystals with lattice fringes separated by 0.310 nm, corresponding to the (111) crystal plane of cubic Ce0.75Zr0.25O2. The HR-TEM image of SPCZC (Fig. 15(g)) shows the same lattice fringe values for the Ce0.75Zr0.25O2 (111) crystal plane, indicating that the main (111) crystal plane of the Ce0.75Zr0.25O2 support remained unchanged after the catalytic reaction. The fresh SPCZC catalyst exhibits lattice fringes with a spacing of 0.196 nm, which matches the CuO (![[1 with combining macron]](https://www.rsc.org/images/entities/char_0031_0304.gif) 12) crystal plane. The used SPCZC catalyst shows lattice fringes with a spacing of 0.275 nm, corresponding to the CuO (
12) crystal plane. The used SPCZC catalyst shows lattice fringes with a spacing of 0.275 nm, corresponding to the CuO (![[1 with combining macron]](https://www.rsc.org/images/entities/char_0031_0304.gif) 10) crystal plane. Therefore, the lattice fringes observed for the CuO phase in HR-TEM images of both fresh and used catalysts suggest that the CuO species remained stable without phase transformation during the catalytic reaction. Additionally, TEM images of the fresh catalyst (Fig. 15(c)) revealed CuO nanocrystals with a mean size of 5 nm, which increased to about 8 nm after the reaction (Fig. 15(g)), indicating slight sintering of the CuO species. Despite the SPCZC catalyst being exposed to a high temperature of 400 °C during the CO conversion reaction, these results demonstrate the strong sintering resistance and structural stability of the Ce0.75Zr0.25O2 support, which was homogeneously formed through the spray pyrolysis process. Moreover, the selected area electron diffraction (SAED) patterns in Fig. 15(d) and (h) indicate the presence of phase-pure Ce0.75Zr0.25O2 solid solution and a single-crystalline CuO phase. The level of deactivation was consistent with the results of the 50 hour long-term stability test. Therefore, the SPCZC catalyst not only exhibited high initial activity but also demonstrated long-term stability and recyclability. The XPS analysis results of the other SPC catalysts, excluding the SPCZC catalyst, are shown in Fig. S5 and Table S2.†
10) crystal plane. Therefore, the lattice fringes observed for the CuO phase in HR-TEM images of both fresh and used catalysts suggest that the CuO species remained stable without phase transformation during the catalytic reaction. Additionally, TEM images of the fresh catalyst (Fig. 15(c)) revealed CuO nanocrystals with a mean size of 5 nm, which increased to about 8 nm after the reaction (Fig. 15(g)), indicating slight sintering of the CuO species. Despite the SPCZC catalyst being exposed to a high temperature of 400 °C during the CO conversion reaction, these results demonstrate the strong sintering resistance and structural stability of the Ce0.75Zr0.25O2 support, which was homogeneously formed through the spray pyrolysis process. Moreover, the selected area electron diffraction (SAED) patterns in Fig. 15(d) and (h) indicate the presence of phase-pure Ce0.75Zr0.25O2 solid solution and a single-crystalline CuO phase. The level of deactivation was consistent with the results of the 50 hour long-term stability test. Therefore, the SPCZC catalyst not only exhibited high initial activity but also demonstrated long-term stability and recyclability. The XPS analysis results of the other SPC catalysts, excluding the SPCZC catalyst, are shown in Fig. S5 and Table S2.†
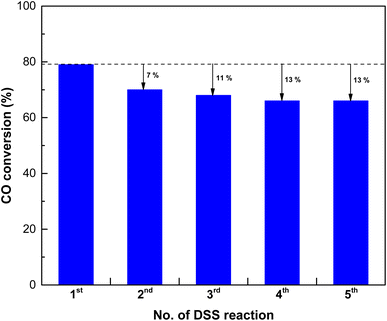 | ||
| Fig. 14 The reuse evaluation results of the SPCZC catalyst over the daily start-up and shut-down (DSS) reaction. | ||
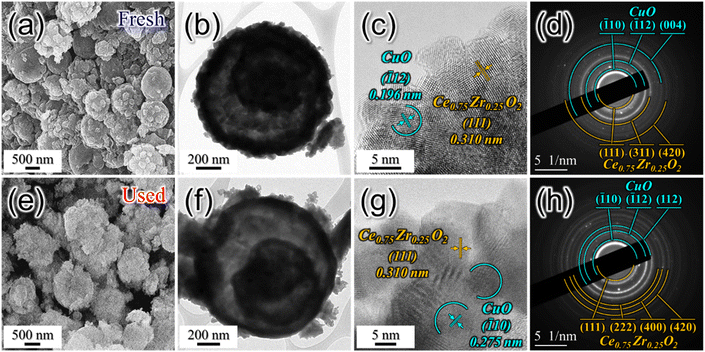 | ||
| Fig. 15 Comparative analysis of fresh and used SPCZC catalyst properties for the HT-WGS reaction: FE-SEM images (a and e), TEM images (b and f), HR-TEM images (c and g), and SAED patterns (d and h). | ||
Fig. 16 shows the relationship between chemical properties and initial catalytic activity, as well as the correlation between physical properties and catalyst stability. For Cu catalysts supported on reducible supports, the oxygen storage capacity and amount of defective oxygen are key properties in the HT-WGS reaction of syngas derived from waste gasification. The number of active Cu species only partially influenced the results. Although the SPCTC catalyst contained the fewest active Cu species, its initial activity was higher than that of the SPCZ catalyst due to its more than twofold higher OSCC. The inclusion of Ce in the synthesized catalysts significantly enhanced their OSCC and initial activity. While the physical properties of the catalysts did not correlate strongly with the initial activity, they were related to catalyst stability. Catalysts with poor physical properties exhibited lower CO conversion rates. Except for the SPCZC catalyst, those with sharply deteriorated physical properties showed significant deactivation, with additional carbon deposition occurring on the SPCTC, SPCZ, and SPCT catalysts, leading to a substantial decline in performance. In contrast, the SPCZC catalyst displayed stable catalytic behavior with high initial activity. These results provide deeper insights into how the dispersion and stability of the Cu-based catalysts influence their initial activity and long-term stability.
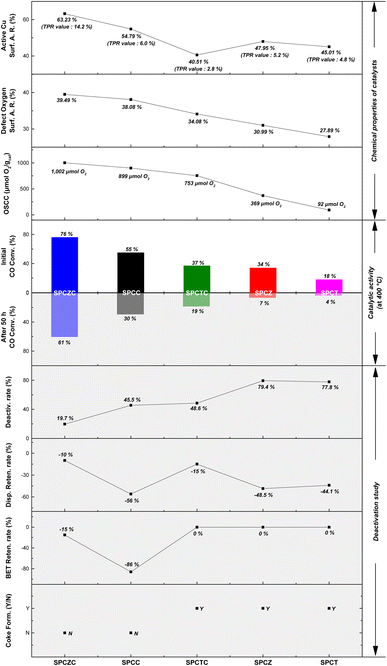 | ||
| Fig. 16 The relationships between the chemical properties of the catalysts, their catalytic performances, and the physico-chemical properties of the used catalysts. | ||
The Cu loadings and dispersions of the Cu-based catalysts are shown in Fig. 17. The SPCC and SPCZC catalysts developed in this study exhibited higher Cu dispersion than previously reported catalysts. This can be attributed to the high dispersion observed using spray pyrolysis, along with the interactions between the Cu–CeO2 and Cu–ZrCeO2 catalysts. The reaction conditions for each catalyst are listed in Table 3. Despite the high treatment capacity (25![[thin space (1/6-em)]](https://www.rsc.org/images/entities/char_2009.gif) 023 h−1) and high concentration of carbon monoxide for the SPCZC catalyst, it exhibited high CO conversion rates and superior dispersion.
023 h−1) and high concentration of carbon monoxide for the SPCZC catalyst, it exhibited high CO conversion rates and superior dispersion.
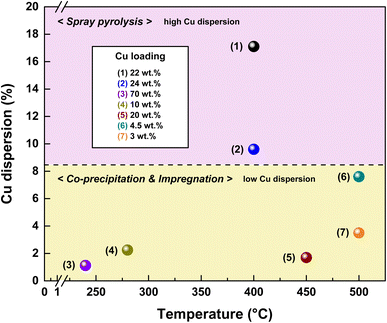 | ||
| Fig. 17 The comparison of reported Cu loading and Cu dispersion of Cu-based catalysts according to preparation methods. (1) Spray pyrolysis Cu–CeO2 (SPCC); (2) spray pyrolysis Cu–ZrCeO2 (SPCZC); (3) 70Cu20Zn10Al;8 (4) Cu–Ce/CeO2;35 (5) Ce/Cu/γ-Al2O3;10 (6) CuO/NiO/ZrO2–CeO2;45 CuO/Fe2O3/Cr2O3.45 | ||
| No. | Catalysts | X CO, T (°C) | GHSV (h−1) | Cu dispersion (%) | Cu loading (wt%) | Ref. |
|---|---|---|---|---|---|---|
| (1) | Cu–CeO2 (SPCC) | 54%, 400 °C | 25![[thin space (1/6-em)]](https://www.rsc.org/images/entities/char_2009.gif) 023 023 |
17.1 | 22 | This study |
| (2) | Cu–ZrCeO2 (SPCZC) | 76%, 400 °C | 25![[thin space (1/6-em)]](https://www.rsc.org/images/entities/char_2009.gif) 023 023 |
9.6 | 24 | This study |
| (3) | 70Cu20Zn10Al | 94.9%, 210 °C | 8000 | 1.12 | 70 | 8 |
| (4) | Cu–Ce/CeO2 | 18.4%, 280 °C | 36![[thin space (1/6-em)]](https://www.rsc.org/images/entities/char_2009.gif) 080 080 |
2.25 | 10 | 35 |
| (5) | Ce/Cu/γ-Al2O3 | 78%, 450 °C | 50![[thin space (1/6-em)]](https://www.rsc.org/images/entities/char_2009.gif) 056 056 |
1.7 | 20 | 10 |
| (6) | CuO/NiO/ZrO2–CeO2 | 69.7%, 500 °C | — | 7.6 | 4.5 | 45 |
| (7) | CuO/Fe2O3/Cr2O3 (commercial cat.) | 60.1%, 500 °C | — | 3.5 | 3 | 45 |
| (8) | Cu–1Nb–CeO2 | 67%, 400 °C | 72![[thin space (1/6-em)]](https://www.rsc.org/images/entities/char_2009.gif) 152 152 |
0.63 | 80 | 46 |
| (9) | 1Cu1Ni/CeAl | 97%, 380 °C | 12![[thin space (1/6-em)]](https://www.rsc.org/images/entities/char_2009.gif) 000 000 |
— | 7.8 | 47 |
| (10) | CuZn/CeO2–Al2O3 | 100%, 250 °C | 9000 | — | 15 | 48 |
| (11) | Cu/CeO2–CHC | 80%, 360 °C | 36![[thin space (1/6-em)]](https://www.rsc.org/images/entities/char_2009.gif) 201 201 |
3.94 | 20 | 49 |
| (12) | FAC-PC-3-240 | 95.4%, 350 °C | 40![[thin space (1/6-em)]](https://www.rsc.org/images/entities/char_2009.gif) 057 057 |
5.6 | 10 | 9 |
Conclusion
In this study, we confirmed that synthesizing copper zirconia-ceria catalysts using spray pyrolysis resulted in highly dispersed copper and prevented the sintering of Cu, even under severe conditions of high temperature and high CO concentration. Additionally, zirconia effectively enhanced the OSCC and the amount of defective oxygen in ceria, leading to the superior performance of the SPCZC catalyst in the HT-WGS reaction using waste-derived syngas. The SPCZC catalyst achieved a CO conversion rate of 76% at a relatively high reaction temperature of 400 °C with real waste-derived syngas containing approximately 38% CO and maintained stable catalytic activity for 50 h. Furthermore, the SPCZC catalyst exhibited only a 13% decrease in activity after four reuse cycles and maintained its performance afterward, highlighting its strong reusability. Catalyst deactivation has been studied. The analysis of the physical characteristics as a function of the catalyst reaction time revealed that the SPCC catalyst underwent rapid sintering of Cu within the initial 2 h. Simultaneously, the shell gradually collapsed, resulting in a loss of surface area and subsequent catalyst deactivation. The SPCTC, SPCZ, and SPCT catalysts also underwent Cu sintering within 2 h and deactivated due to carbon deposition. Additionally, the SPCZ and SPCT catalysts were unsuitable for the target reaction due to methane formation during deactivation. In summary, we developed a Cu catalyst with high activity and stability at elevated temperatures for producing high-purity hydrogen from waste. This catalyst holds promise as an alternative to Fe-based catalysts.Data availability
The data supporting this article have been included as part of the ESI.†Author contributions
Conceptualization: [Won-Jun Jang], [Jung Sang Cho], [Jae-Oh Shim]; investigation: [Kun Woo Baek], [Chang-Hyeon Kim], [Jae Seob Lee], [Ji-Hyeon Gong]; writing – original draft: [I-Jeong Jeon]; data curation: [Kun Woo Baek], [Chang-Hyeon Kim], [Jae Seob Lee], [Ji-Hyeon Gong], [Won-Jun Jang], [Jae-Oh Shim]; visualization: [Jae Seob Lee]; supervision: [Won-Jun Jang], [Jung Sang Cho], [Jae-Oh Shim]; project administration: [Jung Sang Cho]; funding acquisition: [Jae-Oh Shim].Conflicts of interest
The authors declare that they have no conflict of interest.Acknowledgements
This paper was supported by Wonkwang University in 2024.References
- S. Dahiya, Y. Lingam and S. V. Mohan, Understanding Acidogenesis owards Green Hydrogen and Volatile Fatty Acid Production – Critical Analysis and Circular Economy Perspective, Chem. Eng. J., 2023, 464, 141550 CrossRef CAS.
- Z. Xu, H. Qi, D. Yao, J. Zhang, Z. Zhu, Y. Wang and P. Cui, Modeling and Comprehensive Analysis of Food Waste Gasification Process for Hydrogen Production, Energy Convers. Manage., 2022, 258, 115509 CrossRef CAS.
- V. Segneri, J. H. Ferrasse, A. Trinca and G. Vilardi, An Overview of Waste Gasification and Syngas Upgrading Processes, Energies, 2022, 15, 6391 CrossRef.
- R.-R. Lee, I.-J. Jeon, W.-J. Jang, H.-S. Roh and J.-O. Shim, Advances in Catalysts for Water–Gas Shift Reaction Using Waste-Derived Synthesis Gas, Catalysts, 2023, 13, 710 CrossRef CAS.
- J.-O. Shim, H.-S. Na, A. Jha, W.-J. Jang, D.-W. Jeong, I. W. Nah, B.-H. Jeon and H.-S. Roh, Effect of Preparation Method on the Oxygen Vacancy Concentration of CeO2-Promoted Cu/γ-Al2O3 Catalysts for HTS Reactions, Chem. Eng. J., 2016, 306, 908–915 CrossRef CAS.
- K.-W. Jeon, J.-W. Park, R.-R. Lee, J.-H. Gong, W.-J. Jang, J.-O. Shim and Y.-W. Ju, Facile Synthesis of CuFe2O4 Catalyst by the Electrospinning Method to Produce Hydrogen via the Water Gas Shift of Waste-Derived Syngas, J. Environ. Chem. Eng., 2023, 11, 110105 CrossRef CAS.
- J.-H. Gong, K.-W. Jeon, M.-J. Kim, S. Back, J.-O. Shim, H.-S. Roh and W.-J. Jang, Design of High-Temperature Shift Using Waste-Derived Synthesis Gas: Thermodynamic Approach and Practical Reaction Optimization, Energy Convers. Manage., 2023, 293, 117509 CrossRef CAS.
- J. Lee, D. Shin, E. Lee, C. Li, J. M. Kim, J. W. Han and D. H. Kim, Alleviating Inhibitory Effect of H2 on Low-Temperature Water-Gas Shift Reaction Activity of Pt/CeO2 Catalyst by Forming CeO2 Nano-Patches on Pt Nano-Particles, Appl. Catal., B, 2022, 305, 121038 CrossRef CAS.
- W.-J. Jang, J.-O. Shim, K.-W. Jeon, H.-S. Na, H.-M. Kim, Y.-L. Lee, H.-S. Roh and D.-W. Jeong, Design and Scale-Up of a Cr-Free Fe-Al-Cu Catalyst for Hydrogen Production from Waste-Derived Synthesis Gas, Appl. Catal., B, 2019, 249, 72–81 CrossRef CAS.
- Y. Ye, L. Wang, S. Zhang, Y. Zhu, J. Shan and F. Tao, The Role of Copper in Catalytic Performance of a Fe–Cu–Al–O Catalyst for Water Gas Shift Reaction, Chem. Commun., 2013, 49, 4385–4387 RSC.
- X.-F. Ye, S. R. Wang, J. Zhou, F. R. Zeng, H. W. Nie and T. L. Wen, Assessment of the Performance of Ni-Yttria-Stabilized Zirconia Anodes in Anode-Supported Solid Oxide Fuel Cells Operating on H2–CO Syngas Fuels, J. Power Sources, 2010, 195, 7264–7267 CrossRef CAS.
- O. Yalcin, S. Sourav and I. E. Wachs, Design of Cr-Free Promoted Copper–Iron Oxide-Based High-Temperature Water−Gas Shift Catalysts, ACS Catal., 2023, 13, 12681–12691 CrossRef CAS PubMed.
- J. Chang, Z. Feng, J. M. Vohs and R. J. Gorte, A Study of Support Effects for the Water-Gas-Shift Reaction over Cu, Catalysts, 2022, 12, 1364 CrossRef CAS.
- R.-R. Lee, D.-H. Kim, K.-W. Jeon, I.-J. Jeon, C.-H. Kim, A. S. Ditter, D. A. Shapiro, M. A. Marcus, H. Ohldag, K. C. Bustillo, Y. S. Yu, W.-J. Jang, K. Lee and J.-O. Shim, Direct evidence from STXM analysis of enhanced oxygen storage capacity in ceria through the addition of Cu and Mg: Correlation of HT-WGS reaction performance, Chem. Eng. J., 2024, 496, 153994 CrossRef CAS.
- J. Shi, H. Li, A. Genest, W. Zhao, P. Qi, T. Wang and G. Rupprechter, High-Performance Water Gas Shift Induced by Asymmetric Oxygen Vacancies: Gold Clusters Supported by Ceria-Praseodymia Mixed Oxides, Appl. Catal., B, 2022, 301, 120789 CrossRef CAS.
- Y. Tong, L. Song, S. Ning, S. Ouyang and J. Ye, Photocarriers-Enhanced Photothermocatalysis of Water-Gas Shift Reaction under H2-Rich and Low-Temperature Condition over CeO2/Cu1.5Mn1.5O4 Catalyst, Appl. Catal., B, 2021, 298, 120551 CrossRef CAS.
- J.-S. Park, J. K. Kim, J. H. Hong, J. S. Cho, S.-K. Park and Y. C. Kang, Advances in the Synthesis and Design of Nanostructured Materials by Aerosol Spray Processes for Efficient Energy Storage, Nanoscale, 2019, 11, 19012–19057 RSC.
- J. M. Choi, J. S. Lee and J. S. Cho, One-Pot Synthesis Strategy of Sea Urchin-Like Hollow Microspheres Comprising MoOχ Nanorods Attached via N-Doped C as Anodes for Lithium-Ion Batteries, Chem. Eng. J., 2022, 439, 135536 CrossRef CAS.
- S. H. Oh and J. S. Cho, Hierarchical (Ni,Co)Se2/CNT Hybrid Microspheres Consisting of a Porous Yolk and Embossed Hollow Thin Shell for High-Performance Anodes in Sodium-Ion Batteries, J. Alloys Compd., 2019, 806, 1029–1038 CrossRef CAS.
- J. O. Shim, Y. J. Hong, H. S. Na, W. J. Jang, Y. C. Kang and H. S. Roh, Highly Active and Stable Pt-Loaded Ce0.75Zr0.25O2 Yolk-Shell Catalyst for Water-Gas Shift Reaction, ACS Appl. Mater. Interfaces, 2016, 8, 17239–17244 CrossRef CAS PubMed.
- S. Rossignol, Y. Madier and D. Duprez, Preparation of Zirconia–Ceria Materials by Soft Chemistry, Catal. Today, 1999, 50, 261–270 CrossRef CAS.
- A. B. Workie, H. S. Ningsih and S.-J. Shih, An Comprehensive Review on the Spray Pyrolysis Technique: Historical Context, Operational Factors, Classifications, and Product Applications, J. Anal. Appl. Pyrolysis, 2023, 170, 10591 CrossRef.
- J. S. Park, J. K. Kim, J. H. Hong, J. S. Cho, S. K. Park and Y. C. Kang, Advances in the Synthesis and Design of Nanostructured Materials by Aerosol Spray Processes for Efficient Energy Storage, Nanoscale, 2019, 11, 19012–19057 RSC.
- J. M. Choi, J. S. Lee and J. S. Cho, One-Pot Synthesis Strategy of Sea Urchin-Like Hollow Microspheres Comprising MoOx Nanorods Attached via N-Doped C as Anodes for Lithium-Ion Batteries, Chem. Eng. J., 2022, 439, 135536 CrossRef CAS.
- S. Xiong, R. Tang, D. Gong, Y. Deng, C. Zhang, J. Zheng, M. Zhong, L. Su, L. Yang and C. Liao, Yolk-Shell Catalyst: From Past to Future, Appl. Mater. Today, 2020, 21, 100798 CrossRef.
- M. Si, F. Lin, H. Ni, S. Wang, Y. Lu and X. Meng, Research Progress of Yolk-Shell Structured Nanoparticles and their Application in Catalysis, RSC Adv., 2023, 13, 2140 RSC.
- K.-W. Jeon, J. K. Kim, B.-J. Kim, W.-J. Jang, Y. C. Kang and H.-S. Roh, Ultra-Stable Porous Yolk-Shell Ni Catalysts for the Steam Reforming of Methane with Alkali Poisoning, Chem. Eng. J., 2023, 454, 140060 CrossRef CAS.
- A. B. Dongil, L. Pastor-Pérez, N. Escalona and A. Sepúlveda-Escribano, Carbon Nanotube-Supported Ni–CeO2 Catalysts. Effect of the Support on the Catalytic Performance in the Low-Temperature WGS Reaction, Carbon, 2016, 101, 296–304 CrossRef CAS.
- M. Salavati-Niasari, M. Dadkhah and F. Davar, Pure Cubic ZrO2 Nanoparticles by Thermolysis of a New Precursor, Polyhedron, 2009, 28, 3005–3009 CrossRef CAS.
- Y.-S. Jang, T. Amna, M. S. Hassan, J.-L. Gu, I.-S. Kim, H.-C. Kim, J.-H. Kim, S.-H. Baik and M.-S. Khil, Improved Supercapacitor Potential and Antibacterial Activity of Bimetallic CNFs–Sn–ZrO2 Nanofibers: Fabrication and Characterization, RSC Adv., 2014, 4, 17268–17273 RSC.
- R. Ahmadiasl, G. Moussavi, S. Shekoohiyan and F. Razavian, Synthesis of Cu-Doped TiO2 Nanocatalyst for the Enhanced Photocatalytic Degradation and Mineralization of Gabapentin under UVA/LED Irradiation: Characterization and Photocatalytic Activity, Catalysts, 2022, 12, 1310 CrossRef CAS.
- C.-J. Lin and W.-T. Yang, Ordered Mesostructured Cu-Doped TiO2 Spheres as Active Visible-Light-Driven Photocatalysts for Degradation of Paracetamol, Chem. Eng. J., 2014, 237, 131–137 CrossRef CAS.
- Y. Wang, C. Yang, A. Chen, W. Pu and J. Gong, Influence of Yolk-Shell Au@TiO2 Structure Induced Photocatalytic Activity towards Gaseous Pollutant Degradation under Visible Light, Appl. Catal., B, 2019, 251, 57–65 CrossRef CAS.
- L. Jiang, H. Zhu, R. Razzaq, M. Zhu, C. Li and Z. Li, Effect of Zirconium Addition on the Structure and Properties of CuO/CeO2 Catalysts for High-Temperature Water–Gas Shift in an IGCC System, Int. J. Hydrogen Energy, 2012, 37, 15914–15924 CrossRef CAS.
- S.-Y. Ahn, H.-S. Na, K.-W. Jeon, Y.-L. Lee, K.-J. Kim, J.-O. Shim and H.-S. Roh, Effect of Cu/CeO2 Catalyst Preparation Methods on Their Characteristics for Low Temperature Water−Gas Shift Reaction: A Detailed Study, Catal. Today, 2020, 352, 166–174 CrossRef CAS.
- K. Taniya, Y. Horie, R. Fujita, Y. Ichihashi and S. Nishiyama, Mechanistic Study of Water–Gas Shift Reaction over Copper/Zinc-Oxide/Alumina Catalyst in a Reformed Gas Atmosphere: Influence of Hydrogen on Reaction Rate, Appl. Catal., B, 2023, 330, 122568 CrossRef CAS.
- S. Jin, Y. Park, G. Bang, N. D. Vo and C.-H. Lee, Revisiting Magnesium Oxide to Boost Hydrogen Production via Water-Gas Shift Reaction: Mechanistic Study to Economic Evaluation, Appl. Catal., B, 2021, 284, 119701 CrossRef CAS.
- J. Liu, M. Liao, M. Imura, A. Tanaka, H. Iwai and Y. Koide, Low On-Resistance Diamond Field Effect Transistor with High-k ZrO2 as Dielectric, Sci. Rep., 2014, 4, 6395 CrossRef CAS PubMed.
- D. Lu, O. A. Zelekew, A. K. Abay, Q. Huang, X. Chen and Y. Zheng, Synthesis and Photocatalytic Activities of a CuO/TiO2 Composite Catalyst Using Aquatic Plants with Accumulated Copper as a Template, RSC Adv., 2019, 9, 2018–2025 RSC.
- L. Pastor-Pérez, T. Reina, S. Ivanova, M. Centeno, J. Odriozola and A. Sepúlveda-Escribano, Ni-CeO2/C Catalysts with Enhanced OSC for the WGS Reaction, Catalysts, 2015, 5, 298–309 CrossRef.
- S.-Y. Ahn, W.-J. Jang, J.-O. Shim, B.-H. Jeon and H.-S. Roh, CeO2-Based Oxygen Storage Capacity Materials in Environmental and Energy Catalysis for Carbon Neutrality: Extended Application and Key Catalytic Properties, Catal. Rev., 2023, 1–84 Search PubMed.
- L. Sun, L. Cao, Y. Su, C. Wang, J. Lin and X. Wang, Ru1/FeOx Single-Atom Catalyst with Dual Active Sites for Water Gas Shift Reaction without Methanation, Appl. Catal., B, 2022, 318, 121841 CrossRef CAS.
- S. Ciuta, D. Tsiamis and M. J. Castaldi, Gasification of Waste Materials: Technologies for Generating Energy, Gas, and Chemicals from Municipal Solid Waste, Biomass, Nonrecycled Plastics, Sludges, and Wet Solid Wastes, Elsevier Science, 2017 Search PubMed.
- S. Kim, B. S. Crandall, M. J. Lance, N. Cordonnier, J. Lauterbach and E. Sasmaz, Activity and Stability of NiCe@SiO Multi–Yolk–Shell Nanotube Catalyst for Tri-Reforming of Methane, Appl. Catal., B, 2019, 259, 118037 CrossRef CAS.
- P. Kumar and R. Idem, A Comparative Study of Copper-Promoted Water−Gas-Shift (WGS) Catalysts, Energy Fuels, 2007, 21, 522–529 CrossRef CAS.
- C.-H. Jeong, H.-J. Byeon, W.-J. Jang, K.-W. Jeon and D.-W. Jeong, The optimization of Nb loading amount over Cu-Nb-CeO2 catalysts for hydrogen production via the low-temperature water gas shift reaction, Int. J. Hydrogen Energy, 2020, 45, 9648–9657 CrossRef CAS.
- L. Pastor-Pérez, S. Gu, A. Sepúlveda-Escribano and T. R. Reina, Bimetallic Cu-Ni catalysts for the WGS reaction – Cooperative or uncooperative effect?, Int. J. Hydrogen Energy, 2019, 44, 4011–4019 CrossRef.
- C. Price, L. Pastor-Pérez, E. L. Saché, A. Sepúlveda-Escribano and T. R. Reina, Highly active Cu-ZnO catalysts for the WGS reaction at medium-high space velocities: Effect of the support composition, Int. J. Hydrogen Energy, 2017, 42, 10747–10751 CrossRef CAS.
- Y.-J. Gu, J.-H. Kim, W.-J. Jang and D.-W. Jeong, A comparison of Cu/CeO2 catalysts prepared via different precipitants/digestion methods for single stage water gas shift reactions, Catal. Today, 2022, 388–389, 237–246 CrossRef CAS.
Footnotes |
| † Electronic supplementary information (ESI) available. See DOI: https://doi.org/10.1039/d4ta06757f |
| ‡ These authors contributed equally to this work. |
| This journal is © The Royal Society of Chemistry 2025 |


