Eco-friendly innovation: three-mode sun-actuated thermotropic devices integrating κ-carrageenan-based film doped with Arundo donax leaf-derived carbon dots and 1-butyl-3-methyl-1H-imidazolium chloride†
S. C.
Nunes
 *a,
T. A. G.
Duarte
b,
R. F. P.
Pereira
 c,
L.
Fu
 d,
R. A. S.
Ferreira
 d,
P.
Almeida
 e and
V.
de Zea Bermudez
 *bf
*bf
aChemistry Department and FibEnTech – Fiber Materials and Environmental Technologies, University of Beira Interior, Covilhã 6201-001, Portugal
bChemistry Department, University of Trás-os-Montes e Alto Douro, Vila Real 5000-811, Portugal. E-mail: vbermude@utad.pt
cCentre of Chemistry, University of Minho, Braga 4710-057, Portugal
dPhysics Department and CICECO-Aveiro Institute of Materials, University of Aveiro, Aveiro 3810-193, Portugal
eHealth Sciences Research Centre (CICS-UBI), Department Chemistry, University of Beira Interior, Covilhã 6201-001, Portugal
fCQ-VR, University of Trás-os-Montes e Alto Douro, Vila Real 5000-811, Portugal
First published on 2nd December 2024
Abstract
In this study, the morphology, size, and optical properties of carbon dots (CDs) synthesized at various temperatures (250, 300, 350 and 400 °C) are investigated, along with their incorporation into kappa-carrageenan (κ-Cg)-based membranes. A simple, low-cost, and environmentally friendly method is proposed for synthesizing photoluminescent CDs using a single natural source precursor, the Arundo donax leaf. Through a systematic experimental approach we assess the influence of the synthesis conditions on the optical properties of the resulting CDs. The CDs, predominantly spherical with sizes ranging from 3.2 to 4.8 nm, exhibit an essentially graphitic structure. Surface functional groups, such as C![[double bond, length as m-dash]](https://www.rsc.org/images/entities/char_e001.gif) O and O–H, enhance their hydrophilicity. The CDs display strong blue-to-green fluorescence in aqueous solutions. When integrated into κ-Cg-based films, the CDs influence the structural and morphological properties of the host matrix. These flexible, scalable, thermally stable, eco-friendly, and mechanically robust films demonstrate quantum yield values comparable to that in aqueous solutions, suggesting that the κ-Cg matrix mantains the CDs' emission properties due to weak interactions, preserving electronic transitions. Additionally we develop a sun-actuated zero-energy dual-mode thermotropic device (TTDs) featuring κ-Cg doped with CDs and 1-butyl-3-methylimidazolium chloride ([Bmim]Cl) thermotropic ionic liquid. At 40 and 60 °C, this TTD operates as a dual-mode system with transmittance variation (ΔT) values of 10/8% and 13/10% at 550/1000 nm, respectively. Upon addition of silver islands the surface plasmon resonance effect (SPRE)-mediated TTD offers a three-mode operation (a bright hot mode (visible and NIR admitted), a semi-bright warm mode (visible and NIR semi-blocked), and a semi-dark semi-cool mode (visible and NIR further semi-blocked) with ΔT values of 42/40% and 58/55% at 40 and 60 °C, respectively), and stable performance over multiple cycles. Overall, our findings highlight the potential of κ-Cg matrices for developing luminescent materials with stable and predictable optical properties for advanced optoelectronics and sensing applications.
O and O–H, enhance their hydrophilicity. The CDs display strong blue-to-green fluorescence in aqueous solutions. When integrated into κ-Cg-based films, the CDs influence the structural and morphological properties of the host matrix. These flexible, scalable, thermally stable, eco-friendly, and mechanically robust films demonstrate quantum yield values comparable to that in aqueous solutions, suggesting that the κ-Cg matrix mantains the CDs' emission properties due to weak interactions, preserving electronic transitions. Additionally we develop a sun-actuated zero-energy dual-mode thermotropic device (TTDs) featuring κ-Cg doped with CDs and 1-butyl-3-methylimidazolium chloride ([Bmim]Cl) thermotropic ionic liquid. At 40 and 60 °C, this TTD operates as a dual-mode system with transmittance variation (ΔT) values of 10/8% and 13/10% at 550/1000 nm, respectively. Upon addition of silver islands the surface plasmon resonance effect (SPRE)-mediated TTD offers a three-mode operation (a bright hot mode (visible and NIR admitted), a semi-bright warm mode (visible and NIR semi-blocked), and a semi-dark semi-cool mode (visible and NIR further semi-blocked) with ΔT values of 42/40% and 58/55% at 40 and 60 °C, respectively), and stable performance over multiple cycles. Overall, our findings highlight the potential of κ-Cg matrices for developing luminescent materials with stable and predictable optical properties for advanced optoelectronics and sensing applications.
Introduction
Heating, cooling, and lighting contribute significantly to the total annual energy consumption in modern buildings.1,2 As the world faces climate changes and the imperative to drastically reduce carbon emissions, the demand for energy-efficient building solutions becomes increasingly urgent.3 Traditional windows, while essential for providing natural light and ventilation, often contribute to excessive glare, heat gain, or loss, leading to increased reliance on mechanical systems for light and heat control. This dependence, not only strains energy resources but also incurs significant costs for building owners and occupants.1 Smart windows, unlike static ones, can dynamically regulate solar radiation and manage interior temperatures, adapting in real-time to changing environmental conditions and user preferences. They offer a promising way to improve building energy efficiency and contribute to broader societal and environmental benefits by significantly reducing energy consumption and greenhouse gas emissions and mitigating climate change.4 Additionally, smart windows enhance the occupant's comfort, productivity, and well-being, promoting healthier and more sustainable living environments. These windows encompass advanced smart materials to modulate optical properties in response to electrical signals, light, or heat.5–7Driven by global environmental and sustainability concerns the use of natural-source materials in energy devices has seen exponential growth. In this context, some of us developed innovative green electrolytes from kappa-carrageenan (κ-Cg), a biomacromolecule derived from red seaweed, exhibiting unique properties that make it an appealing option for a wide range of fields.8–12 Based on its attributes, we prepared proton-conducting membranes using κ-Cg, the 1-butyl-3-methyl-1H-imidazolium chloride ([Bmim]Cl) ionic liquid (IL), and glycerol (Gly).8 Tests with air/hydrogen fuel cells confirmed the suitability of an optimized electrolyte for eco-friendly electrochemical devices not requiring the flow of gases to operate and not leading to water formation. Later, κ-Cg-based materials were applied in electrochromic devices for smart windows, enabling enhanced indoor comfort in buildings with poor orientation on sunny days.9 An electrochromic device incorporating an ultraviolet (UV)/blue and near-infrared (NIR) emitting κ-Cg-based electrolyte composed of Gly and erbium triflate (ErTrif3·xH2O) demonstrated fast and high switching efficiency, outstanding coloration efficiency, excellent electrochemical stability, and self-healing following mechanical stress.9 The device offered semi-bright/warm and dark/cold modes but lacked, as expected, a bright/hot mode, as many other polysaccharides.13–16
Herein, aiming at enlarging the practical use of κ-Cg-containing membranes in the smart windows domain, we decided to explore their suitability in thermotropic devices (TTDs). TTDs, though less investigated than electrochromic devices, offer promising avenues for adaptive solar control. Thermotropic (TT) materials can alter their light-scattering properties with temperature changes,7,17,18 making them ideal for fabricating zero-energy (sun-actuated) smart windows. During operation TTDs transition between transparency and opacity as temperature shifts.7,17,18 In the transparent mode, they allow solar radiation into buildings, increasing heat gains. When they become opaque, they block solar radiation, although at the cost of losing visual contact with the outside, making them appropriate for non-essential view areas like skylights and roof windows. TT hydrogels are popular materials in passive smart windows,19 known for their water-absorbent, cross-linked polymer networks comprising hydrophilic and hydrophobic groups. If TT windows are envisaged, systems with a lower critical solution temperature (LCST) are preferred. As temperature rises such systems transition from a transparent, isotropic, and light-transmitting state to a cloudy state, which scatters light and reduces transmission due to the weakening of hydrogen bonding between the polymer and surrounding water molecules and the increase of hydrophobic domain interactions.20 For example, Jiang et al.,21 developed thermo-responsive smart windows using poly(N-isopropylacrylamide) (PNIPAM) hydrogels, selected for their LCST around 32 °C. This novel hydrogel, created by combining PNIPAM with hydroxypropylmethyl cellulose (HPMC), effectively modulates light, blocking sunlight and reducing indoor temperatures when temperatures exceed the LCST. The PNIPAM/HPMC hydrogel achieves a high luminous transmittance (Tlum) of 90.82% and an impressive solar modulation capacity (ΔTsol) of 81.52%, both key for optimizing light control in smart window applications.
The upper critical solution temperature (UCST) of κ-Cg hydrogels represented a major drawback to pursuing our goals in the present work. To address this issue two strategies were implemented in the membrane formulation. Firstly, we decided to take full advantage of the versatility of [Bmim]Cl. In our previous research on κ-Cg-based electrolytes, this aprotic IL was used because of its strong hydrogen-bond-accepting ability especially linked to the Cl− ion, which promotes the formation of hydrogen bonds with the matrix hydroxyl (–OH) groups, thereby enhancing proton conductivity.8 Furthermore, [Bmim]Cl exhibits a TT transition around 40 °C associated with a trans-to-gauche conformational change of the butyl group.22 This temperature-sensitive effect was seminal in developing TTDs incorporating synthetic glucose-23 and crab chitin (CHI)24 derived ionanofluids whose TT phenomenon was amplified through the surface plasmon resonance effect (SPRE). Secondly, we incorporated carbon dots (CDs) into the κ-Cg matrix, to improve the electro-optical-thermal effect of the films.25
CDs26 range from 2 to 10 nm, featuring amorphous or crystalline cores composed of sp2 carbons structures.27 They have generated significant interest due to their countless features28 (high emission quantum yield (Φ),29 tuneable emissions,30 biocompatibility,31 low toxicity,32 high photostability,33 high chemical stability,34 water solubility35 and ease of surface functionalization) which make them useful for plenty of applications.36–38 Theories, such as molecular state, surface state, size and crosslinking-enhanced emission effects, have been put through to explain their fluorescence mechanism.39,40 The methods developed to produce CDs41 can be broadly categorized into top-down42,43 and bottom-up43,44 methodologies. Recently, research has been directed toward producing CDs through bottom-up methodologies from biomass,38,45,46i.e., any organic matter available on a renewable or recurring basis. Natural biomass materials (e.g., fruit peels, vegetables, and plant fibers) are abundant and low-cost carbon sources that can be used to prepare CDs,37,38,45,47 making them an attractive option for developing CDs with low environmental impact.38
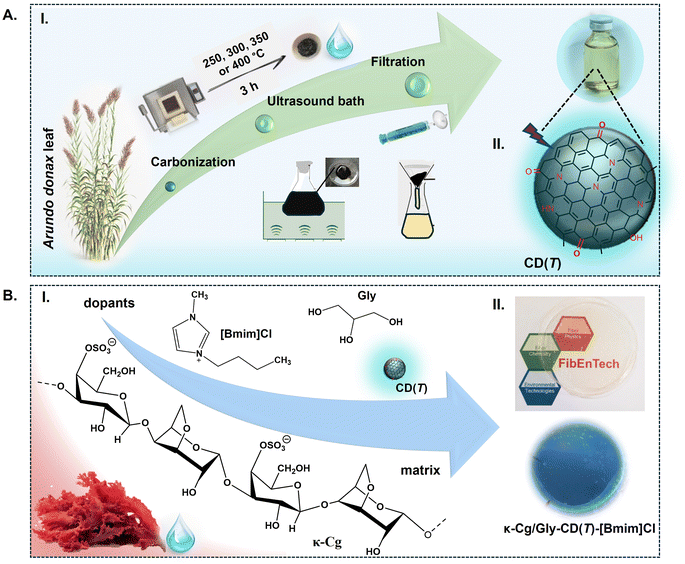
In this work, we introduce an environmentally friendly method for synthesizing luminescent water-soluble CDs from the Arundo donax leaf through thermal carbonization48 (Fig. 1A). Four different carbonization temperatures were tested (Fig. 1A), as these conditions are known to influence the size, shape, and distribution of CDs—crucial factors for optimizing photoluminescence (PL) properties.48,49A. donax (giant reed) is a tall, perennial grass species.50 Its leaves show much potential as a bioenergy crop owing to their high biomass productivity. We selected the A. donax leaf as raw material for the CDs because our group has recently analysed its chemical composition.50 Calcination of the ashes of the A. donax leaves at 600 and 800 °C revealed the presence of carbon (C), oxygen (O), silicon (Si), potassium (K), magnesium (Mg), chlorine (Cl) and calcium (Ca).51 Additionally, triterpenoids, followed by alcohols, esters, and other trace constituents were identified in the cuticle waxes on the leaf surfaces.52 This rich chemical profile supported the viability of A. donax leaves as a precursor for CD synthesis.
Herein, we report for the first time free-standing, transparent films composed of κ-Cg, CDs derived from A. donax leaves and [Bmim]Cl (Fig. 1B). The as-prepared films are transparent, flexible, thermally stable, and mechanically robust. They exhibit stable optical properties and a reversible transition from a transparent state to two different semi-opaque states from room temperature up to 60 °C. The technological potential of this material for the window sector is demonstrated with the operation of a three-modulation TTD, with electro-optical performance boosted through the mediation of silver (Ag) islands-induced SPRE.
Results and discussion
Structural and morphological characterization of the CDs
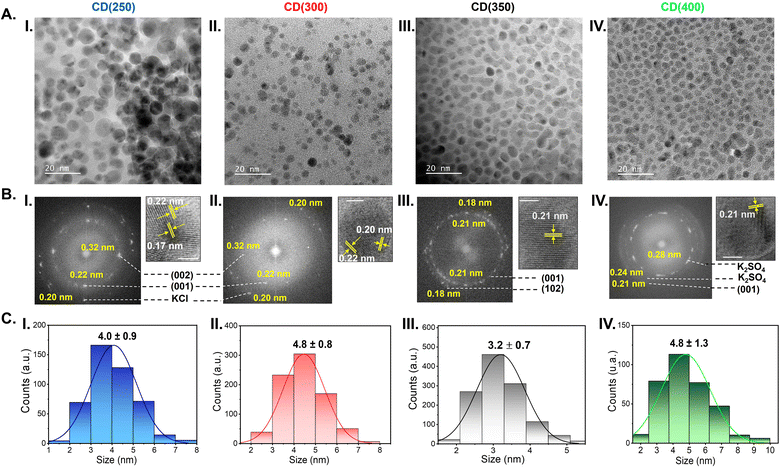
The high-resolution transmission electron microscopy (HR-TEM) images depicted in Fig. 2A(I–IV) ilustrate the well-dispersed nature of the CDs in an aqueous solution. Most CDs exhibit a near spherical morphology, with average sizes of 4.0 ± 0.9 nm (CD(250)) (Fig. 2C(I)), 4.8 ± 0.8 nm (CD(300)) (Fig. 2C(II)), 3.2 ± 0.7 nm (CD(350)) (Fig. 2C(III)) and 4.8 ± 1.3 nm (CD(400)) (Fig. 2C(IV)).The HR-TEM images and the selected area electron diffraction (SAED) patterns of the CD(T)s reveal lattice spacings of 0.18–0.17 nm (Fig. 2B(I and III)), 0.20 nm (Fig. 2B(I and II)), 0.22–0.21 nm (Fig. 2C(I–IV)), 0.24 nm (Fig. 2B(IV)), 0.28–0.29 nm (Fig. 2B(IV)) and 0.32 nm (Fig. 2B(I and II)). The lattice spacings of 0.18–0.17, 0.22–0.21, and 0.32 nm correspond to the (102), (001) and (002) diffraction planes, respectively, of the orthorhombic graphitic crystalline structure (Pnam space group, a = 2.4600 Å, b = 4.2620 Å, c = 6.696 Å and α = β = γ = 90°),51–55 which produces sharp Bragg reflections at 50.15, 40.55 and 28.25°, respectively (Fig. 3). The latter peak may also be attributed to the (200) diffraction plane of cubic sylvite (KCl) crystalline structure (Fm3m space group, a = b = c = 6.288 Å, and α = β = γ = 90°).56 Additionally, lattice spacings of 0.28–0.29 nm (Fig. 2B(IV)) correspond to the (002) diffraction plane of orthorhombic arcanite (K2SO4) crystalline structure57 (Pnam space group, a = 7.476 Å, b = 10.071 Å, c = 5.763 Å, and α = β = γ = 90°), which produces sharp Bragg reflections at 30.75 and 29.75° (Fig. 3). The lattice spacings of 0.24 nm (Fig. 2B(IV)) align with the sharp Bragg reflection at 37.9° (Fig. 3) attributed to K2SO4.57 The HR-TEM of CD(250) and CD(300) reveal lattice spacings corresponding to (220) planes of KCl,56 with a characteristic spacing of 0.20 nm, consistent with the Bragg reflections observed around 44.6° (Fig. 3). Furthermore, the X-ray diffraction (XRD) patterns of CD(250), CD(300) and CD(350) display a broad peak around 22° (Fig. 3), indicative of an interlayer spacing of 0.42 nm, which exceeds that of bulk graphite (0.33 nm). This observation suggests the presence of regions with disordered carbon atoms in these materials. Thus, the XRD data confirm the formation of a graphitic crystalline structure in all the analyzed CD(T), with some proportion of amorphous carbon domains in CD(250), CD(300) and CD(350).
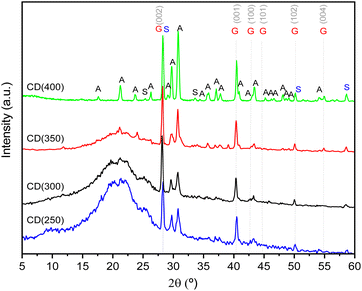 | ||
| Fig. 3 XRD patterns of CD(250) (blue line), CD(300) (red line), CD(350) (black line) and CD (400) (green line) powders. S: sylvite (KCl), A: arcanite (K2SO4) and G: graphite. | ||
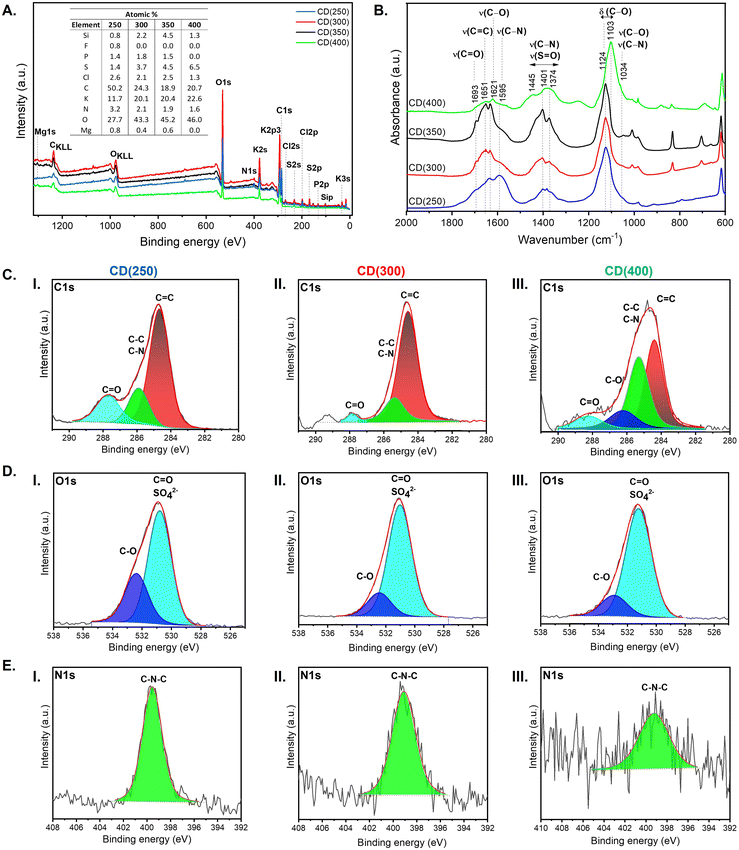
To gain insight into the surface composition and chemical structure, the CDs were analysed by X-ray photoelectron spectroscopy (XPS) (Fig. 4A) and Fourier-transform infrared (FT-IR) spectroscopy (Fig. 4B). The XPS spectra reveal the presence of carbon (C 1s, 284.4 eV), oxygen (O 1s, 531.0 eV), sulfur (S 2p, 168.7 eV, and S 2s, 232.0 eV), nitrogen (N 1s, 400.0 eV), chlorine (Cl 2p, 198.0 eV and Cl 2s, 282.0 eV), potassium (K 2s, 377 eV; K 2p, 295.1/292.3 eV and K 3s, 33.0 eV), magnesium (Mg 1s, 1303.5 eV), silicon (Si 2p, 103.0 eV), phosphorus (P 2p, 133 eV) and fluorine (F 1s, 688.3 eV) (Fig. 3A), with different relative atomic proportions, depending on the carbonization temperature. The elements Si, F, P, S, Cl, K and Mg originate from the mineral content of the leaves. As expected, quantitative analysis of the XPS data revealed that in the CD(250) sample, C was the most abundant element (50.1%), followed by O (27.7%) (Fig. 4A, inset Table). The third most abundant element was K (11.7%). However, with increasing carbonization temperature (T = 300, 350 and 400 °C) the atomic percentage of C decreased while the atomic percentage of O and K increased (Fig. 4A, inset). In the case of CD(400) the elements C, O, and K reached values of 20.7, 46.0 and 22.6%, respectively (Fig. 4A, inset table). The spectra of C 1s of the CD(T) samples were fitted into three/four components positioned at 284.3, 285.7, 286.3, and 288.2 eV (Table S2, ESI†), ascribed to C![[double bond, length as m-dash]](https://www.rsc.org/images/entities/char_e001.gif) C, C–C/C–N, C–O and C
C, C–C/C–N, C–O and C![[double bond, length as m-dash]](https://www.rsc.org/images/entities/char_e001.gif) O moieties, respectively (Fig. 4C).58–60 The O 1s spectrum shows peaks associated with the C
O moieties, respectively (Fig. 4C).58–60 The O 1s spectrum shows peaks associated with the C![[double bond, length as m-dash]](https://www.rsc.org/images/entities/char_e001.gif) O group (531.0 eV) and O–C linkages (532.7 eV) (Fig. 4D and Table S2, ESI†). The peak around 531.0 eV also corresponds to O in sulfate (SO42−) groups.61 The deconvolution of the N 1s peak (Fig. 4E) yielded a single peak at 399.4 eV due to sp2 hybridized aromatic N atoms linked to C atoms in the graphite phase (C–N–C configuration),60 suggesting that the N atoms were incorporated into the C–C bonds. The small XPS peak around 168.2 eV (Fig. S1 and Table S2, ESI†) corresponds to S in SO42− groups.62 The presence of hydrophilic groups, such as –OH and C
O group (531.0 eV) and O–C linkages (532.7 eV) (Fig. 4D and Table S2, ESI†). The peak around 531.0 eV also corresponds to O in sulfate (SO42−) groups.61 The deconvolution of the N 1s peak (Fig. 4E) yielded a single peak at 399.4 eV due to sp2 hybridized aromatic N atoms linked to C atoms in the graphite phase (C–N–C configuration),60 suggesting that the N atoms were incorporated into the C–C bonds. The small XPS peak around 168.2 eV (Fig. S1 and Table S2, ESI†) corresponds to S in SO42− groups.62 The presence of hydrophilic groups, such as –OH and C![[double bond, length as m-dash]](https://www.rsc.org/images/entities/char_e001.gif) O, on the surface of the CDs indicates their good dispersibility in water, as demonstrated by HR-TEM. The K 2p spectra of the CDs were decomposed into two peaks at 292.3 and 295.1 eV, assigned to K 2p3 and K 2p1, respectively (Table S2 and Fig. S1, ESI†), suggesting the presence of K+ and KCl.63 The Cl 2p spectrum of the CDs (Table S2 and Fig. S1, ESI†) exhibits a pair of peaks at 197.9 and 199.5 eV (Table S2 and Fig. S1, ESI†), corresponding to Cl 2p3/2 and Cl 2p1/2, pointing out that the chemical valence state of Cl is −1 in the CDs.63 The P 2p spectra of CD(250), CD(300), and CD(350) (Table S2, Fig. S1a, and b, ESI†) show two peaks at 132.6 and 133.3 eV, assigned to P 2p3 and P 2p1, respectively, which suggest the presence of oxidized P–O species in the less carbonized samples.64 The Si2p spectra for the CD(T) samples display peaks at 102.3 and 103.1 eV, corresponding to Si 2p3/2 and Si2 p1/2, indicative of Si–O groups (Table S2 and Fig. S1, ESI†). Additionally, the individual Mg 1s binding energy environment gives support to the presence of Mg metal (Fig. S1(a and b), ESI†).63
O, on the surface of the CDs indicates their good dispersibility in water, as demonstrated by HR-TEM. The K 2p spectra of the CDs were decomposed into two peaks at 292.3 and 295.1 eV, assigned to K 2p3 and K 2p1, respectively (Table S2 and Fig. S1, ESI†), suggesting the presence of K+ and KCl.63 The Cl 2p spectrum of the CDs (Table S2 and Fig. S1, ESI†) exhibits a pair of peaks at 197.9 and 199.5 eV (Table S2 and Fig. S1, ESI†), corresponding to Cl 2p3/2 and Cl 2p1/2, pointing out that the chemical valence state of Cl is −1 in the CDs.63 The P 2p spectra of CD(250), CD(300), and CD(350) (Table S2, Fig. S1a, and b, ESI†) show two peaks at 132.6 and 133.3 eV, assigned to P 2p3 and P 2p1, respectively, which suggest the presence of oxidized P–O species in the less carbonized samples.64 The Si2p spectra for the CD(T) samples display peaks at 102.3 and 103.1 eV, corresponding to Si 2p3/2 and Si2 p1/2, indicative of Si–O groups (Table S2 and Fig. S1, ESI†). Additionally, the individual Mg 1s binding energy environment gives support to the presence of Mg metal (Fig. S1(a and b), ESI†).63
In the high-frequency region of the FT-IR spectra (not shown) of the CDs, a prominent broadband appears at approximately 3461 cm−1, associated with the O–H stretching vibration mode (ν(O–H)). The absence of the CH2 symmetric and asymmetric stretching bands (νa(CH) and νs(CH)), typically at 2921 and 2851 cm−1 (not shown), respectively, in the FT-IR spectra of all four samples indicates complete calcination of the carbon source, independently of the carbonization temperature, meaning that the hydrocarbon was fully converted to a graphitic structure. Below 2000 cm−1, the FT-IR spectra of CD(250), C(300), CD(350) and CD(400) show a complex band envelope between 1800 and 1500 cm−1 (Fig. 4B). The band around 1693 cm−1 corresponds to the C![[double bond, length as m-dash]](https://www.rsc.org/images/entities/char_e001.gif) O stretching vibration (ν(C
O stretching vibration (ν(C![[double bond, length as m-dash]](https://www.rsc.org/images/entities/char_e001.gif) O)).65,66 In the case of CD(400), this region is less intense (Fig. 4B, green line). Broad bands between 1651 and 1621 cm−1 (Fig. 4B) are attributed to the C
O)).65,66 In the case of CD(400), this region is less intense (Fig. 4B, green line). Broad bands between 1651 and 1621 cm−1 (Fig. 4B) are attributed to the C![[double bond, length as m-dash]](https://www.rsc.org/images/entities/char_e001.gif) C and C–O stretching vibration modes (ν(C
C and C–O stretching vibration modes (ν(C![[double bond, length as m-dash]](https://www.rsc.org/images/entities/char_e001.gif) C) and ν(C–O), respectively).65 The shoulder observed at 1595 cm−1 corresponds to C–N stretching mode (ν(C–N)).65 Multiple bands between 1470 and 1350 cm−1 are associated with the C–C and S
C) and ν(C–O), respectively).65 The shoulder observed at 1595 cm−1 corresponds to C–N stretching mode (ν(C–N)).65 Multiple bands between 1470 and 1350 cm−1 are associated with the C–C and S![[double bond, length as m-dash]](https://www.rsc.org/images/entities/char_e001.gif) O stretching vibration modes, (ν(C–C) and ν(S
O stretching vibration modes, (ν(C–C) and ν(S![[double bond, length as m-dash]](https://www.rsc.org/images/entities/char_e001.gif) O), respectively).55,66 The band around 1103 cm−1 is characteristic of C–O bending vibration (δ(C–O)), while a weak band at 1034 cm−1 is assigned to the C–N stretching mode (ν(C–N)) and ν(C–O). In short, the FT-IR findings substantiate that the CDs encompass a graphitic core structure, with –OH and C
O), respectively).55,66 The band around 1103 cm−1 is characteristic of C–O bending vibration (δ(C–O)), while a weak band at 1034 cm−1 is assigned to the C–N stretching mode (ν(C–N)) and ν(C–O). In short, the FT-IR findings substantiate that the CDs encompass a graphitic core structure, with –OH and C![[double bond, length as m-dash]](https://www.rsc.org/images/entities/char_e001.gif) O groups moieties at the surface, which impart a high water solubility.
O groups moieties at the surface, which impart a high water solubility.
The combined detailed data from various characterization techniques (HR-TEM, XRD, XPS, and FT-IR) provide a comprehensive understanding of the structural, morphological, and surface characteristics, allowing for a general schematic representation of the CDs (Fig. 1A(II)).
Optical properties of the CDs
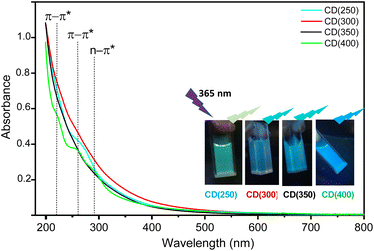
One of the most remarkable optical properties exhibited by CDs is the PL behavior. Their optical attributes can be finely tuned by adjusting the parameters within the chosen synthesis method (e.g., reaction temperature, precursor type, reaction duration), and tailoring surface functionalization. Understanding the nuanced impacts of distinct synthesis approaches on the optical properties enables tailoring CDs with specific optical features.The transparent and homogeneous aqueous solutions of the CD(T)s appear light yellow under visible light and emit strong greenish to bluish fluorescence, under UV radiation (365 nm), with the emission color depending on the synthesis reaction temperature (inset of Fig. 5). The absorption spectra of the as-prepared CDs reveal three peaks at 220, 260 and 290 nm (Fig. 5). The peaks observed at 220 and 260 nm correspond to π–π* transitions of sp2 conjugated carbons, likely originating from the C![[double bond, length as m-dash]](https://www.rsc.org/images/entities/char_e001.gif) C bonds within the graphitic core (Fig. 4).67,68 Considering the functional groups identified above, the peak at 290 nm is attributed to the n–π* transition of C
C bonds within the graphitic core (Fig. 4).67,68 Considering the functional groups identified above, the peak at 290 nm is attributed to the n–π* transition of C![[double bond, length as m-dash]](https://www.rsc.org/images/entities/char_e001.gif) O groups.69,70 This suggests a transition from high-energy (C
O groups.69,70 This suggests a transition from high-energy (C![[double bond, length as m-dash]](https://www.rsc.org/images/entities/char_e001.gif) O) to low-energy (C–O–C, C–O–H and C–N–C) states.
O) to low-energy (C–O–C, C–O–H and C–N–C) states.
The band gap energy (Eg) values were estimated by Tauc plots using UV-visible absorption spectra.71,72 Some research works showed that (αhν)2vs. hν curve (where α stands for the absorption coefficient from the Beer–Lambert equation, h refers to the Planck constant (6.626 × 10⁻³⁴ J s), and ν denotes the frequency of the incident photon) for direct band gap can give optimal results for CD materials.73,74 The Tauc plots of CD(250), CD(300), CD(350), and CD(400) are shown in Fig. S2 (ESI†). The Eg values were estimated to be around 5.0, 4.7, 4.8 and 4.9 eV, respectively.
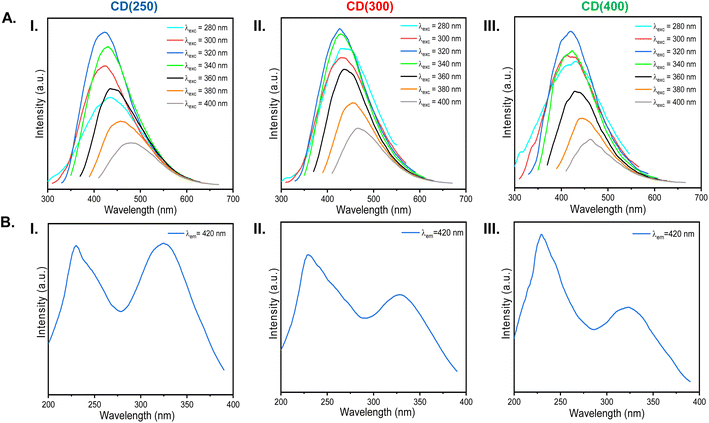
The maximum emission (Fig. 6A) and excitation (Fig. 6B) wavelengths of the aqueous solutions of the CDs are at 420 and around 230/326 nm, respectively. In the excitation spectra, the two peaks at around 230 and 326 nm can be attributed to the absorbance from the carbon core and the functional groups of the surface states, respectively. The excitation spectra obtained by monitoring the blue emission at 420 nm are consistent with the results represented in the absorption spectra (Fig. 5). With the increase of the thermal carbonization temperature, the absorption from the carbon core is increased, as shown in Fig. 6B. The optimal excitation wavelengths to obtain the maximum emission intensity for CDs' aqueous solutions are around 326 nm.
The emission spectra of aqueous solutions of CD(250), CD(300) and CD(400) under different excitation wavelengths (290–460 nm) (Fig. 6A) reveal that the blue-emitting CDs exhibit excitation-dependent emission. Furthermore, a comparison of the emission and excitation profiles of CD(350) (Fig. S3, ESI†) with those of CD(300) (Fig. 6A(II)) demonstrates similar behaviour.
The room-temperature excitation (Fig. S4, ESI†) and emission (Fig. 7A) spectra of solid-state CD(300) and CD(400) were also investigated. For CD(300), upon excitation at different wavelengths, broad emission bands spanning from blue to red hues were observed (Fig. 7A(I) and B(I)). The maximum emission peaks also displayed a red shift when the excitation wavelength was increased, a luminescence trend similar to that observed in the case of the corresponding aqueous solution (Fig. 6A(II)), suggesting excitation-dependent emission property for CD(300). In contrast, for CD(400), when the excitation wavelength was altered, the emission wavelength showed little change (Fig. 7A(II) and B(II)). Additionally, it is noteworthy that, unlike in the case of CD(300), a blue shift of the maximum emission was discerned for CD(400) at increasing wavelengths. Also interesting is the fact that the behavior of the solid-state CD(400) also contrasts markedly with that of the corresponding aqueous solution (Fig. 6A(III)).
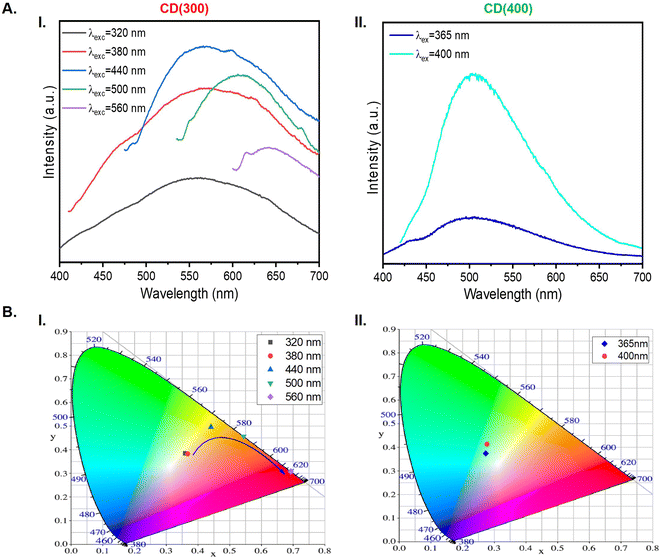 | ||
| Fig. 7 Emission spectra (A) and CIE chromaticity coordinate diagram (B) of solid-state CD(300) (I) and CD(400) (II). | ||
Numerous studies have tried to shed light on the PL mechanism in pristine and defective CDs. However, the mechanism at the origin of PL in CDs is complex, largely due to the diversity and complexity of the structures present. Currently, the most widely accepted theories support that the PL of CDs depends on the carbon core, the surface states, or the molecular state.75,76 The carbon core state refers to the π–π* electron transitions of the conjugated sp2 domains,76 a consequence of the quantum confinement effect. The domain size or the number of fused aromatic C–C rings significantly impacts the energy gap between π and π*, resulting in different emission colors and properties.76 Also, the presence of various functional groups (e.g., C![[double bond, length as m-dash]](https://www.rsc.org/images/entities/char_e001.gif) O, –OH, and C–N–C) on the CD surface, defects, heteroatom doping, and edge configurations affect the electric charge distribution and the formation of smaller sp2 domains, thereby influencing PL emission.39,77 The molecular state refers to fluorescence in CDs dominated by fluorophores or their aggregates, often synthesized from bottom-up routes, with n–π* and π–π* transitions, resulting in strong PL and high Φ values.28,39,76
O, –OH, and C–N–C) on the CD surface, defects, heteroatom doping, and edge configurations affect the electric charge distribution and the formation of smaller sp2 domains, thereby influencing PL emission.39,77 The molecular state refers to fluorescence in CDs dominated by fluorophores or their aggregates, often synthesized from bottom-up routes, with n–π* and π–π* transitions, resulting in strong PL and high Φ values.28,39,76
In the present study, we propose a tentative explanation for the origin of the PL of the CD(T) samples with T = 300 and 400. This may arise from a synergistic effect involving the carbon core, the surface states (C![[double bond, length as m-dash]](https://www.rsc.org/images/entities/char_e001.gif) O, C–OH, C–O–C, and C–N–C), and the presence of K+ ions. As illustrated in Fig. 5, the PL from the CDs can be associated with two distinct emission centers, namely, the sp2 conjugated domains of the carbon core containing C
O, C–OH, C–O–C, and C–N–C), and the presence of K+ ions. As illustrated in Fig. 5, the PL from the CDs can be associated with two distinct emission centers, namely, the sp2 conjugated domains of the carbon core containing C![[double bond, length as m-dash]](https://www.rsc.org/images/entities/char_e001.gif) C bonds and the states featuring oxygen-containing functional groups. These various surface states impart multiple excited states to the CDs, each with varying energy levels,78 thereby resulting in excitation-dependent luminescence characteristics (Fig. 7B(I)). Additionally, the presence of other heteroatoms (e.g., N in C–N–C) can also lead to an increase in the localized states. It was suggested elsewhere79 that excitation-independent PL can be achieved by tuning the C
C bonds and the states featuring oxygen-containing functional groups. These various surface states impart multiple excited states to the CDs, each with varying energy levels,78 thereby resulting in excitation-dependent luminescence characteristics (Fig. 7B(I)). Additionally, the presence of other heteroatoms (e.g., N in C–N–C) can also lead to an increase in the localized states. It was suggested elsewhere79 that excitation-independent PL can be achieved by tuning the C![[double bond, length as m-dash]](https://www.rsc.org/images/entities/char_e001.gif) C/C
C/C![[double bond, length as m-dash]](https://www.rsc.org/images/entities/char_e001.gif) O relative proportion, with a higher ratio preferred. Based on this assumption, and considering the XPS findings which revealed that CD(300) has a higher C
O relative proportion, with a higher ratio preferred. Based on this assumption, and considering the XPS findings which revealed that CD(300) has a higher C![[double bond, length as m-dash]](https://www.rsc.org/images/entities/char_e001.gif) C/C
C/C![[double bond, length as m-dash]](https://www.rsc.org/images/entities/char_e001.gif) O ratio compared to the CD(T)s with T = 250, 350 and 400, indicating a lower degree of oxidation, it was expected that the emission of CD(300) would be excitation-independent.78 Yet, excitation-dependent emission was observed for CD(300). This leads us to suggest that in this sample, the presence of K+ ions and N-containing functional groups presumably influences the emission process of the CDs, leading to an excitation-dependent emission. N atoms can donate their unpaired electrons, enhancing the emission properties of CD,80 because the N-containing functional groups facilitate the transition from the ground state to the lowest excited singlet state of electrons. The interaction between alkali metal ions, such as K+, and the surface of CDs, presumably induced surface defects or altered the electronic configuration,81 which modified the emission characteristics. Beyond the aforementioned K+ ion, a large variety of other elements including Si, Ge, Se, Gd and Tb have been employed as dopants to modify the optical properties of CDs.82 Thus, we are led to conclude that the luminescence of CD(300) is primarily influenced by surface states and the presence of K+ ions and exhibits an excitation-dependent behavior (Fig. 7A(I) and B(I)), whereas the emission around 505 nm from CD(400), predominantly originates from the carbon core, with emission wavelengths showing minimal changes upon alteration of the excitation wavelength (Fig. 7A(II) and B(II)).
O ratio compared to the CD(T)s with T = 250, 350 and 400, indicating a lower degree of oxidation, it was expected that the emission of CD(300) would be excitation-independent.78 Yet, excitation-dependent emission was observed for CD(300). This leads us to suggest that in this sample, the presence of K+ ions and N-containing functional groups presumably influences the emission process of the CDs, leading to an excitation-dependent emission. N atoms can donate their unpaired electrons, enhancing the emission properties of CD,80 because the N-containing functional groups facilitate the transition from the ground state to the lowest excited singlet state of electrons. The interaction between alkali metal ions, such as K+, and the surface of CDs, presumably induced surface defects or altered the electronic configuration,81 which modified the emission characteristics. Beyond the aforementioned K+ ion, a large variety of other elements including Si, Ge, Se, Gd and Tb have been employed as dopants to modify the optical properties of CDs.82 Thus, we are led to conclude that the luminescence of CD(300) is primarily influenced by surface states and the presence of K+ ions and exhibits an excitation-dependent behavior (Fig. 7A(I) and B(I)), whereas the emission around 505 nm from CD(400), predominantly originates from the carbon core, with emission wavelengths showing minimal changes upon alteration of the excitation wavelength (Fig. 7A(II) and B(II)).
The Φ of the CDs varies widely, influenced by surface passivation and doping, with values ranging from less than 1% to over 50%, some studies reporting even higher values.83 The Φ value of CDs is affected by particle size, pH value, and the presence of surface functional groups.84 The highest Φ values were 4% for CD(300) and 5% for CD(400) at an excitation wavelength of 330 nm (Table S3, ESI†). This suggests that increasing the carbonization temperature marginally improved the optical properties of the CDs. In addition, an analysis of the Φ values exhibited by the CD(T) samples in aqueous solutions (Table S3, ESI†) reveals consistently low values at all carbonization temperatures. The low Φ values can be attributed to the surface of the CDs that contain functional groups (e.g., –OH, C![[double bond, length as m-dash]](https://www.rsc.org/images/entities/char_e001.gif) O, and C–N–C groups) (Fig. 3 and 1B) which can introduce non-radiative recombination pathways, that lead to the decrease of Φ. It is worth recalling at this stage that the CDs obtained in this study exhibit a broad size distribution (Fig. 2C).
O, and C–N–C groups) (Fig. 3 and 1B) which can introduce non-radiative recombination pathways, that lead to the decrease of Φ. It is worth recalling at this stage that the CDs obtained in this study exhibit a broad size distribution (Fig. 2C).
This polydispersity can cause energy transfer between dots of different sizes, resulting in non-radiative losses and lowering of the overall Φ.85
Structural and morphological characterization of the CD-doped κ-Cg-based films
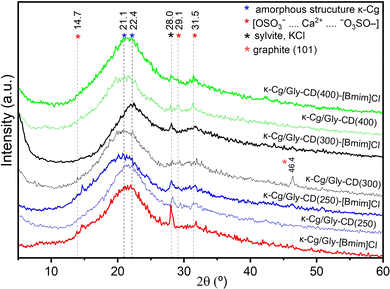
κ-Cg is composed of sulfate esters of D-galactose and 3.6-anhydro-galactose copolymers linked by α-1,3 and β-1,4-glycosidic linkages.8,9 The presence of three distinct types of cation-coordinating oxygen sites per repeat unit, namely –OH oxygen atoms, ether oxygen atoms (–C–O–C–), and sulfate (–OSO3−) oxygen atoms, enables strong interaction with cations, particularly alkali and alkaline earth metal ions, such as K+, sodium (Na+), calcium (Ca2+), and magnesium (Mg2+). These interactions influence the gelation properties and stability of κ-Cg gels.8,9 The gelation mechanism with K+ ions involves the creation of intramolecular bridges. Conversely, Ca2+-induced gelation relies on intermolecular bridges between adjacent double helices through electrostatic binding of two adjacent –OSO3− groups, thereby enhancing network stability. Gelation of κ-Cg follows a two-step process: initially, a structural transition from random coils to helices forms soluble clusters, followed by helix aggregation into network junctions upon further cooling.86,87 The resulting three-dimensional (3D) network of κ-Cg gels comprises junctions interconnected by flexible chains, with the degree of crystallinity correlating with the aligned arrangement of helices.8,86,87XRD analysis is useful in this context. Fig. 8 illustrates the XRD patterns of the κ-Cg-based membranes incorporating Gly prepared exclusively with CD(T), [Bmim]Cl, and a mixture of both dopants. These samples will be henceforth designated as κ-Cg/Gly-CD(T), κ-Cg/Gly-[Bmim]Cl, and κ-Cg/Gly-CD(T)–[Bmim]Cl, respectively. All electrolytes produced an intense, broadband centered at ≈21.1–22.4° and small sharp peaks at around 28–32°, indicating that the κ-Cg-based membranes possess an essentially amorphous structure with a low degree of crystallinity. The sharp peaks are attributed to the presence of inorganic species.88
The diffractograms of the κ-Cg/Gly-CD(T)–[Bmim]Cl membranes with T = 250, 300 and 400 reveal a pair of peaks at 28.0 and 31.5°, whose intensity depends on the dopants' composition. The κ-Cg/Gly-[Bmim]Cl and κ-Cg/Gly-CD(250)–[Bmim]Cl samples also produce a peak at 14.7°. In contrast, the XRD patterns of the κ-Cg/Gly-CD(T) samples indicate that the peak at 46.4° is observed for T = 300 °C, while the peak at 29.1° is present for T = 400 °C. The peaks around 14.7, 29.1 and 31.5°, also reported in the case of other κ-Cg-based membranes,89,90 are tentatively assigned to intermolecular [OSO3−⋯Ca2+⋯−O3SO–] interactions. Additionally, the peak at 28.0° is indexed to the (200) crystalline plane of the structure of KCl, consistent with a face-centered cubic structure.90 The peak observed at 46.4° can be attributed to the graphitic crystalline structure present in the CDs.
These results suggest that the inclusion of [Bmim]Cl and CD(T) had a pronounced effect on the intramolecular interactions, promoting significant bonding of the [Bmim]+ ions and CD(T)s to the oxygen atoms of the –OSO3− groups of the κ-Cg chains, and concurrently leading to KCl formation. This salting-out phenomenon occurred with a different extension in each of the samples. This aspect will be revisited in the SEM/Energy Dispersive Spectroscopy (EDS) discussion below. As no pieces of evidence of crystalline CaCl2 were found in any of the XRD patterns, we infer that the guest species did not alter the intermolecular interactions involving the Ca2+ ions.
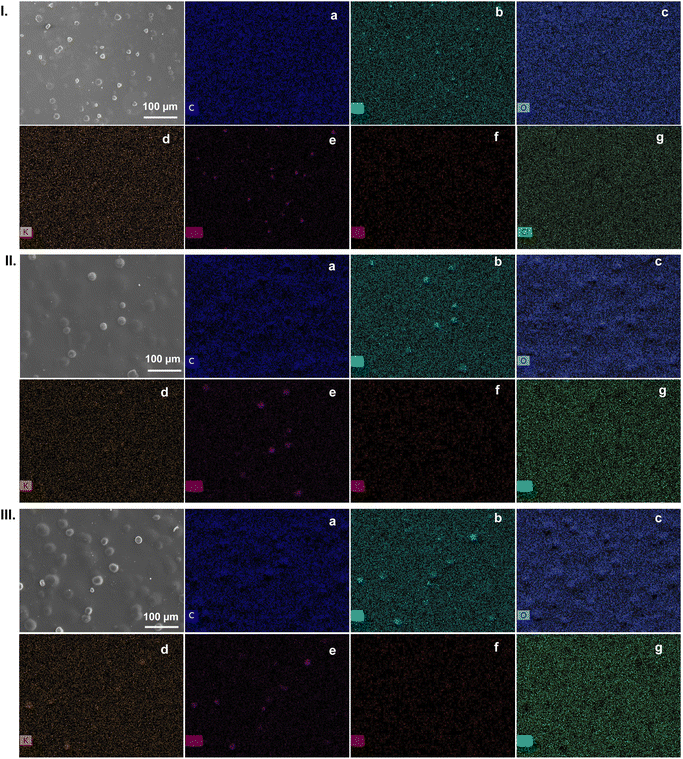
The SEM images of the κ-Cg-based films doped with [Bmim]Cl and CD(T) (T = 250, 300, and 400) reveal a homogeneous texture and some micro-aggregates with spherical shapes (Fig. 9). The EDS mapping images of the κ-Cg/Gly-CD(T)–[Bmim]Cl membranes with T = 250, 300, and 400, illustrate that these micro-objects are rich in intermolecular (OSO3−⋯Ca2+⋯−O3SO) bridges (Fig. 9a, b and c, respectively). However, the EDS mapping images of κ-Cg/Gly-CD(250) (Fig. S5, ESI†) reveal that nearly all the K+ ions were expelled from the gel as KCl (salting out), in agreement with the XRD data. Notably, KCl salting-out was observed in all the membranes analysed. Additionally, analysis of Fig. 9 indicates that [Bmim]Cl and CDs are homogeneously dispersed in the κ-Cg-based electrolytes.
FT-IR spectroscopy was used to examine structural alterations in the κ-Cg-based membranes upon doping with [Bmim]Cl and/or CDs. The analysis focused on the characteristic bands associated with functional groups present in κ-Cg (e.g., sulfate, hydroxyl, and glycosidic bonds). Shifts in band positions or changes in intensities offer valuable insights into interactions between κ-Cg and the dopants, as well as modifications in the chemical structure of the membrane.
Fig. 10 presents the FT-IR spectra of the synthesized samples in the 1900–700 cm−1 spectral range. All κ-Cg/Gly-CD(T) (in the range 4000–500 cm−1, Fig. S6, ESI†) and κ-Cg/Gly-CD(T)–[Bmim]Cl membranes displayed characteristic bands of κ-Cg.91 A broad band in the 3200–3500 cm−1 region is attributed to the ν(OH) vibration mode, resulting from –OH groups in the κ-Cg biopolymer and Gly plasticizer.91 The bands at 2935 and 2885 cm−1 correspond to the νa(CH) and νs(CH) vibration modes, respectively, of alkane groups in κ-Cg biopolymer.92 The band with maximum absorption at 1645 cm−1 (Fig. 10) in all the κ-Cg/Gly-CD(T)–[Bmim]Cl membranes is attributed to the amide I mode, primarily associated with ν(C![[double bond, length as m-dash]](https://www.rsc.org/images/entities/char_e001.gif) O) modes. A shoulder around 1575 cm−1 (Fig. 10), observed only in membranes containing [Bmim]Cl, is assigned to the ν(C
O) modes. A shoulder around 1575 cm−1 (Fig. 10), observed only in membranes containing [Bmim]Cl, is assigned to the ν(C![[double bond, length as m-dash]](https://www.rsc.org/images/entities/char_e001.gif) C) mode.93 The characteristic band of the asymmetric stretching vibration of the O
C) mode.93 The characteristic band of the asymmetric stretching vibration of the O![[double bond, length as m-dash]](https://www.rsc.org/images/entities/char_e001.gif) S
S![[double bond, length as m-dash]](https://www.rsc.org/images/entities/char_e001.gif) O bond (ν(O
O bond (ν(O![[double bond, length as m-dash]](https://www.rsc.org/images/entities/char_e001.gif) S
S![[double bond, length as m-dash]](https://www.rsc.org/images/entities/char_e001.gif) O)) (sulfate ester groups of κ-Cg) produces an absorption maximum at 1224 cm−1 (Fig. 10).94 The band at 1065 cm−1 in the FTIR spectrum (Fig. 10) is attributed to the glycosidic bond in κ-Cg. The bands at 1034 and 923 cm−1 (Fig. 10) correspond to the ν(C–O) mode, from the C–OH group and C–O glycosidic bond (linkage of 3,6-anhydro-D-galactose units), respectively. The analysis of all the spectra shows no significant changes in the functional groups of the κ-Cg membranes. Therefore, FT-IR appears to be less effective than XRD and SEM/EDS in detecting changes in the intermolecular and intramolecular interactions following doping. It is noteworthy that the presence of KCl precipitate does not, at least apparently, induce any structural alterations within the membrane, as confirmed by FT-IR analysis.
O)) (sulfate ester groups of κ-Cg) produces an absorption maximum at 1224 cm−1 (Fig. 10).94 The band at 1065 cm−1 in the FTIR spectrum (Fig. 10) is attributed to the glycosidic bond in κ-Cg. The bands at 1034 and 923 cm−1 (Fig. 10) correspond to the ν(C–O) mode, from the C–OH group and C–O glycosidic bond (linkage of 3,6-anhydro-D-galactose units), respectively. The analysis of all the spectra shows no significant changes in the functional groups of the κ-Cg membranes. Therefore, FT-IR appears to be less effective than XRD and SEM/EDS in detecting changes in the intermolecular and intramolecular interactions following doping. It is noteworthy that the presence of KCl precipitate does not, at least apparently, induce any structural alterations within the membrane, as confirmed by FT-IR analysis.
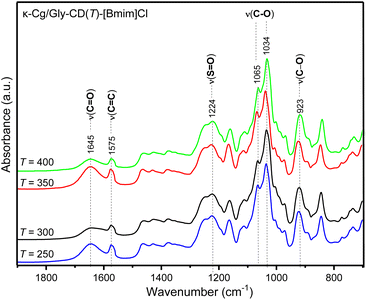 | ||
| Fig. 10 FT-IR spectra of the κ-Cg/Gly-CD(250)–[Bmim]Cl (blue line), κ-Cg/Gly-CD(300)–[Bmim]Cl (black line), κ-Cg/Gly-CD(350)–[Bmim]Cl (red line) and κ-Cg/Gly-CD(400)–[Bmim]Cl (green line) films. | ||
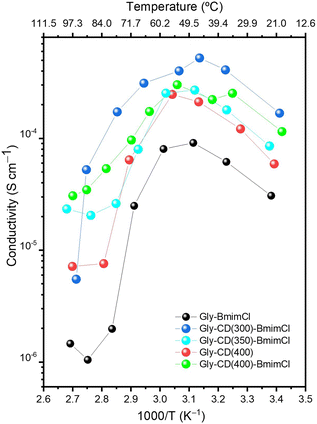
Complex impedance measurements were conducted to evaluate the influence of the CDs and [Bmim]Cl on the ionic conductivity of the κ-Cg/Gly electrolytes. Fig. 11 reproduces the Arrhenius plots of the ionic conductivity of the κ-Cg/Gly-CD(T)–[Bmim]Cl samples between 20 and 100 °C. In all samples, the Gly plasticizer was added to the sample formulation, with an optimized κ-Cg/Gly ratio of 50%, which, as shown in our previous study,8 yielded the highest ionic conductivity values of 4.2 × 10⁻⁶ and 1.2 × 10⁻⁵ S cm−1 at 30 and 50 °C, respectively.
Incorporating CD(250), CD(300) and CD(350) (Fig. S7 (red, cyanine and orange line, respectively), ESI†) into the κ-Cg/Gly electrolyte (Fig. S7, black line, ESI†) resulted in a significant decrease in the ionic conductivity by nearly 3–6 orders of magnitude. This ionic conductivity decline is likely due to KCl precipitate formation, as evidenced by XRD and SEM/EDS, which presumaly disrupted the continuity of ion transport pathways within the membranes, consequently, ion mobility, the number of charge carriers and ultimately overall conductivity were reduced.
In contrast, introducing CD(400) into κ-Cg/Gly increased the ionic conductivity by nearly 1–2 orders of magnitude, reaching maximum values of 2.5 × 10⁻⁴ and 1.2 × 10⁻⁴ S cm−1 at 30 and 60 °C, respectively. Fig. 11 reveals that an enhancement in ionic conductivity results from the addition of the CDs into κ-Cg with Gly and [Bmim]Cl. The best result of the κ-Cg/Gly-CD(T)–[Bmim]Cl series was found for the electrolyte κ-Cg/Gly-CD(300)–[Bmim]Cl (1.68 × 10⁻⁴ and 4.0 × 10⁻⁴ S cm−1 at 20 and 60 °C, respectively). In all the systems analyzed, a conspicuous inflection, followed by a major drop, is observed in the curves around 50–55 °C. This phenomenon coincides with the onset of the Tg–s8 (or UCST) and was accompanied by a significant deterioration in the mechanical properties of the samples.
Optical properties of the κ-Cg-based films
It was vital to get insight into the influence of the CD(T)s and [Bmim]Cl on the optical properties of the κ-Cg films.The host κ-Cg/Gly matrix showed excitation-dependent emission (Fig. S8, ESI†). When the excitation wavelength was increased, the emission spectra demonstrated a redshift. The maximum emission wavelength is around 425 nm upon excitation at 340 nm. Under irradiation with UV light at 365 nm, κ-Cg emits a blue color.
Fig. 12A(I) reproduces the emission spectra of the κ-Cg/Gly-CD(300) material, which shows the contribution from the host κ-Cg/Gly and CD(300). While the maximum emission wavelength from κ-Cg/Gly is located at around 425 nm, the maximum emission wavelengths of CD(300)s are excitation-dependent. When the excitation wavelength was increased, the maximum emission intensity wavelength underwent a redshift with a maximum wavelength of around 465 nm. The luminescence features of κ-Cg/Gly-CD(300)–[Bmim]Cl are similar to those of κ-Cg/Gly-CD(300) (Fig. 12A(III) and B(I), respectively), indicating that there is no evident effect of [Bmim]Cl on the luminescence. For κ-Cg/Gly-CD(400) and κ-Cg/Gly-CD(400)–[Bmim]Cl, the dominant contribution to emission is due to κ-Cg/Gly, whereas the CD(400)s give rise to relatively weaker emissions (Fig. 12A(II, IV) and B(II, IV)).
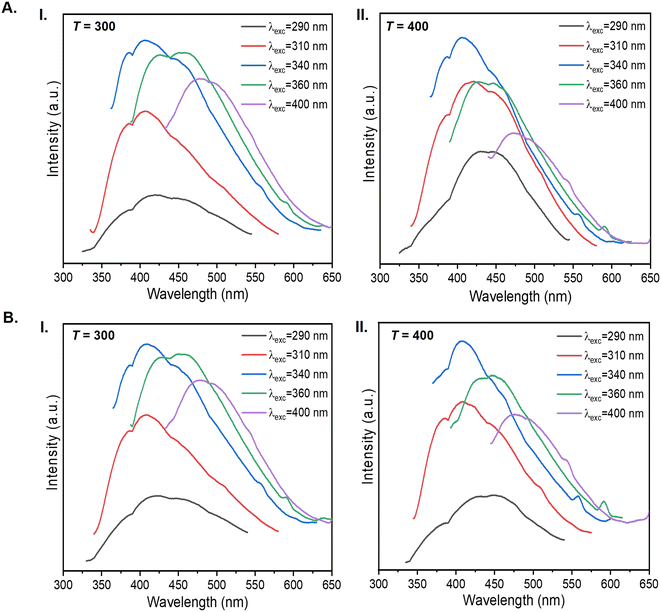 | ||
| Fig. 12 Emission spectra at different excitation wavelengths of κ-Cg/Gly-CD(T) (A) and κ-Cg/Gly-CD(T)–[Bmim]Cl (B) with T = 300 (I) and 400 (II). | ||
The Φ value of the CD(T)s embedded in the κ-Cg/Gly matrix can be affected by the interactions between the CDs and the host biopolymer. The local environment provided by the biopolymer can significantly influence the photophysical properties of the CDs. Functional groups in the κ-Cg macromolecule can interact with those at the surface of the CD(T)s. Two situations may occur. Strong interactions can hinder the electronic transitions responsible for emission, thereby reducing Φ. Conversely, weak interactions would allow the CDs to retain their emissive properties, maintaining their Φ values.
The Φ values for κ-Cg/Gly-CD(T) and κ-Cg/Gly-CD(T)–[Bmim]Cl samples with T = 300 and 400 (Table S3, ESI†) are nearly identical to those exhibited by the CD(T)s in aqueous solution, surpassing the values displayed by pristine κ-Cg/Gly (Table S3, ESI†). This indicates that the polarity, hydration levels, and functional groups of κ-Cg do not significantly alter the electronic environment and, consequently, do not modify the emission properties of the CD(T)s. Thus, the incorporation of CD(T)s into the κ-Cg/Gly matrix, in the presence or absence of [Bmim]Cl, does not affect negatively the Φ value of the CD(T)s. This effect is most likely due to the CD(T)/κ-Cg weak interactions, which prevent significant disruption of the electronic transitions responsible for emission.
The fact that the Φ value is kept constant is crucial and extremely appealing whenever applications requiring stable and predictable optical properties are envisaged. The ability to maintain the Φ value in the solid state without significant aggregation or quenching effects highlights the tremendous potential of κ-Cg matrices for the development of advanced luminescent materials.
Performance of the TTDs
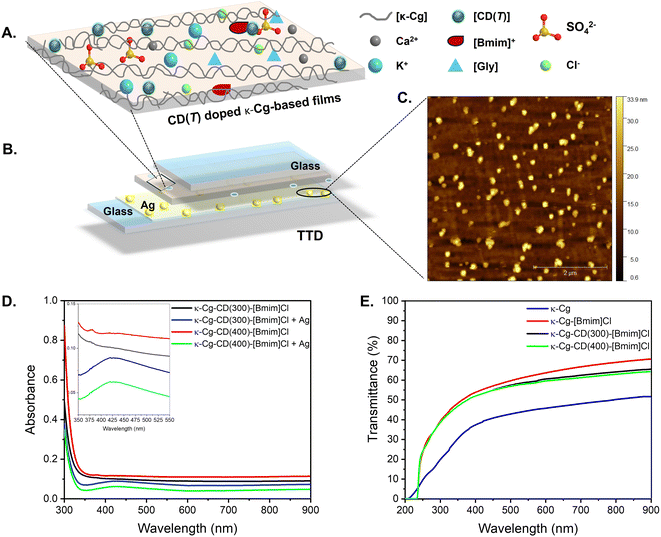
To be a suitable candidate for use as a TT layer for glazing applications, a material should fulfill the following requirements:19,95–97 (1) transmittance >85% in the transparent state (below TT, or LCST for a TT hydrogel) and transmittance <15% in the translucent state (above Tt, or LCST for a TT hydrogel); (2) switching gradient within a 10 °C range. (3) Low hysteresis, durable phase reversibility reproducible over long periods. (4) Homogeneously stable materials both above and below the TT; (5) tunable temperature switch in a wide temperature range, adaptable to both climatic and architectural needs; (6) long-term stability against UV-radiation and biodegradation; (7) non-freezing, non-toxic, non-flammable, preferably inert; (8) low cost; (9) should be manufactured to cover a large area.Four TTDs were tested. A pair of TTDs were assembled with bare glass slides between which κ-Cg/Gly-CD(300)–[Bmim]Cl film and κ-Cg/Gly-CD(400)–[Bmim]Cl films were sandwiched. In the case of the second pair of TTDs, one of the glass slides of each device included a layer of silver (Ag) islands (Fig. 13A). These islands were produced using a chemical deposition method reported by Aslan et al.98 and its formation was confirmed by Atomic Force Microscopy (AFM) (Fig. 13B and S9b, ESI†). The mechanism behind this deposition relies on the Tollens reagent and the formation of the diamine silver oxide complex, which is reduced by glucose (Fig. S10b, ESI†). The deposition of these islands aimed at inducing the SPRE to boost the TT effect.23
Interestingly, the addition of [Bmim]Cl to the pristine κ-Cg/Gly films proved to be highly beneficial from the standpoint of transmittance, leading to a significant increase in the original transparency of the κ-Cg films (Fig. 13C, blue and red lines, respectively). This result can be correlated with the major breakdown undergone by the intramolecular interactions promoted by the bonding of the [Bmim]+ ions to the oxygen atoms of the –OSO3− groups of the κ-Cg chains, at the expense of the formation of KCl.8 The co-addition of CDs and [Bmim]Cl led, however, to a slight decrease in the transmittance relative to the κ-Cg/Gly film including solely [Bmim]Cl (Fig. 13C, blue and black lines). This transmittance drop can be explained by the increase in light scattering presumably resulting from the size increase of the CDs, due to the arrangement of the [Bmim]+ cations, and the Cl− ions around their surface, virtually creating a micelle-like structure.24 It is worth noting that during the TTD assembly process, two factors favored a transparency increase, independently of the presence or absence of CDs in the films' formulation: the drying stage and the application of pressure. The phenomenon was more conspicuous when one of the glass slides included an Ag layer, substantiating the close relationship existing between the transmittance of the films and the arrangement of the κ-Cg chains. We believe the Ag islands might act as anchoring points for the polymers, thus reducing light scattering.
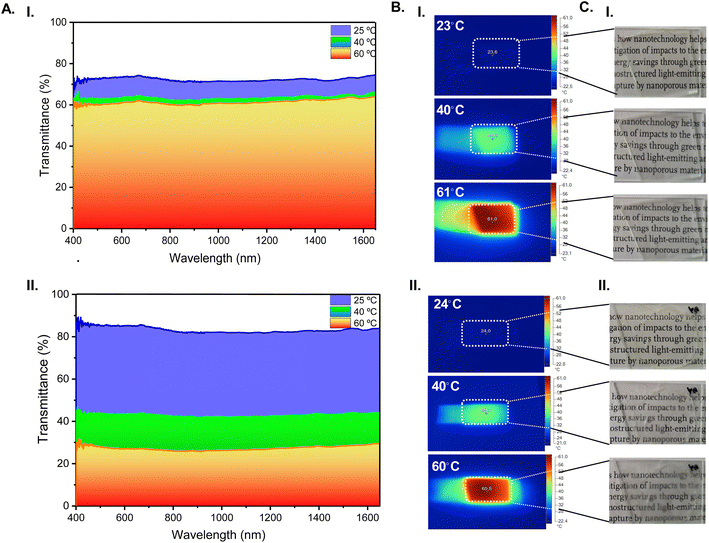
To evaluate the impact of the Ag islands on the electro-optical performance of the assembled TTDs, the UV-Vis-NIR spectra were recorded. The inset of Fig. 13D shows the presence of a weak band centered at 420 nm in the case of the TTDs comprising a glass slide with Ag islands. This band is characteristic of the Ag particles.24,97 Comparison of the behavior of the TTDs including slides devoid of Ag islands with those comprising Ag islands was essential to assess the intrinsic TT effect of the films and the influence of the SPRE. The reversibility of the transparent-to-opaque transition of the κ-Cg/Gly-CD(400)–[Bmim]Cl film was monitored through UV-Vis-NIR spectroscopy at variable temperatures (Fig. 14A). At room temperature, the TTD incorporating κ-Cg/Gly doped with [Bmim]Cl and CD(400) and operating without Ag islands displayed a transmittance of 73 and 72% at 550 and 1200 nm, respectively (Fig. 14A(I)). At the same wavelengths, the presence of Ag islands improved the transmittance to 85 and 82%, respectively (Fig. 14A(II)). The monitored temperature values were recorded with an infrared camera (Fig. 14B) and photos were taken under daylight (Fig. 14C). A comparison of thermal images and photographs confirms the remarkable impact of the Ag islands. The same effect in the overall transmission values was observed with the TTD incorporating κ-Cg/Gly doped with [Bmim]Cl and CD(300) (Fig. S11(a and d), ESI†).
A major advantage of TTDs is that they operate independently of any external input, due to their innate ability to self-regulate as a function of the temperature. Regarding the κ-Cg/Gly film doped with [Bmim]Cl and CD(400) portrayed in Fig. 14A(I), transmittance variations (ΔT) of 10/10% and 13/10% at 550/1200 nm were recorded from room temperature up to 40 and 60 °C, respectively (Table 1). In the presence of Ag islands (Fig. 14A(II)) a major increase of the ΔT values to 42/40% and 58/55% at 550/1200 nm occurred at the same temperature intervals, respectively (Table 1). The latter TTD is endowed with a sun-actuated three-mode operation: a bright hot mode (visible and NIR admitted), a semi-bright warm mode (visible and NIR semi-blocked), and a semi-dark semi-cool mode (visible and NIR further semi-blocked). We assume that a dark cool mode would represent visible and NIR blocked.
| λ (nm) | T 25 | T 40 | ΔT25-40 | T 60 | ΔT25-60 |
|---|---|---|---|---|---|
| TTD bare | |||||
| 550 | 73.1 | 63.1 | 10.0 | 60.5 | 12.6 |
| 1200 | 71.8 | 63.4 | 8.4 | 61.3 | 10.5 |
![[thin space (1/6-em)]](https://www.rsc.org/images/entities/char_2009.gif) |
|||||
| TTD Ag | |||||
| 550 | 85.2 | 43.3 | 41.9 | 27.2 | 58.0 |
| 1200 | 82.2 | 42.5 | 39.7 | 27.0 | 55.2 |
It is also worth emphasizing that the transmittance of the latter TTD in the transparent state coincides with the required value (ca. 85% at 550 and 1200 nm) (Table 1). The same does not apply to the translucent state, since the minimum transmittance attained was 27% (Table 1), thus two times higher than the ideal one.
In terms of cycling stability, the performance of the TTDs including κ-Cg/Gly-CD(400)–[Bmim]Cl was seen to remain unaffected after 10 heating/cooling cycles (Fig. 15(I and II)). The same applies to the TTDs including κ-Cg/Gly-CD(300)–[Bmim]Cl (Fig. S11(b, c, e, and f)). Moreover, these experiments demonstrated that the presence of Ag islands exerted no effect.
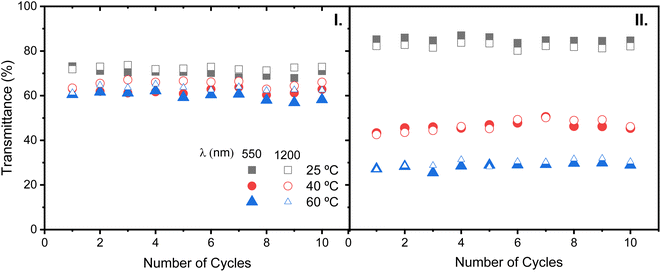 | ||
| Fig. 15 Cycling stability at 550 and 1200 nm of the TTD including a κ-Cg/Gly-CD(400)–[Bmim]Cl film: (I) bare glass slides and (II) one glass slide with a layer of Ag islands. | ||
At last, it is of interest to compare these outputs with those reported in the literature for other TTDs (Table 2). It must be pointed out that the large majority of TTD layers that have been developed during the last few years have incorporated acrylamide-containing compounds as major constituents.
| Layer | TTD configuration | T f (°C) | T i (°C) | λ (nm) | ΔT (%) | Ref. |
|---|---|---|---|---|---|---|
| a Transmittance variation, ΔT (%); Tf – final temperature; Ti – initial temperature; TPDS – thermo and pH dual-responsive starch (esterified starch); CHI – chitin; CMC-g-pDN – sodium carboxymethyl cellulose grafted to poly(2-(dimethylamino)ethyl methacrylate)-(N-isopropylacrylamide); PMMA – poly(methyl methacrylate); HPC – hydroxypropyl cellulose; PVA – poly(vinyl alcohol); PVP – poly(vinylpyrrolidone). | ||||||
| TPDS (pH = 3) | Glass/layer/glass | 20 | 35 | Vis | 40.1 | 99 |
| IR | 14.7 | |||||
| Glass/layer/glass | 15 | 60 | 550 | 50.0 | ||
| 1200 | 35.0 | |||||
| Cdotsglucose/[Bmim]Cl/[Tmi][Trif] nanofluid | Glass/layer/glass | 16 | 50 | 550 | 6.4 | 24 |
| 1200 | 8.2 | |||||
| Glass/layer/Ag/glass | 16 | 50 | 550 | 19.4 | ||
| 1200 | 21.4 | |||||
| CdotsCHI/[Bmim]Cl/[Tmi][Trif] nanofluid | Glass/layer/glass | 16 | 50 | 550 | 12.5 | 25 |
| 1200 | 8.5 | |||||
| Glass/layer/Ag/glass | 550 | 54.3 | ||||
| 1200 | 45.8 | |||||
| CMC-g-pDN | PMMA/layer/PMMA | 30 | 40 | Vis | 95 | 100 |
| IR | 30 | |||||
| HPC | Quartz/layer/quartz | 25 | 60 | 550 | 44.6 | 101 |
| 1200 | 15.0 | |||||
| HPC–PVA | 25 | 60 | 550 | 82.0 | ||
| 1200 | 70.0 | |||||
| HPC–PVP | 25 | 60 | 550 | 82.0 | ||
| 1200 | 62.0 | |||||
| κ-Cg/Gly-CD(400)–[Bmim]Cl | Glass/layer/glass | 25 | 40 | 550 | 10.0 | This work |
| 1200 | 8.4 | |||||
| 25 | 60 | 550 | 12.6 | |||
| 1200 | 10.5 | |||||
| Glass/layer/Ag/glass | 25 | 40 | 550 | 41.9 | ||
| 1200 | 39.7 | |||||
| 25 | 60 | 550 | 58.0 | |||
| 1200 | 55.2 | |||||
Few reports in the literature deal with TTD layers made entirely of polysaccharides or using polysaccharides as precursors of one of the constituents of the layer. Zhang et al.99 reported a functionalized starch with different substituents as a matrix with optimal ΔT values of 40.1% at 550 nm and 14.7% at 1200 nm, at a pH of 3 from 20 to 35 °C (Table 2). Tan et al.100 used in this context sodium carboxymethyl cellulose, together with methacrylate and isopropylacrylamide, which yielded ΔT values in the visible and NIR regions of 95 and 30%, respectively, from 30 to 40 °C. Another report worth noting on the use of polysaccharides regards TT matrices composed of hydroxypropyl cellulose (HPC) with a surfactant, which led to ΔT values 57 and 12% in the visible and NIR regions, which were enhanced to 82 and 70%, respectively, upon addition of poly(vinyl alcohol) (PVA) or poly(vinylpyrrolidone) (PVP) from 25 to 60 °C.101
Using a different strategy, glucose23 and CHI24 were used as precursors in the synthesis of CDs in the presence of [Bmim]Cl solely or with a second IL. The resulting ionanofluids demonstrated TT behavior. For the glucose-derived ionanofluid, ΔT values of 6.4 and 8.2% resulted in the visible and NIR regions, respectively, from 16 to 50 °C. With the introduction of Ag islands in the TTD configuration, the ΔT values were increased to 19.4 and 21.4%, respectively (Table 2).23 For chitin, the reported ΔT values were 12.5 and 8.5% in the visible and NIR regions for a TTD devoid of Ag islands, respectively. Aided by Ag islands, the ΔT was boosted to 54.3 and 45.8%, respectively (Table 2).24
In conclusion, apart from being competitive, the TTDs introduced in the present work provide a major advantage versus the state-of-the-art polysaccharide-based systems: the ΔT values both in the visible and NIR regions are practically coincident.
Conclusions
This work represents another unmistakable proof that natural materials are an endless source of inspiration and richness. Here, we successfully combined the principles of polymer science, with those of carbon nanomaterials and ionic liquids to develop a new co-friendly system with foreseen application in the challenging domains of energy materials and devices. These innovative systems might be used to tackle some of the most serious concerns the world is facing at present: the need to reduce dramatically energy consumption, carbon footprint, and the impacts of climate changes.For the first time, we synthesized A. donax leaf-derived CDs and incorporated them, together with the [Bmim]Cl IL, into a red seaweed-derived κ-Cg biomacromolecule. The resulting membranes obtained exhibit a series of attractive physical–chemical properties. A thorough characterization of the optical features was performed, leading to a tentative picture of the mechanisms responsible for the CDs' PL in the new membranes, highlighting the interplay between carbon core states, surface states, and dopant effects. The study illustrates that κ-Cg/Gly matrices provide a suitable environment for embedding CDs without compromising their photophysical properties since the Φ value of the isolated CDs did not change upon inclusion in the membrane medium. Moreover, the κ-Cg/Gly-CD(T)–[Bmim]Cl membranes exhibited a reversible TT behaviour from transparent at room temperature to two translucid states at 40 and 60 °C with unusually identical transmittance values in the visible and NIR. We provide the proof-of-concept of the use of this TT system in passive sun-actuated smart windows with three operating modes (bright hot, semi-bright warm, and semi-dark semi-cool) and enhanced electro-optical performance mediated by SPRE. These devices' technology offers enhanced electro-optical performance and significant economic benefits by reducing energy consumption in buildings, lowering heating and cooling costs, and contributing to overall energy efficiency. It is also applicable to smart car sunroofs in the framework of the green mobility concept.
Experimental
The materials, synthesis procedures, and characterization methods are detail in the ESI†, with a brief summary provided here. The CDs obtained from A. donax leaves were prepared following a procedure described in detail elsewhere.102 The CDs were characterized using TEM, XPS, Φ, XRD, FT-IR, UV-VIS, fluorescence spectroscopy, PL and time resolved PL measurements. The polymer electrolytes (PEs) based on κ-Cg and the guest species [Bmim]Cl, Gly and/or CDs were prepared by the solvent casting technique.8 The samples were characterized by SEM, XRD, ATR/FT-IR, bulk ionic conductivity measurements, and excitation and emission spectra. The TTD was assembled by drop-casting PE onto a glass slide, covering it with a second slide (pre-coated with silver islands if applicable), and drying at room temperature for two days before evaluation. AFM and optical characterization were used to analyse the TTD.Data availability
The data supporting this article have been included as part of the ESI.†Author contributions
S. C. Nunes: methodology, conceptualization, investigation, experiment, data curation, writing, review & editing. T. Duarte: experiment, data curation & writing. R. F. P. Pereira: methodology, investigation & experimental. L. Fu: methodology, investigation, experiment, data curation, writing & review. R. A. S. Ferreira: investigation, data curation, writing & review. P. Almeida: supervision. V. de Zea Bermudez: supervision, project administration, writing & review. The manuscript was written with the contribution of all authors. All authors have approved the final version of the manuscript.Conflicts of interest
There are no conflicts to declare.Acknowledgements
The work was funded by projects SOLPOWINS – Solar-Powered Smart Windows for Sustainable Buildings (PTDC/CTM-REF/4304/2020), financed by FCT and FEDER, NORTE2020, and A-MOVER – “Mobilizing Agenda for the Development of Products & Systems towards an Intelligent and Green Mobility”, operation no. 02/C05-i01.01/2022.PC646908627-00000069, approved under the terms of the call no. 02/C05-i01/2022 – Mobilizing Agendas for Business Innovation, financed by European funds provided to Portugal by the Recovery and Resilience Plan (RRP), in the scope of the European Recovery and Resilience Facility (RRF), framed in the Next Generation UE, for the period from 2021–2026. The authors acknowledge funding from CQ-VR (UIDB/00616/2020 (https://doi.org/10.54499/UIDB/00616/2020)) and UIDP/00616/2020 (https://doi.org/10.54499/UIDP/00616/2020), CQ-UM (UIDB/00686/2020 (https://doi.org/10.54499/UIDB/00686/2020) and UIDP/00686/2020 (https://doi.org/10.54499/UIDP/00686/2020)), CICECO-Aveiro Institute of Materials (UIDB/50011/2020, UIDP/50011/2020, and LA/P/0006/2020) and Instituto de Telecomunicações (UIDB/50008/2020 and UIDP/50008/2020), financed by National funds through the FCT/MEC (PIDDAC), and when appropriate co-financed by FEDER under the PT2020 Partnership through European Regional Development Fund (ERDF) in the frame of Operational Competitiveness and Internationalization Programme (POCI), and FibEnTech-UBI (UIDB/00195/2020 and https://doi.org/10.54499/UIDB/00195/2020), financed by National funds through the FCT/MCTES (PIDDAC). S. C. Nunes acknowledges FCT for Assistant Research contract ((2020–00805.CEEIND; https://doi.org/10.54499/2020.00805.CEECIND/CP1625/CT0001) in the scope of Scientific Employment Stimulus. R. F. P. Pereira acknowledge FCT for the contract in the scope of Decreto-Lei 57/2016 (https://doi.org/10.54499/DL57/2016/CP1377/CT0050) and for the Assistant Research contract (2023.07994.CEECIND).References
- A. Ghosh, R. Hafnaoui, A. Mesloub, K. Elkhayat, G. Albaqawy, M. M. Alnaim and M. S. Mayhoub, J. Build. Eng., 2024, 84, 108644 CrossRef.
- Y. Zhou, F. Fan, Y. Liu, S. Zhao, Q. Xu, S. Wang, D. Luo and Y. Long, Nano Energy, 2021, 90, 106613 CrossRef CAS.
- U. ur Rehman, P. Faria, L. Gomes and Z. Vale, Sustain. Cities Soc., 2023, 96, 104720 CrossRef.
- Y. Ke, J. Chen, G. Lin, S. Wang, Y. Zhou, J. Yin, P. S. Lee and Y. Long, Adv. Energy Mater., 2019, 9, 1970153 CrossRef CAS.
- T. D. Nguyen, L. P. Yeo, A. J. Ong, W. Zhiwei, D. Mandler, S. Magdassi and A. I. Tok, Mater. Today Energy, 2020, 18, 100496 CrossRef CAS.
- Y. Wang, E. L. Runnerstom and D. Milliron, Annu. Rev. Chem. Biomol. Eng., 2016, 7, 283–304 CrossRef CAS PubMed.
- Y. Zhao, H. Ji, M. Lu, J. Tao, Y. Ou, Y. Wang, Y. Chen, Y. Huang, J. Wang and Y. Mao, Nanomaterials, 2022, 12(21), 3865 CrossRef CAS.
- S. C. Nunes, R. F. P. Pereira, N. Sousa, M. M. Silva, P. Almeida, F. M. L. Figueiredo and V. de Zea Bermudez, Adv. Sustainable Syst., 2017, 1, 1700070 CrossRef.
- S. C. Nunes, S. M. Saraiva, R. F. P. Pereira, S. Pereira, M. M. Silva, L. D. Carlos, E. Fortunato, R. A. S. Ferreira, R. Rego and V. de Zea Bermudez, ACS Appl. Energy Mater., 2019, 2, 1951–1960 CrossRef CAS.
- R. Guo, Y. Shen, Y. Chen, C. Cheng, C. Ye and S. Tang, Chem. Eng. J., 2024, 486, 150194 CrossRef CAS.
- T. Udo, G. Mummaleti, A. Mohan, R. K. Singh and F. Kong, Food Res. Int., 2023, 173, 113369 CrossRef CAS.
- F. M. Santos, S. C. Nunes and V. de Zea Bermudez, Energy Adv., 2024, 3, 1766–1843 RSC.
- A. Pawlicka, J. Grote, F. Kajzar, I. Rau and M. Silva, Nonlinear Opt. Quantum Opt., 2012, 45, 113–129 CAS.
- E. Raphael, C. A. O. Avellaneda, M. A. Aegerter, M. M. Silva and A. Pawlicka, Mol. Cryst. Liq. Cryst., 2012, 554, 264–272 CrossRef CAS.
- R. Alves, F. Sentanin, R. C. Sabadini, M. Fernandes, V. de Zea Bermudez, A. Pawlicka and M. M. Silva, Electrochim. Acta, 2018, 267, 51–62 CrossRef CAS.
- A. Pawlicka, D. Dragunski, K. Guimarães and C. Avellaneda, Mol. Cryst. Liq. Cryst., 2004, 416, 105–112 CrossRef CAS.
- A. Seeboth, R. Ruhmann and O. Mühling, Materials, 2010, 3, 5143–5168 CrossRef CAS.
- C. M. Lampert, Mater. Today, 2004, 7, 28–35 CrossRef CAS.
- K. Resch and G. M. Wallner, Sol. Energy Mater. Sol. Cells, 2009, 93, 119–128 CrossRef CAS.
- S. Elmarhoum, K. Ako, C. D. Munialo and Y. Rharbi, Carbohydr. Polym., 2023, 314, 120952 CrossRef CAS PubMed.
- K. Wang, G. Chen, S. Weng, L. Hou, D. Ye and X. Jiang, ACS Appl. Mater. Interfaces, 2023, 15(3), 4385–4397 CrossRef CAS.
- A. Efimova, L. Pfützner and P. Schmidt, Thermochim. Acta, 2015, 604, 129–136 CrossRef CAS.
- H. M. R. Gonçalves, R. F. P. Pereira, E. Lepleux, T. Carlier, L. Pacheco, S. Pereira, A. J. M. Valente, E. Fortunato, A. J. Duarte and V. de Zea Bermudez, Adv. Sustainable Syst., 2019, 3, 1900047 CrossRef.
- H. M. R. Gonçalves, R. F. P. Pereira, E. Lepleux, L. Pacheco, A. J. M. Valente, A. J. Duarte and V. de Zea Bermudez, Small, 2020, 16, e1907661 CrossRef.
- T. A. G. Duarte, R. F. P. Pereira, B. Medronho, E. S. Maltseva, E. F. Krivoshapkina, A. Varela-Dopico, P. Taboada, L. Fu, R. A. S. Ferreira and V. de Zea Bermudez, Chem. Mater., 2024, 36, 1136–1152 CrossRef CAS.
- X. Xu, R. Ray, Y. Gu, H. J. Ploehn, L. Gearheart, K. Raker and W. A. Scrivens, J. Am. Chem. Soc., 2004, 126, 12736–12737 CrossRef CAS.
- N. K. K. Anuar, H. L. Tan, Y. P. Lim, M. S. So'aib and N. F. A. Bakar, Front. Energy Rev., 2021, 9, 626549 CrossRef.
- D. Ozyurt, M. A. Kobaisi, R. K. Hocking and B. Fox, Carbon Trends, 2023, 12, 100276 CrossRef CAS.
- M. P. Ajith, S. Pardhiya and P. Rajamani, Small, 2022, 18, 2105579 CrossRef.
- A. Sciortino, A. Cannizzo and F. Messina, C-J. Carbon Res., 2018, 4, 67 CrossRef CAS.
- V. K. Pandey, A. Tripathi, A. Taufeeq, A. H. Dar, A. V. Samrot, S. Rustagi, S. Malik, T. Bhattacharya, B. Kovács and A. M. Shaikh, Appl. Surf. Sci., 2024, 19, 100550 CrossRef.
- B. Ju, Y. Wang, Y.-M. Zhang, T. Zhang, Z. Liu, M. Li and S. X.-A. Zhang, ACS Appl. Mater. Interfaces, 2018, 10, 13040–13047 CrossRef CAS PubMed.
- W. Gao, S. Zhang, G. Wang, J. Cui, Y. Lu, X. Rong, Y. Luo, L. Zhang, Z. Cheng and C. Gao, Anal. Chim. Acta, 2023, 1277, 341683 CrossRef CAS.
- R. Atchudan, T. N. J. I. Edison, D. Chakradhar, S. Perumal, J.-J. Shim and Y. R. Lee, Sens. Actuators, B, 2017, 246, 497–509 CrossRef CAS.
- Y. Zhu, G. Li, W. Li, X. Luo, Z. Hu and F. Wu, Dyes Pigm., 2023, 215, 111303 CrossRef CAS.
- J. Kong, Y. Wei, F. Zhou, L. Shi, S. Zhao, M. Wan and X. Zhang, Molecules, 2024, 29(9), 2002 CrossRef CAS.
- P. Kumar, S. Dua, R. Kaur, M. Kumar and G. Bhatt, RSC Adv., 2022, 12, 4714–4759 RSC.
- W. Meng, X. Bai, B. Wang, Z. Liu, S. Lu and B. Yang, Energy Environ. Mater., 2019, 2, 172–192 CrossRef CAS.
- L. Ai, Y. Yang, B. Wang, J. Chang, Z. Tang, B. Yang and S. Lu, Sci. Bull., 2021, 66, 839–856 CrossRef CAS PubMed.
- A. Cadranel, J. T. Margraf, V. Strauss, T. Clark and D. M. Guldi, Acc. Chem. Res., 2019, 52, 955–963 CrossRef CAS.
- E. Berdimurodov, K. Berdimuradov, K. Bahodir, A. Kholikov, K. Akbarov, O. Dagdag, M. Rbaa, B. E. Ibrahimi, D. K. Verma, R. Haldhar and P. K. Mahish, Chapter 1 Recent Trends and Developments in Carbon Dots, in Carbon Dots in Biology: Synthesis, Properties, Biological and Pharmaceutical Applications, ed. B. Tukhliyivich and D. Verma. De Gruyter, Berlin, Boston, pp. , pp. 1–14 Search PubMed.
- D. Nagarajan, D. Gangadharan and S. Venkatanarasimhan, Chapter 1 - Synthetic strategies toward developing carbon dots via top-down approach, Carbon Dots in Analytical Chemistry, ed. S. Kumar Kailasa and C. Mustansar Hussain, Elsevier, 2023, pp. 1–13 Search PubMed.
- G. Ge, L. Li, D. Wang, M. Chen, Z. Zeng, W. Xiong, X. Wu and C. Guo, J. Mater. Chem. B, 2021, 9, 6553–6575 RSC.
- P. D. Modi, V. N. Mehta, V. S. Prajapati, S. Patel, J. V. Rohit, Chapter 2 - Bottom-up approaches for the preparation of carbon dots, Carbon Dots in Analytical Chemistry, ed. S. K. Kailasa and C. M. Hussain, Elsevier, 2023, pp. 15–29 Search PubMed.
- N. K. K. Anuar, H. L. Tan, Y. P. Lim, M. S. So’aib and N. F. A. Bakar, Front. Energy Res., 2021, 9, 626549 CrossRef.
- S. Sharma, R. Kumar, K. Kumar and N. Thakur, Mater. Sci. Eng. B, 2024, 305, 117414 CrossRef CAS.
- N. Tarannum, K. Pooja, M. Singh and A. Panwar, Carbon Lett., 2024, 34, 1537–1568 CrossRef.
- N. Baig, I. Kammakakam and W. Falath, Mater. Adv., 2021, 2, 1821–1871 RSC.
- J. C. G. E. da Silva and H. M. R. Gonçalves, TrAC, Trends Anal. Chem., 2011, 30, 1327–1336 CrossRef.
- S. C. Nunes, A. P. Gomes, P. Nunes, M. Fernandes, A. Maia, E. Bacelar, J. Rocha, R. Cruz, A. Boatto, A. P. Ravishankar, S. Casal, S. Anand, V. d. Z. Bermudez and A. L. Crespí, Frontiers in Plant Science - Functional, Plant Ecol., 2022, 13, 999252 Search PubMed.
- M. Perikala and A. Bhardwaj, ACS Omega, 2019, 4, 21223–21229 CrossRef CAS.
- C. Li, X. Sun, Y. Li, H. Liu, B. Long, D. Xie, J. Chen and K. Wang, ACS Omega, 2021, 6, 3232–3237 CrossRef CAS.
- https://rruff.info/graphite/display=default/R090047 .
- R. W. G. Wickoff, Cryst. struct., 1963, 1, 7–83 Search PubMed.
- C. Hu, C. Yu, M. Li, X. Wang, Q. Dong, G. Wang and J. Qiu, Chem. Commun., 2015, 51, 3419–3422 RSC.
- D. Walker, P. K. Verma, L. M. D. Cranswick, R. L. Jones, S. M. Clark and S. Buhre, Am. Mineral., 2004, 89, 204–210 CrossRef CAS.
- M. Robinson, J. Phys. Chem., 1958, 62, 925–928 CrossRef CAS.
- S. N. Jampala, M. Sarmadi, E. B. Somers, A. C. L. Wong and F. S. Denes, Langmuir, 2008, 24, 8583–8591 CrossRef CAS.
- L. Zhu, Y. Yin, C.-F. Wang and S. Chen, J. Mater. Chem. C, 2013, 1, 4925–4932 RSC.
- N.-N. Vu, S. Kaliaguine and T.-O. Do, ACS Appl. Energy Mater., 2020, 3, 6422–6433 CrossRef CAS.
- R. B. Matviiv, M. Y. Rudysh, V. Y. Stadnyk, A. O. Fedorchuk, P. A. Shchepanskyi, R. S. Brezvin and O. Y. Khyzhun, Curr. Appl. Phys., 2021, 21, 80–88 CrossRef.
- M. Saad, A. Bahadur, S. Iqbal, S. Mahmood, M. Tayyab, M. Alshalwi and M. Shah, Sci. Rep., 2024, 14, 2897 CrossRef CAS.
- J. F. Moulder, W. F. Stickle, P. E. Sobol and K. D. Bomden, Handbook of X-Ray Photoelectron Spectroscopy, Perkin-Elmer Corporation, Minnesota, 1992 Search PubMed.
- C. Zhao, F. Wei, H. Lv, D. Zhao, N. Wang, L. Li, N. Li and X. Wang, Materials, 2021, 14, 1473 CrossRef CAS PubMed.
- R. Hu, L. Li and W. J. Jin, Carbon, 2017, 111, 133–141 CrossRef CAS.
- P.-C. Hsu and H.-T. Chang, Chem. Commun., 2012, 48, 3984–3986 RSC.
- A. Dager, T. Uchida, T. Maekawa and M. Tachibana, Sci. Rep., 2019, 9, 14004 CrossRef.
- P. Nezhad-Mokhtari, N. Arsalani, M. Ghorbani and H. Hamishehkar, Biomaterials, 2018, 53, 10679–10691 CAS.
- A. Gaurav, A. Jain and S. K. Tripathi, Materials, 2022, 15, 7888 CrossRef CAS.
- K. G. Nguyen, I.-A. Baragau, R. Gromicova, A. Nicolaev, S. A. J. Thomson, A. Rennie, N. P. Power, M. T. Sajjad and S. Kellici, Sci. Rep., 2022, 12, 13806 CrossRef CAS.
- L. Feng, K. Wang, X. Zhang, X. Sun, C. Li, X. Ge and Y. Ma, Adv. Funct. Mater., 2018, 28, 1704463 CrossRef.
- A. Bhati, S. R. Anand, A. K. Garg, P. Khare and S. K. Sonkar, ACS Sustain. Chem. Eng., 2018, 6(7), 9246–9256 CrossRef CAS.
- C. Zhu, S. Yang, G. Wang, R. Mo, P. He, J. Sun, Z. Di, N. Yuan, J. Ding, G. Ding and X. Xie, J. Mater. Chem. C, 2015, 3, 8810–8816 RSC.
- S. Zhao, M. Lan, X. Zhu, H. Xue, T.-W. Ng, X. Meng, C.-S. Lee, P. Wang and W. Zhang, ACS Appl. Mater. Interfaces, 2015, 7(31), 17054–17060 CrossRef CAS.
- F. Ehrat, S. Bhattacharyya, J. Schneider, A. Löf, R. Wyrwich, A. L. Rogach, J. K. Stolarczyk, A. S. Urban and J. Feldmann, Nano Lett., 2017, 17, 7710–7716 CrossRef CAS.
- C. He, P. Xu, X. Zhang and W. Long, Carbon, 2022, 186, 91–127 CrossRef CAS.
- X. Miao, D. Qu, D. Yang, B. Nie, Y. Zhao, H. Fan and Z. Sun, Adv. Mater., 2018, 30, 1704740 CrossRef.
- K. J. Mintz, C. Poleunis, B. C. L. B. Ferreira, R. Sampson, A. Delcorte and R. M. Leblanc, Carbon, 2024, 222, 118906 CrossRef CAS.
- Y. Zhang, Y. Hu, J. Lin, Y. Fan, Y. Li, Y. Lv and X. Liu, ACS Appl. Mater. Interfaces, 2016, 8, 25454–25460 CrossRef CAS.
- F. Li, D. Yang and H. Xu, Chemistry, 2019, 25, 1165–1176 CrossRef CAS PubMed.
- Y. Xing, Y. N. Wang and H. Li, BioResources, 2024, 19, 3319–3327 CAS.
- Y. Park, J. Yoo, B. Lim, W. Kwon and S. W. Rhee, J. Mater. Chem. A, 2016, 4, 11582–11603 RSC.
- D. K. Kar, P. V, S. Si, H. Panigrahi and S. Mishra, ACS Omega, 2024, 9, 11050–11080 CrossRef CAS.
- H.-L. Yang, L.-F. Bai, Z.-R. Geng, H. Chen, L.-T. Xu, Y.-C. Xie, D.-J. Wang, H.-W. Gu and X.-M. Wang, Mater. Today Adv., 2023, 18, 100376 CrossRef CAS.
- B. S. D. Onishi, A. N. C. Neto, R. Bortolleto-Santos, V. R. Masterlaro, L. D. Carlos, R. A. S. Ferreira and S. J. L. Ribeiro, Nanoscale, 2024, 16, 6286–6295 RSC.
- Ö. Pekcan and Ö. Tari, Int. J. Biol. Macromol., 2004, 34, 223–231 CrossRef.
- K. Nishinari, S. Koide and K. Ogino, J. Phys., 1985, 46, 793–797 CrossRef CAS.
- K. Prasad, Y. Kaneko and J.-i. Kadokawa, Macromol. Biosci., 2009, 9, 376–382 CrossRef CAS PubMed.
- P. C. Selvin, P. Perumal, S. Selvasekarapandian, S. Monisha, G. Boopathi and M. V. L. Chandra, Ionics, 2018, 24, 3535–3542 CrossRef.
- S. N. Ismail, E. Ali, B. J. Alwan and A. N. Abd, Macromol. Symp., 2022, 401, 2100312 CrossRef CAS.
- D. Okolišan, G. Vlase, T. Vlase and C. Avram, Polymers, 2022, 14, 4275 CrossRef.
- J.-W. Rhim and L.-F. Wang, Appl. Clay Sci., 2014, 97–98, 174–181 CrossRef CAS.
- Y. Zhang, Y. Jia, M. Li and L. Hou, Sci. Rep., 2018, 8, 9597 CrossRef PubMed.
- P. Volery, R. Besson and C. Schaffer-Lequart, J. Agr. Food Chem., 2004, 52, 7457–7463 CrossRef CAS PubMed.
- A. Seeboth, J. Schneider and A. Patzak, Sol. Energy Mater. Sol. Cells, 2000, 60, 263–277 CrossRef CAS.
- J. Schneider and A. Seeboth, Mater. Sci. Technol., 2001, 32, 231–237 CAS.
- H. Watanabe, Sol. Energy Mater. Sol. Cells, 1998, 54, 203–211 CrossRef CAS.
- K. Aslan, Z. Leonenko, J. R. Lakowicz and C. D. Geddes, J. Fluoresc., 2005, 15, 643–654 CrossRef CAS.
- K. Zhang, Y. Shi, L. Wu, L. Chen, T. Wei, X. Jia, Z. Chen, M. Li, Y. Xu, Y. Wang, Y. Gao and X. Guo, Carbohydr. Polym., 2018, 196, 209–216 CrossRef CAS.
- Y. Tan, R. Chen, Y. Xiao, C. Wang, C. Zhou, D. Chen, S. Li and W. Wang, Appl. Mater. Today, 2021, 25, 101248 CrossRef.
- Y. Bai and Y. He, Renewable Energy, 2022, 198, 749–759 CrossRef CAS.
- X. Yang, D. Wang, N. Luo, M. Feng, X. Peng and X. Liao, Spectrochim. Acta, Part A, 2020, 239, 118462 CrossRef CAS PubMed.
Footnote |
| † Electronic supplementary information (ESI) available. See DOI: https://doi.org/10.1039/d4ta06890d |
| This journal is © The Royal Society of Chemistry 2025 |

