Co-MOF-derived core–shell CoP@Co3O4 nanoparticle loaded N-doped graphene: an efficient catalyst for the oxygen evolution reaction†
Xian-Chen
Meng
a,
Jian
Luan
 *a,
Yi
Liu
a,
Yu-Shu
Sheng
a,
Fu-Yu
Guo
a,
Peng
Zheng
b,
Wen-Long
Duan
*a and
Wen-Ze
Li
 *a
*a
aCollege of Science, Shenyang University of Chemical Technology, Shenyang, 110142, P. R. China. E-mail: jluan@syuct.edu.cn; wlduan@syuct.edu.cn; wzli@syuct.edu.cn
bKey Laboratory on Resources Chemicals and Materials of Ministry of Education, Shenyang University of Chemical Technology, Shenyang, 110142, P. R. China
First published on 19th November 2024
Abstract
Metal–organic frameworks (MOFs) and their derivatives have multiple advantages, such as controlled morphology and uniform distribution of elements, and can serve as a kind of excellent electrocatalyst. It is significant to balance the relationship between activity, conductivity and stability of catalysts for the oxygen evolution reaction (OER). The construction of an interface in composite materials is an important strategy for the preparation of catalysts for the OER. In this paper, a novel Co-MOF (Co-MOF-NH2) was synthesized by a hydrothermal method, and was mixed with melamine phosphate (P-MA) and calcined to obtain an AIP-PMA composite material. For the first time, a one-step pyrolysis method was used to embed CoP nanoparticles into the Co3O4 shell and load them on the N-doped graphene layer. As a result, the unique morphology offered more dispersed active sites and larger specific surface area, and exhibited the highest catalytic activity and electrical conductivity. Density functional theory (DFT) calculation also showed that the formation of the interface between CoP and Co3O4 made the center of the d band of Co in AIP-PMA locate far from the Fermi level, thus reducing the energy barrier for O2 release and resulting in excellent OER performance with a 1.55 V potential at a current density of 10 mA cm−2. Furthermore, the graphene coating effectively shielded the catalyst, allowing it to remain stable over time.
1. Introduction
Water is plentiful on Earth and does not pollute the environment, hence splitting water electrochemically to create hydrogen is seen as a key technology for producing clean, sustainable energy in the future.1–7 In this process, the hydrogen evolution reaction (HER) and oxygen evolution reaction (OER) play a crucial role in different electrochemical applications.8,9 Though catalysts are required to speed up the reaction process, the kinetics of the OER process at the anode remain sluggish.10,11 At present, commercial catalysts are mainly made of precious metals such as ruthenium and iridium and their oxides. However, these elements are not commonly employed due to their rarity on Earth and the expensive processing costs.12–15 Therefore, the preparation of OER catalysts using high-abundance and low-cost materials is a research topic of great significance. At present, transition metal sulfides (TMSs), transition metal phosphides (TMPs) and transition metal oxides (TMOs) have been proved to be ideal substitutes for current noble metal OER catalysts, which are widely recognized for their excellent catalytic activity, low preparation cost and high abundance.16–30 However, their efficacy during application is impacted by low specific surface area and weak electrical conductivity.31,32 Nitrogen-doped carbon-based materials have good electrical conductivity and excellent thermal stability. Therefore, loading nanoparticles of such compounds on N-doped carbon nanomaterials is one of the effective ways to solve this problem. As a result, N-doped carbon nanomaterials have a much higher OER performance when compared to TMC and TMP materials by themselves.28,29,33,34 In recent years, some researchers have devoted themselves to compounding the above two materials (TMSs/TMPs/TMOs and the carbon matrix). For example, Wang et al. synthesized N-doped CNTs using cobalt nitrate, melamine and glucose, then loaded CoS2@Co onto N-doped CNTs by oxidation and revulcanization.35 It is reported that metal oxides have higher catalytic activity, while metal sulfides and phosphates etc. have better electrical conductivity, so the combination of metal oxides, phosphides and the carbon matrix is conducive to balancing the contradiction between catalytic activity, electrical conductivity and stability of the catalyst.36 But such an approach usually requires a complex process and requires strict means to control its shape and structure.Metal–organic frameworks (MOFs) are ordered porous crystal materials connected by metal ions and organic ligands through coordination bonds. Their structural controllability and large specific surface area make them have a wide range of application prospects.37 Various metal-based and carbon-based materials can be designed and prepared by using the structural characteristics of the combination of metal components and carbon-rich organic compounds from MOF materials.38 MOFs can serve as precursors for pyrolysis, and their metal ions (such as Fe3+, Co2+, Ni2+, etc.) can be used as catalysts to catalyze the nucleation of carbon atoms, while the decomposition of organic ligands provides sufficient carbon sources.39 Compared with traditional catalytic chemical vapor deposition (CCVD), it has a more straightforward process flow, and modifying the metals and ligands in the MOF material as well as the duration and temperature of the heat treatment may also regulate the shape of generated materials,40 such as carbon nanotubes (CNTs),41,42 porous carbon,43,44 graphitized carbon nanosheets, etc.45,46 For example, Liu et al. used ZIF-67 as a precursor for mixed calcination with red phosphorus to obtain Co2P nanoparticles coated with carbon shells with good electrochemical properties.47 However, there are relatively few reports on the preparation of electrocatalysts using MOFs, and most of them use traditional MOFs (such as MOF-74, ZIF-67, ZIF-8, etc). Therefore, it is necessary to explore more novel structures of MOF materials for the preparation of carbon-based composites.
Based on the above considerations, we have synthesized six two-dimensional layered Co-MOFs with Co as the central atom, N,N′-bis(3-pyridinecarboxamide)-1,4-butane (3-dpyb) as the main ligand, and 5-R-isophthalic acid (R![[double bond, length as m-dash]](https://www.rsc.org/images/entities/char_e001.gif) H, CH3, OH, SO3, NH2, NO2) as the auxiliary ligand by a hydrothermal method, namely, Co-MOF-H, Co-MOF-CH3, Co-MOF-OH, Co-MOF-SO3, Co-MOF-NH2, and Co-MOF-NO2. The above six kinds of Co-MOFs were simply mixed with melamine polyphosphate (P-MA) and then placed in a horizontal tube furnace, heated to 800 °C in an N2 atmosphere and calcined for 1 h to obtain nitrogen-doped carbon nanomaterials loaded with Co3O4 and CoP. In contrast, the Co and Co3O4-loaded N-doped carbon composites were obtained by mixing melamine (MA) instead of P-MA with Co-MOFs and calcining with the same method. Among them, AIP-PMA has the most excellent OER catalytic activity due to its unique N-doped graphene supported CoP@Co3O4 core–shell structure, with an overpotential of 320 mV at a current density of 10 mA cm−1. Moreover, the CoP@Co3O4 active site is embedded in the graphene layer to greatly improve its stability. To the best of our knowledge, simultaneous realization of the preparation of Co3O4 coated CoP and embedding it inside a graphene layer in one step has never been reported before. Therefore, this paper provides a new strategy for the preparation of complex hierarchical structure catalysts, and simplifies the production process, which provides a more convenient possibility for large-scale industrial production of complex structure catalysts. At the same time, HIP-PMA and MIP-PMA also showed excellent OER activity, with overpotentials of 340 mV and 350 mV, respectively, which were better than that of commercial catalyst RuO2 (360 mV). Furthermore, the mechanism of the high-efficiency electrocatalytic performance of AIP-PMA had been investigated by DFT calculation. The results showed that AIP-PMA has the smallest energy barrier for the RDS, which is more conducive to O2 desorption and thus increases the reaction rate. In comparison to traditional MOFs, all experimental data indicate that the novel MOFs have considerable promise as well. Thus, in order to address any issue that arises at the moment, we want to keep researching new MOFs and the materials that are derived from them.
H, CH3, OH, SO3, NH2, NO2) as the auxiliary ligand by a hydrothermal method, namely, Co-MOF-H, Co-MOF-CH3, Co-MOF-OH, Co-MOF-SO3, Co-MOF-NH2, and Co-MOF-NO2. The above six kinds of Co-MOFs were simply mixed with melamine polyphosphate (P-MA) and then placed in a horizontal tube furnace, heated to 800 °C in an N2 atmosphere and calcined for 1 h to obtain nitrogen-doped carbon nanomaterials loaded with Co3O4 and CoP. In contrast, the Co and Co3O4-loaded N-doped carbon composites were obtained by mixing melamine (MA) instead of P-MA with Co-MOFs and calcining with the same method. Among them, AIP-PMA has the most excellent OER catalytic activity due to its unique N-doped graphene supported CoP@Co3O4 core–shell structure, with an overpotential of 320 mV at a current density of 10 mA cm−1. Moreover, the CoP@Co3O4 active site is embedded in the graphene layer to greatly improve its stability. To the best of our knowledge, simultaneous realization of the preparation of Co3O4 coated CoP and embedding it inside a graphene layer in one step has never been reported before. Therefore, this paper provides a new strategy for the preparation of complex hierarchical structure catalysts, and simplifies the production process, which provides a more convenient possibility for large-scale industrial production of complex structure catalysts. At the same time, HIP-PMA and MIP-PMA also showed excellent OER activity, with overpotentials of 340 mV and 350 mV, respectively, which were better than that of commercial catalyst RuO2 (360 mV). Furthermore, the mechanism of the high-efficiency electrocatalytic performance of AIP-PMA had been investigated by DFT calculation. The results showed that AIP-PMA has the smallest energy barrier for the RDS, which is more conducive to O2 desorption and thus increases the reaction rate. In comparison to traditional MOFs, all experimental data indicate that the novel MOFs have considerable promise as well. Thus, in order to address any issue that arises at the moment, we want to keep researching new MOFs and the materials that are derived from them.
2. Experimental section
2.1. Synthesis of {[Co(3-dpyb)0.5(5-AIP)(H2O)]·2H2O}n (Co-MOF-NH2)
In a 25 mL Teflon-lined autoclave, a combination of CoCl2·6H2O (0.047 g, 0.20 mmol), 3-dpyb (0.030 g, 0.10 mmol), 5-H2AIP (0.027 g, 0.15 mmol), NaOH (0.008 g, 0.20 mmol), and H2O (6 mL) was heated at 120 °C for 4 days. Following that, the mixture in the autoclave was naturally cooled to room temperature, resulting in the formation of purple block crystals of Co-MOF-NH2 (46% yield based on Co). Theoretical values of elemental analysis for C16H20CoN3O8 (%): C, 43.55; N, 9.52; H, 4.57; found: C, 43.52; N, 9.52; H, 4.57. FTIR (KBr, cm−1): 3130 (s), 1660 (m), 1600 (m), 1550 (s), 1480 (m), 1400 (s), 1320 (w), 1200 (w), 1160 (w), 1120 (w), 1040 (w), 1000 (w), 964 (w), 941 (w), 910 (w), 775 (w), 739 (w), 704 (w). The synthesis of Co-MOF-H, Co-MOF-CH3, Co-MOF-OH, Co-MOF-SO3, and Co-MOF-NO2 was identical to that of Co-MOF-NH2, with the exception of the auxiliary ligand, as detailed in the ESI.†2.2. Synthesis of Co-MOF-C
Firstly, all these MOFs prepared by the above-mentioned methods were purified by ultrasonication in DIW and then dried naturally. After that, each of the materials was ground with melamine and melamine polyphosphate in a mortar respectively. Finally, the mixture was placed into the horizontal tube furnace and calcined to 700 °C, 800 °C and 900 °C in N2 with a heating rate of 10 °C min−1 for 1 h and cooled to room temperature, denoted as BDC-MA, BDC-PMA (yield: 29% based on Co-MOF-H), MIP-MA, MIP-PMA (yield: 16% based on Co-MOF-CH3), HIP-MA, HIP-PMA (yield: 10% based on Co-MOF-OH), SIP-MA, SIP-PMA (yield: 11% based on Co-MOF-SO3), AIP-MA, AIP-PMA (yield: 11% based on Co-MOF-NH2), and NIP-MA, NIP-PMA (yield: 32% based on Co-MOF-NO2).3. Results and discussion
3.1. Design and preparation of the precursor MOFs and catalyst
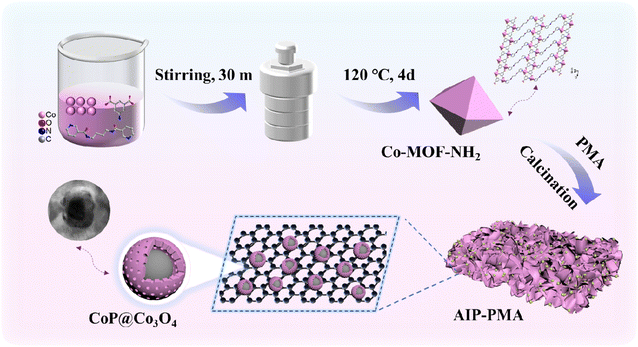
The preparation process of AIP-PMA is shown in Scheme 1. The precursor MOF was prepared by a hydrothermal method. CoCl2·6H2O, 3-dpyb and 5-amino-isophenic acid were dispersed into aqueous NaOH solution, and then put into an autoclave and heated at 120 °C for 4 days and the purple crystal Co-MOF-NH2 was obtained (the other five Co-MOFs had similar synthesis methods, see the ESI†). Compared with traditional MOFs, the novel MOF had a longer organic ligand branch chain and higher carbon content, provided a more abundant carbon source in the subsequent carbonization process, and dispersed metal ions to a certain extent, making the carbonized material more uniform. Co-MOFs were prepared by selecting auxiliary ligands containing different functional groups, introducing different numbers of O, N and S atoms and obtaining different structures and coordination forms. Meanwhile, the thermal decomposition temperature and rate were also fine-adjusted, which became one of the key factors for different Co-MOFs to obtain different morphologies by one-step pyrolysis. The six precursor MOFs were mixed with P-MA and fully ground, then put into a horizontal tube furnace and heated to 800 °C at a heating rate of 10 °C min−1 and maintained at this temperature for 1 h. The final products were named BDC-PMA, MIP-PMA, HIP-PMA, SIP-PMA, AIP-PMA, and NIP-PMA. In these products, PMA not only provides high-quality additional carbon and nitrogen sources, but also cleverly introduces the P element and generates the CoP catalyst active site. This approach solved the complex step-by-step process of carbonization of MOF-derived materials followed by phosphating with hypophosphite salt, while no hazardous gases such as PH3 were generated. For comparison, the six precursor MOFs were mixed with MA and calcined using the same process. The products were named BDC-MA, MIP-MA, HIP-MA, SIP-MA, AIP-MA, and NIP-MA. Among these calcined products, MIP-PMA, HIP-PMA, and AIP-PMA yielded carbon nanomaterials supported by CoP and Co3O4, which became a key factor in their superiority over commercial catalysts. AIP-PMA had the best electrochemical performance due to its unique graphene-supported core–shell structure morphology and large specific surface area.3.2. Crystal structure analysis of Co-MOF-NH2
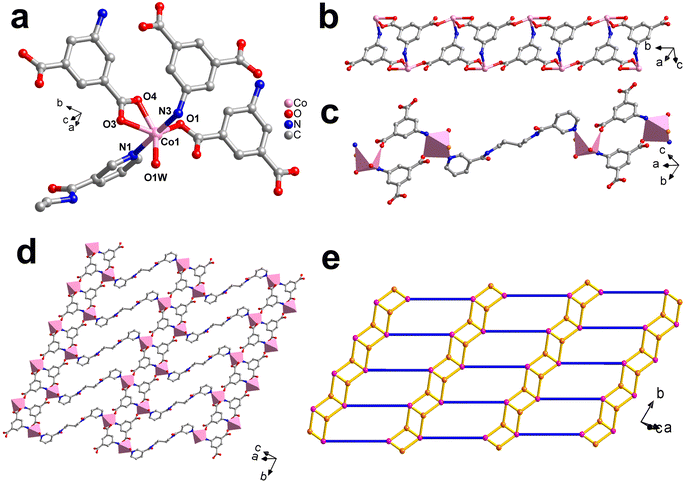
Co-MOF-NH2 was proved to belong to the P–1 space group of the triclinic system by crystallographic analysis. The central Co(II) ion was coordinated with one pyridine N atom from a 3-dpyb ligand, one N atom from a 5-AIP anion, three O atoms from two 5-AIP anions, and one coordinated water molecule (Fig. 1a). Here, the bond lengths of Co–O and Co–N are in the range of 2.1068(15)–2.3007(15) Å, which are all in the normal ranges. In this structure, a 5-AIP anion was coordinated with three Co(II) ions, which generated a 1D [Co(5-AIP)]2n ladder-like chain (Fig. 1b). Moreover, the 3-dpyb ligands connected two [Co2(5-AIP)2] binuclear units via Co(II) ions (Fig. 1c), which expanded the ladder-like chain to a 2D layer (Fig. 1d). From the topological view, if each 5-AIP anion and Co(II) ion is considered as a 3/5-connected node and the 3-dpyb ligand serves as a linker, the structure of Co-MOF-NH2 can be simplified as a {42·65·83} network (Fig. 1e).3.3. Characterization of the precursor MOFs and catalyst
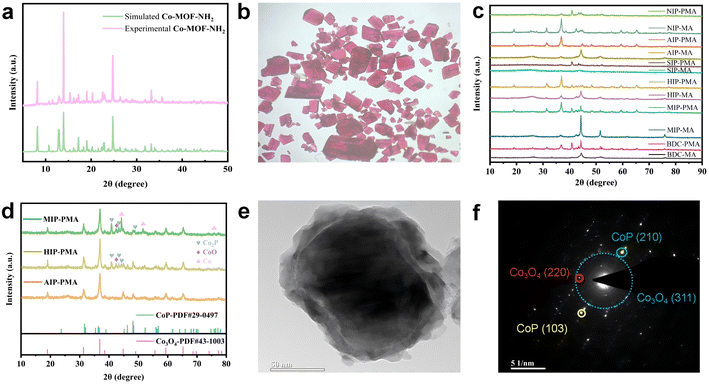
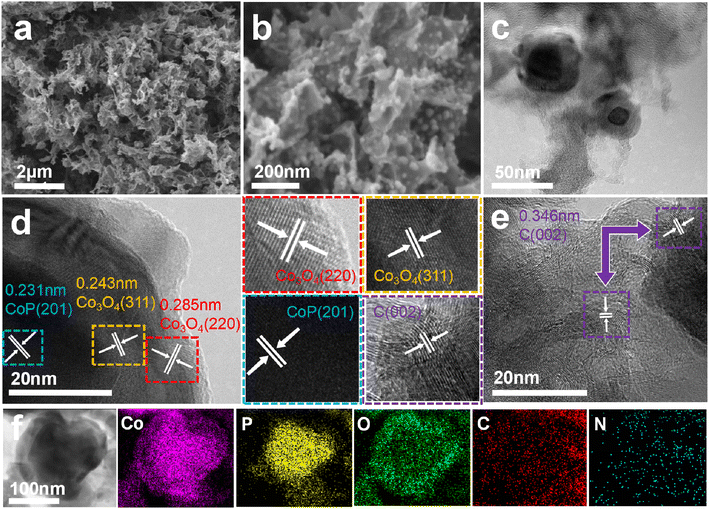
The measured PXRD patterns of precursor MOFs matched well with their simulated patterns based on the single crystallographic data, which confirmed the successful synthesis of the corresponding Co-MOFs (Fig. 2a). Fig. 2c showed the PXRD patterns for different samples, which confirmed their crystallinity, composition and structure. In them, peaks from Co3O4 and CoP in AIP-PMA showed a near-perfect fit to the Co3O4 standard pattern (PDF#43-1003) and CoP standard pattern (PDF#29-0497) respectively, which confirmed the two substances existed in the samples. Moreover, peaks located from 40° to 44° in MIP-PMA and HIP-PMA are attributed to Co2P, CoO and Co0 (Fig. 2d). Typical crystal planes of Co3O4 and CoP in AIP-PMA were proved by TEM and corresponding selected area electron diffraction (SAED), which further verified the phase structure of AIP-PMA (Fig. 2e and f). By comparing the phase composition of the three samples, it can be found that AIP-PMA had the most desired phase, which was also one of the factors that ensured that AIP-PMA had the best performance in electrocatalysis. The PXRD patterns of MIP-MA, HIP-MA, and AIP-MA are displayed in Fig. S12,† which are mainly composed of Co and Co oxide.Fig. 3a and b show the scanning electron microscope (SEM) images of AIP-PMA. The macroscopic morphology of AIP-PMA is shown as a folded graphene layer. With further amplification, it can be clearly observed that spherical nanoparticles with a diameter of about 10 nm were uniformly loaded on the graphene layer without agglomeration. The microstructure of AIP-PMA was examined by transmission electron microscopy (TEM) (Fig. 3c). It can be found that the nanospheres loaded on the graphene layer are concentric spherical core–shell structures. High-resolution transmission electron microscopy (HRTEM) captured clear lattice fringes, in which the fringe spacing of 0.231 nm was from the CoP (201) crystal plane, while the fringes of 0.243 nm and 0.285 nm were from the Co3O4 (311) and (220) crystal planes (Fig. 3d). At the same time, we also photographed a large number of clear lattice fringes from the C (002) crystal face on the graphene layer coated with CoP@Co3O4 (Fig. 3e). Elemental mapping images were used to detect the distribution of each element in the sample (Fig. 3f), in which C element was mainly from the graphene layer on the outside of the nanoparticles, and N element existed in a small amount in the form of defects in the graphite carbon layer, while Co element was concentrated on the entire surface of the nanoparticle. It is worth noting that the P element was concentrated in the center of the nanoparticle, but the O element was only concentrated in the outer layer of the nanoparticle, which fully proved the core–shell structure of CoP@Co3O4. A thorough analysis of the breakdown of P-MA by L. Costa et al.48 led us to hypothesize that, although several intricate mechanisms of decomposition and reaction played a role in the production of this morphology, the primary drivers may be traced back to the following three stages. The decomposition of P-MA will produce free MA, phosphate, CO and other gases, wherein MOF itself and the CO produced by the decomposition of melamine phosphate will reduce Co2+ to Co0, and then Co0 will further react with the P component produced in the decomposition process to produce CoP. The final remaining O reacted with either Co0 or part of the CoP to produce Co3O4.
Thermogravimetry (TG) curves are shown in Fig. S25,† which can provide appropriate calcination conditions through measuring the pyrolysis temperature of different samples. Most of the previous phosphating or vulcanization work was a step-by-step process of carbonizing the precursor and then post-processing instead of one-step pyrolysis. One of the important reasons was that at the low thermal decomposition temperature of doping components, the released elements such as N, P, and S will poison the metal catalyst and corrode the carbon substrate, resulting in carbon loss or failure to nucleate.49,50 It can be seen from the TG curve here that the thermal decomposition temperature of each sample was about 350–450 °C, while the release of PMA started from 330 °C as water, ammonia and MA (Fig. S26†). At this time, the P component changes into different forms many times, but does not decompose. When the temperature was higher than 410 °C, the P component began to decompose slowly and finally completes the decomposition at about 650 °C,48 which made the doping component have no great influence on the carbonization process. In addition, it can be found that AIP-PMA had the most gentle thermal decomposition curve, which also provided good conditions for carbon nucleation.
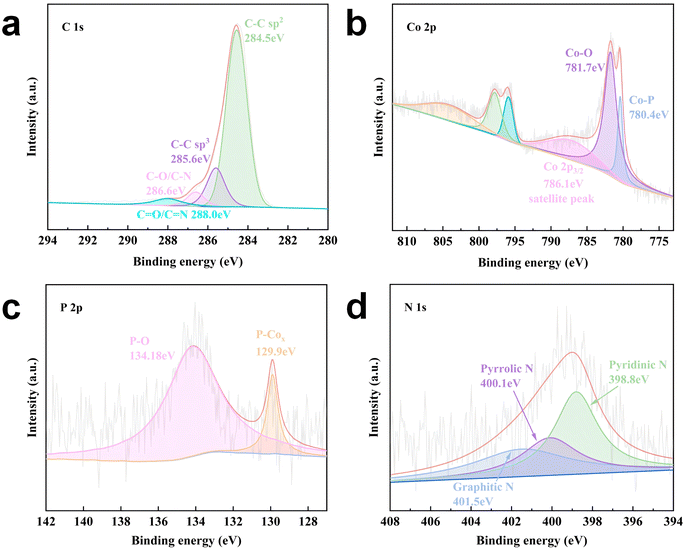
The X-ray photoelectron spectroscopy (XPS) full survey spectra are displayed in Fig. S27,† from which it can be clearly observed that C, N, O, Co, and P exist in the AIP-PMA sample. Fig. 4a shows four peaks in the high-resolution XPS spectrum of C 1s of this sample. The peak at 284.5 eV was associated with C![[double bond, length as m-dash]](https://www.rsc.org/images/entities/char_e001.gif) C, and C–C, C–O/C–N, and C
C, and C–C, C–O/C–N, and C![[double bond, length as m-dash]](https://www.rsc.org/images/entities/char_e001.gif) O/C
O/C![[double bond, length as m-dash]](https://www.rsc.org/images/entities/char_e001.gif) N were found at 285.6 eV, 286.6 eV, and 288.0 eV. The Co 2p spectrum of the AIP-PMA sample indicated that the binding energies of the Co 2p3/2 peaks located at 780.4 eV, 781.7 eV and 786.1 eV could be assigned to the Co–P in CoP, Co–O in Co3O4 and the satellite peak, respectively (Fig. 4b). Furthermore, the Co 2p1/2 peaks of the AIP-PMA sample possessed similar peak assignments to those of Co 2p3/2. Meanwhile, the P 2p spectrum showed two peaks at 129.9 eV and 134.18 eV, which correspond to P–Cox and P–O, respectively (Fig. 4c). Moreover, the Co 2p spectrum together with the P 2p spectrum further confirmed that CoP existed in the sample as well as the bonding with Co3O4. The N 1s spectrum displayed three peaks of graphitic-N (401.5 eV), pyrrolic-N (400.1 eV), and pyridinic-N (398.8 eV), respectively (Fig. 4d). Oxygen catalysis can be aided by the electronic effects of these N forms in the carbon matrix.47 In addition, it was thought that the key to CoP@Co3O4 being successfully embedded in the carbon layer was N atoms of the carbon layer's C atoms connecting with CoP@Co3O4.51
N were found at 285.6 eV, 286.6 eV, and 288.0 eV. The Co 2p spectrum of the AIP-PMA sample indicated that the binding energies of the Co 2p3/2 peaks located at 780.4 eV, 781.7 eV and 786.1 eV could be assigned to the Co–P in CoP, Co–O in Co3O4 and the satellite peak, respectively (Fig. 4b). Furthermore, the Co 2p1/2 peaks of the AIP-PMA sample possessed similar peak assignments to those of Co 2p3/2. Meanwhile, the P 2p spectrum showed two peaks at 129.9 eV and 134.18 eV, which correspond to P–Cox and P–O, respectively (Fig. 4c). Moreover, the Co 2p spectrum together with the P 2p spectrum further confirmed that CoP existed in the sample as well as the bonding with Co3O4. The N 1s spectrum displayed three peaks of graphitic-N (401.5 eV), pyrrolic-N (400.1 eV), and pyridinic-N (398.8 eV), respectively (Fig. 4d). Oxygen catalysis can be aided by the electronic effects of these N forms in the carbon matrix.47 In addition, it was thought that the key to CoP@Co3O4 being successfully embedded in the carbon layer was N atoms of the carbon layer's C atoms connecting with CoP@Co3O4.51
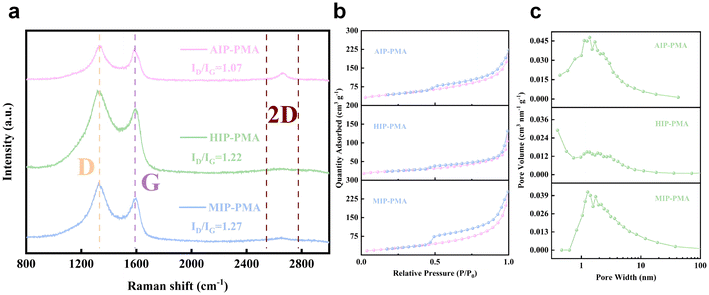
Raman spectroscopy was used to characterize the form of carbon in the sample (Fig. 5a). The D-band at about 1330 cm−1 reflects the carbon defect in the sample, while the intensity of G-band at about 1580 cm−1 reflects the degree of graphitization of carbon in the sample. The value of ID/IG is usually used to evaluate the disorder degree of graphite, and among the samples AIP-PMA has the smallest value of 1.07. In addition, the 2D peaks of the Raman spectrum can also be clearly observed at the position of 2600 cm−1, which was considered to be an important feature of graphene, and AIP-PMA shows the sharpest peak morphology, proving the existence of graphene. Brunauer–Emmett–Teller (BET) analysis was conducted to evaluate the pores and specific surface area of the samples. The N2 adsorption/desorption curves of the samples are shown in , among which AIP-PMA and MIP-PMA had the largest specific surface area of 121 cm3 g−1, which was larger than that of HIP-PMA (70 cm3 g−1). Meanwhile, the pore size distributions of the samples are also shown in Fig. 5c. It can be seen that all three catalysts showed a type-IV isotherm, which can be attributed to the slit between the graphene layers. And each catalyst had a different number of micropores and mesoporous pores, which improved the specific surface area of the sample and was also conducive to the mass transfer process of the OER. The large specific surface area enables the catalyst to expose more active sites, and also reduces the diffusion resistance to a certain extent, which improves the performance of the catalyst during the catalytic process.
3.4. Analysis of electrochemical performance of the catalyst
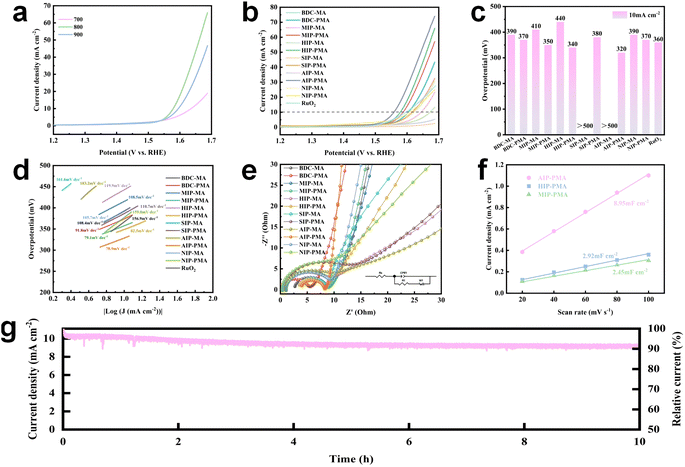
The electrochemical properties of Co-MOF derived materials were measured in 1 M KOH aqueous solution using a three-electrode system. First, the materials calcined at 700 °C, 800 °C and 900 °C were measured for linear scan sweep voltammetry (LSV), and the results obtained for each catalyst are consistent with those shown in Fig. 6a. Therefore, the catalysts used in the subsequent experiments were all calcined at 800 °C. By comparing the LSV curves of Co-MOF derived materials with RuO2 (Fig. 6b and c), it can be obviously observed that the overpotential of MIP-PMA, HIP-PMA and AIP-PMA at 10 mA cm−1 was lower than that of commercial catalyst RuO2 (360 mV). Among them, AIP-PMA had the lowest overpotential of 320 mV. Meanwhile, by comparing with MA series materials, it can be found that the overpotential of PMA series materials was generally lower than that of MA series materials, which indicated that the introduction of P improves the performance of the catalyst. In addition, AIP-PMA had the highest electrochemical performance, demonstrating that its unique hierarchical structure played a key role in the OER. The LSV curves of each material were further fitted to obtain the corresponding Tafel slope (Fig. 6d). AIP-PMA had a minimum Tafel slope of 78.9 mV dec−1. This indicated that the surface environment of AIP-PMA had the optimal ion diffusion rate and path for the OER, and also proved that the synergistic effect of CoP with Co3O4 and N-doped graphene in AIP-PMA promotes the OER reaction kinetics and improves the intrinsic activity.Fig. 6e and S38† showed the electrochemical impedance spectra (EIS) of each sample. By comparing the semicircle diameter formed by each curve in Fig. 6e, it can be clearly observed that AIP-PMA had the smallest charge transfer resistance, while in the low frequency region AIP-PMA showed the largest slope, indicating that it had the fastest ion diffusion rate and plays an important role in the mass transfer process of the OER.50 The graphitization degree of carbon played a decisive role in the size of the charge transfer resistance of the catalyst, indicating that AIP-PMA had the smallest impedance value consistent with the above Raman results. Cyclic voltammetry (CV) tests (Fig. S39†) at different sweep speeds were performed in the non-faraday interval to calculate the double-layer capacitance (Cdl) of each sample (Fig. 6f). Electrochemically active surface area (ECSA) was proportional to the double-layer capacitance (Cdl). Therefore, AIP-PMA had the largest electrochemical active area (8.95 mF cm−2), which was higher than that of HIP-PMA (2.92 mF cm−2) and MIP-PMA (2.45 mF cm−2). This indicated that AIP-PMA had the largest electrochemically active surface area (ECSA) and the most abundant electrochemical active sites, thus improving its OER performance. This was also consistent with the above BET test results. Finally, the stability of the catalyst during operation was an important parameter in practical application. The stability of AIP-PMA was evaluated by a chronocurrent method (I–t). As shown in Fig. 6g, AIP-PMA exhibited only about 10% degradation after continuous operation for 10 h at the current density of 10 mA cm−2. This indicates that AIP-PMA can provide a relatively stable current density at a constant voltage, and it was hard to deactivate the catalyst due to degradation. Furthermore, the XPS spectra of AIP-PMA after the OER test were investigated. The high-resolution XPS spectrum of Co 2p after the reaction showed a shift to the position of low binding energy, accompanied by a significant increase in the intensity of the peak of Co3+ and a significant decrease in the intensity of the peak of Co2+ (Fig. S40†), indicating the surface reconstruction of AIP-PMA and the formation of CoOOH.52
3.5. DFT calculation
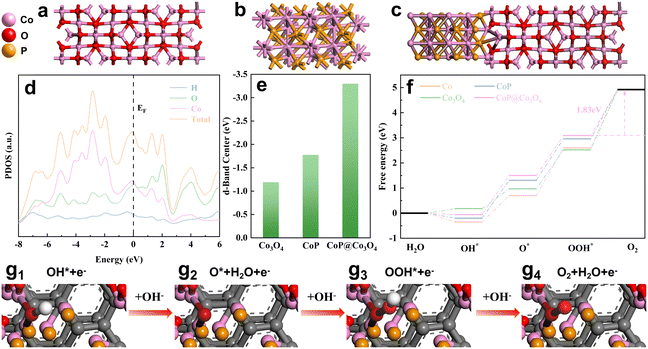
In order to further explore the reasons for the performance improvement of AIP-PMA in the OER process, a deeper analysis of AIP-PMA through density functional theory (DFT) calculation was conducted. Using graphene as the substrate, Co3O4 and CoP of a single phase were modeled respectively (Fig. 7a and b), and a CoP@Co3O4 model was established based on the structures observed by TEM (Fig. 7c). The energy band structure diagram of CoP@Co3O4 (Fig. S41†) showed that there was no band gap near the Fermi level, which indicated that the non-metallic CoP@Co3O4 had a metallic state, which made AIP-PMA possess high electronic conductivity.53 This conclusion was consistent with the results obtained by the EIS test. The projected density of states of the CoP@Co3O4 is shown in Fig. 7d. The high peak strength at the Fermi level proves that the catalyst has a large electron density near the active center, resulting in its excellent electrochemical performance. In addition, the corresponding d-band centers can be calculated based on the projected density of states (PDOS) curves of CoP@Co3O4 as well as those of CoP and Co3O4 (Fig. S42†). According to the d-band center theory, the 2p orbital of O2 adsorbed on the catalyst surface will preferentially form a reformed energy band with the sp orbital of the metal, which will continue to interact with the d orbital of the metal, forming a bonding orbital with a lower energy than the reformed energy band and an anti-bonding orbital with a higher energy than the d orbital. The Fermi level refers to the hypothetical energy level where the probability of being occupied by electrons is 1/2 in thermodynamic equilibrium, so it is believed that all electrons are below the Fermi level, and there are almost no electrons above the Fermi level, so the closer the Fermi level is, the more electrons there are, the higher the anti-bonding energy, and the level of anti-bonding orbital was determined by the center of the d orbital. The closer the center of the d-band was to the Fermi level (where electrons are filled so that they cannot be refilled to the antibonding orbital), the more stable the bond and the greater the adsorption strength. In contrast, the center of the d-band was far from the Fermi level, the bond was unstable, and the adsorption strength was weakened. The calculated d-band centers of Co3O4, CoP, and CoP@Co3O4 are shown in Fig. 7e, where CoP@Co3O4 has its d-band center farthest from the Fermi level (−3.61 eV), which is good proof that CoP@Co3O4 had a decreased adsorption strength for the reaction intermediates. This was beneficial to the release of O2, thus accelerating the OER process of AIP-PMA.53 In order to more strongly verify the above conclusion, it was analyzed the Gibbs free energy changes of Co, Co3O4, CoP and CoP@Co3O4 at four steps of the OER at 0 electric potential (Fig. 7f). Current studies generally believe that catalyst activity is closely related to each step in the OER process. The four-step intermediate adsorption model and electron transfer situation are shown in Fig. 7g1–g4, where the proton/electron transfer step with the largest free energy change (ΔGmax) is defined as the rate-determining step (RDS) and it restricts the occurrence of the OER.54,55 In summary, step 4 (OOH* → O2) of the OER process was identified as the RDS by comparing the ΔG of the various steps, and CoP@Co3O4 clearly showed that step 4 of the OER process had the lowest ΔG value (1.83 eV). This can be attributed to the fact that the formation of the Co3O4 and CoP interface reduced the energy barrier for the RDS, thereby increasing the catalytic activity of the OER. The identification of the RDS as the fourth step indicated that the release of O2 was the key factor affecting the OER rate. Therefore, CoP@Co3O4 reduced the energy barrier for O2 release, which was consistent with the above analysis results for PDOS, and revealed the reason for the increase in the catalytic activity of AIP-PMA.4. Conclusion
In summary, a hydrothermal technique was employed to synthesise six novel Co-MOFs. These Co-MOFs were then utilized as precursors together with melamine phosphate for mixed calcination, resulting in the graphene supported core–shell structure catalyst AIP-PMA following a straightforward one-step pyrolysis. It showed an overpotential of 320 mV and a Tafel slope of 78.9 mV dec−1 in 1 M KOH solution, which was better than that of commercial catalysts, and maintained good stability at a current density of 10 mA cm−2 for 10 h. The highly graphitized carbon as a substrate provided a good conductive material, and the large ECSA and specific surface area allowed AIP-PMA to have the most exposed active sites, which can be attributed to its unique and uniform topography. Finally, the DFT calculation showed that CoP@Co3O4 had a metallic state and thus had good electronic conductivity. The formation of the interface between CoP and Co3O4 reduced the energy barrier for the RDS, was more conducive to the desorption of O2, and accelerated the rate of OER. The results above demonstrated that the AIP-PMA had outstanding performance and can be mass-produced in industry with easy preparation methods. It also offered a novel concept for the design and use of MOF and carbon- and non-noble metal-based catalysts. In the further development of OER catalysts, it is necessary to optimize the structural design of MOFs, including the composition and coordination mode of the ligand, atomic spacing and arrangement mode, etc. Different structural differences will directly affect the properties of the MOFs themselves and the derived materials, showing a large difference in OER performance.Data availability
The data supporting this article have been included as part of the ESI.† Crystallographic data for Co-MOF-H, Co-MOF-CH3, Co-MOF-OH, Co-MOF-SO3, Co-MOF-NH2 and Co-MOF-NO2 have been deposited at the CCDC under 988387 and 2361269–2361273.Author contributions
Xian-Chen Meng: writing – original Draft; formal analysis; validation. Jian Luan: writing – original Draft; investigation; resources. Yi Liu: validation; visualization. Yu-Shu Sheng: software; visualization. Fu-Yu Guo: formal analysis; methodology. Peng Zheng: methodology; software. Wen-Long Duan: project administration; resources; writing – review & editing. Wen-Ze Li: project administration; conceptualization; writing – review & editing.Conflicts of interest
The authors declare no conflict of interest.Acknowledgements
This work was supported by the Science and Technology Department of Liaoning Province (2023JH2/101300231) and Key Project in Science & Technology of SYUCT (2023DB010).Notes and references
- J. A. Turner, Science, 2004, 305, 972–974 CrossRef CAS PubMed.
- P. P. Edwards, V. L. Kuznetsov, W. I. F. David and N. P. Brandon, Energy Policy, 2008, 36, 4356–4362 CrossRef.
- X. F. Lu, L. Yu and X. W. Lou, Sci. Adv., 2019, 5, eaav6009 CrossRef CAS PubMed.
- S. Wang, A. Lu and C. J. Zhong, Nano Convergence, 2021, 8, 4 CrossRef CAS PubMed.
- H. Song, S. Luo, H. Huang, B. Deng and J. Ye, ACS Energy Lett., 2022, 7, 1043–1065 CrossRef CAS.
- Y. Wang, D. Chen, J. Zhang, M. S. Balogun, P. Wang, Y. Tong and Y. Huang, Adv. Funct. Mater., 2022, 32, 2112738 CrossRef CAS.
- C. P. Grey and J. M. Tarascon, Nat. Mater., 2017, 16, 45–56 CrossRef PubMed.
- X. Zou and Y. Zhang, Chem. Soc. Rev., 2015, 44, 5148–5180 RSC.
- J. Chi and H. Yu, Chin. J. Catal., 2018, 39, 390–394 CrossRef CAS.
- S. Sharma and S. K. Ghoshal, Renewable Sustainable Energy Rev., 2015, 43, 1151–1158 CrossRef CAS.
- F. Gao, Y. Zhang, Z. Wu, H. You and Y. Du, Coord. Chem. Rev., 2021, 436, 213825 CrossRef CAS.
- Y. Lee, J. Suntivich, K. J. May, E. E. Perry and Y. Shao-Horn, J. Phys. Chem. Lett., 2012, 3, 399–404 CrossRef CAS PubMed.
- S. Cherevko, S. Geiger, O. Kasian, N. Kulyk, J. P. Grote, A. Savan, B. R. Shrestha, S. Merzlikin, B. Breitbath, A. Ludwig and K. J. J. Mayrhofer, Catal. Today, 2016, 262, 170–180 CrossRef CAS.
- N. Danilovic, R. Subbaraman, K. C. Chang, S. H. Chang, Y. Kang, J. Synder, A. P. Paulikas, D. Strmcnik, Y. T. Kim, D. Myers, V. R. Stamenkovic and N. M. Markovic, Angew. Chem., Int. Ed., 2014, 53, 14016–14021 CrossRef CAS PubMed.
- T. Reier, M. Oezaslan and P. Strasser, ACS Catal., 2012, 2, 1765–1772 CrossRef CAS.
- C. Kim, S. Lee, S. H. Kim, I. Kwon, J. Park, S. Kim, J. Lee, Y. S. Park and Y. Kim, Nanoscale Adv., 2021, 3, 6386–6394 RSC.
- K. Liu, P. Cao, W. Chen, C. I. Ezeh, Z. Chen, Y. Luo, Q. Liu, H. Zhao, Z. Rui, S. Gao, Z. Yin, X. Sun and X. Yu, Adv. Mater., 2022, 3, 1359–1400 RSC.
- X. Zhang, D. Kim, X. Guo, Y. Zhu and L. Y. S. Lee, Appl. Catal., B, 2021, 298, 120515 CrossRef CAS.
- M. A. Habib, R. Mandavkar, S. Burse, S. Lin, R. Kulkarni, C. S. Patil, J. H. Jeong and J. Lee, Mater. Today Energy, 2022, 26, 101021 CrossRef CAS.
- W. Lai, L. Ge, H. Yang, Y. Deng, H. Li, B. Ouyang, L. Xu and J. Bao, J. Mater. Chem. A, 2022, 10, 10525–10539 RSC.
- R. Mandavkar, M. A. Habib, S. Lin, R. Kulkarni, S. Burse and J. H. Jeong, Appl. Mater. Today, 2022, 29, 101579 CrossRef.
- R. Guo, X. Lai, J. Huang, X. Du, Y. Yan, Y. Sun, G. Zou and J. Xiong, ChemElectroChem, 2018, 5, 3822–3834 CrossRef CAS.
- Y. Han, Y. Chen, R. Fan, Z. Li and Z. Zou, EcoMat, 2021, 3, e12097 CrossRef CAS.
- H. Zhao and Z. Y. Yuan, ChemCatChem, 2020, 12, 3797–3810 CrossRef CAS.
- Y. Zhu, L. Zhang, X. Zhang, Z. Li, M. Zha, M. Li and G. Hu, Chem. Eng. J., 2021, 405, 127002 CrossRef CAS.
- Y. Yao, Z. Zhang and L. Jiao, Energy Environ. Mater., 2022, 5, 470–485 CrossRef CAS.
- S. Lin, M. A. Habib, R. Mandavkar, R. Kulkarni, S. Burse, Y. U. Chung, C. Liu, Z. Wang, S. Lin, J. H. Jeong and J. Lee, Adv. Sustainable Syst., 2022, 6, 2200213 CrossRef CAS.
- W. Niu, Z. Li, K. Marcus, L. Zhou, Y. Li, R. Ye, K. Liang and Y. Yang, Adv. Energy Mater., 2018, 8, 1701642 CrossRef.
- J. Fu, F. M. Hassan, C. Zhong, J. Lu, H. Liu, A. Yu and Z. Chen, Adv. Mater., 2017, 29, 1702526 CrossRef PubMed.
- L. An, Y. Li, M. Luo, J. Yin, Y. Q. Zhao, C. Xu, F. Cheng, Y. Yang, P. Xi and S. Guo, Adv. Funct. Mater., 2017, 27, 1703779 CrossRef.
- X. Han, X. Wu, C. Zhong, Y. Deng, N. Zhao and W. Hu, Nano Energy, 2017, 31, 541–550 CrossRef CAS.
- J. Wu, L. Hu, N. Wang, Y. Li, D. Zhao, L. Li, X. Peng, Z. Cui, L. J. Ma, Y. Tian and X. Wang, Appl. Catal., B, 2019, 254, 55–65 CrossRef CAS.
- S. Dou, L. Tao, J. Huo, S. Wang and L. Dai, Energy Environ. Sci., 2016, 9, 1320–1326 RSC.
- T. Meng, J. Qin, S. Wang, D. Zhao, B. Mao and M. Cao, J. Mater. Chem. A, 2017, 5, 7001–7014 RSC.
- J. Y. Wang, T. Ouyang, N. Li, T. Ma and Z. A. Liu, Sci. Bull., 2018, 63, 1130–1140 CrossRef CAS PubMed.
- J. Jiang, X. L. Zhou, H. G. Lv, H. Q. Yu and Y. Yu, Adv. Funct. Mater., 2023, 33, 2212160 CrossRef CAS.
- H. Li, M. Eddaoudi, M. O'Keeffe and O. M. Yaghi, Nature, 1999, 402, 276–279 CrossRef CAS.
- H. Gao, Y. Hu, Y. Xuan, J. Li, Y. Yang, R. V. Martinez, C. Li, J. Luo, M. Qi and G. J. Cheng, Science, 2014, 346, 1352–1356 CrossRef CAS PubMed.
- L. Chong, J. Wen, J. Kubal, F. G. Sen, J. Zou, J. Greeley, M. Chan, H. Barkholtz, W. Ding and D. J. Liu, Science, 2018, 362, 1276–1281 CrossRef CAS PubMed.
- X. Wang, L. Chai, J. Ding, L. Zhong, Y. Du, T. T. Li, Y. Hu and J. Qian, Nano Energy, 2019, 62, 745–753 CrossRef CAS.
- Y. Ma, Y. Ma, D. Bresser, Y. Ji, G. Geiger, U. Kaiser, C. Streb, A. Varzi and S. Passerini, ACS Nano, 2018, 12, 7220–77231 CrossRef CAS PubMed.
- K. Y. Zou, Y. C. Liu, Y. F. Jiang, C. Y. Yu, M. L. Yue and Z. X. Li, Inorg. Chem., 2017, 56, 6184–6196 CrossRef CAS PubMed.
- R. Wang, X. Y. Dong, J. Du, J. Y. Zhao and S. Q. Zang, Adv. Mater., 2018, 30, 1703711 CrossRef PubMed.
- L. Yang, X. Zeng, D. Wang and D. Cao, Energy Storage Mater., 2018, 12, 277–283 CrossRef.
- P. Pachfule, D. Shinde, M. Majumder and Q. Xu, Nat. Chem., 2016, 8, 718–724 CrossRef CAS PubMed.
- X. Wang, Z. Zhu, L. Chai, J. Ding, L. Zhong, A. Dong, T. T. Li, Y. Hu, J. Qian and S. Huang, J. Power Sources, 2019, 440, 227158 CrossRef CAS.
- H. Liu, J. Guan, S. Yang, Y. Yu, R. Shao, Z. Zhang, M. Dou, F. Wang and Q. Xu, Adv. Mater., 2020, 32, 2003649 CrossRef CAS PubMed.
- L. Costa, G. Camino and M. P. Luda di Cortemiglia, ACS Symp. Ser., 1990, 425, 211e38 CrossRef.
- Q. Xu, H. Pang, R. Q. Zou and Q. L. Zhu, Nano-MOFs and Their Composites and Derivatives, Science Press, Beijing, China, 2021 Search PubMed.
- X. Wang, Y. Du, L. Chai, J. Ding, L. Zhong, T. T. Miao, Y. Hu, J. Qian and S. Huang, Chem.–Eur. J., 2021, 27, 7704–7711 CrossRef CAS PubMed.
- X. Wang, Z. Ma, L. Chai, L. Xu, Z. Zhu, Y. Hu, J. Qian and S. Huang, Carbon, 2019, 141, 643–651 CrossRef CAS.
- W. W. Bao, J. Y. Liu, T. T. Ai, J. Han, J. G. Hou, W. H. Li, X. L. Wei, X. Y. Zou, Z. F. Deng and J. J. Zhang, Adv. Funct. Mater., 2024, 34, 2408364 CrossRef CAS.
- L. Wu, M. Ning, X. Xing, Y. Wang, F. Zhang, G. Gao, S. Song, D. Wang, C. Yuan, L. Yu, J. Bao, S. Chen and Z. Ren, Adv. Mater., 2023, 35, 2306097 CrossRef CAS PubMed.
- J. Kuang, B. Deng, Z. Jiang, Y. Wang and Z. J. Jiang, Adv. Mater., 2024, 36, 2306934 CrossRef CAS PubMed.
- H. Xue, T. Yang, Z. Zhang, Y. Zhang, Z. Geng and Y. He, Appl. Catal., B, 2023, 330, 122641 CrossRef CAS.
Footnote |
| † Electronic supplementary information (ESI) available. CCDC 9883872361269–2361273. For ESI and crystallographic data in CIF or other electronic format see DOI: https://doi.org/10.1039/d4ta07696f |
| This journal is © The Royal Society of Chemistry 2025 |

