 Open Access Article
Facet-dependent photocatalytic performance and electronic structure of single-crystalline anatase TiO2 particles revealed by X-ray photoelectron spectromicroscopy†
Wenxiong
Zhang
 *a,
Mustafa Al
Samarai
a,
Haochong
Zhao
a,
Daobin
Liu
 a,
Hisao
Kiuchi
a,
Ralph
Ugalino
a,
Hisao
Kiuchi
a,
Ralph
Ugalino
 b,
Sen
Li
 c,
Fangyi
Yao
d,
Qi
Feng
 d and
Yoshihisa
Harada
 *a
*a
aInstitute for Solid State Physics, The University of Tokyo, 5-1-5 Kashiwanoha, Kashiwa, Chiba 277-8581, Japan. E-mail: wenxiong_zhang@issp.u-tokyo.ac.jp; harada@issp.u-tokyo.ac.jp
bInstitute for Quantum Life Science, National Institutes for Quantum Science and Technology, 4-9-1 Anagawa, Inage-ku, Chiba-shi, Chiba 263-8555, Japan
cDepartment of Materials Science and Engineering, Southern University of Science and Technology, Shenzhen 518055, Guangdong, China
dDepartment of Advanced Materials Science, Faculty of Engineering and Design, Kagawa University, 2217-20 Hayashi-Cho, Takamatsu-Shi 761-0396, Japan
First published on 14th November 2024
Abstract
Facet-tailored single-crystalline anatase TiO2 particles with co-exposed (101)/(001) facets have been widely studied to enhance photocatalysis. Understanding the electronic structure of each facet is paramount for elucidating the charge separation mechanism and improving the photocatalytic performance. In this study, we used X-ray photoelectron spectromicroscopy with a spatial resolution of 100 nm to reveal the electronic structure of each facet of an anatase TiO2 particle. The analysis revealed smaller core-level binding energies (O 1s and Ti 2p) and lower valence band maximum (VBM) for the (001) relative to the (101) facet of anatase. We also identified an interface structure where the VBM lies between the two facets. Our findings displayed a continuous band bending along the entire interface (∼181 nm) of the (101)/(001) facets as the VBM difference (ΔE = 0.65 eV). The interface serves as a convenient and rapid pathway for the vectorial transfer of photogenerated electrons and holes to the (101) and (001) facets, respectively, thereby offering significant benefits for heterogeneous catalysis applications. This study provides a deeper understanding of facet-dependent properties in anatase, paving the way for the design of more efficient photocatalysts tailored for specific environmental and energy-related applications.
Introduction
In the photocatalysis process, radiation is used to initiate reactions on a semiconductor material's surface which has many implications in various environmental- and energy-related applications.1–4 Due to its high potential for solving environmental challenges such as CO2 conversion to valuable hydrocarbon fuels,2 the degradation of organic pollutants for wastewater treatment,3 and water splitting for hydrogen production,4 it has gained ever-increasing attention. The efficiency of these photocatalytic processes is largely determined by the electronic band structure of the photocatalyst.5 The band structure controls how efficiently the charge separations of the photogenerated electrons and holes occur, thus directly manipulating the photocatalytic activity. Within this context, different crystal facets of photocatalytic materials exhibit distinct electronic properties that influence the charge carrier dynamics.6–8 Therefore, a broader understanding about the facet-dependent band structure is crucial for enhancing the photocatalytic performance. Specifically, the crystal structure and coordination of atoms on various facets affect the surface energy, electron distribution, and reactivity, making the study of these facets essential for designing more efficient photocatalysts.Titanium dioxide (TiO2) has been widely used in many technological areas, including photocatalysis, solar cells, gas sensors, etc.9–11 Among its various polymorphs, anatase TiO2 with a band gap of 3.2 eV is considered a superior photocatalyst due to its relatively high electron mobility,12 a longer charge carrier lifetime,13 and a longer exciton diffusion length.14 However, its photocatalytic performance is limited by a high charge carrier recombination rate, reducing its catalytic efficiency and further industrial applications. To overcome this challenge, crystal facet engineering has emerged as a promising approach to tailor the morphology of TiO2 and other photocatalysts for an enhanced photocatalytic efficiency.14–19
Since the first successful synthesis report of anatase particles with a predominantly high surface energy (001) facet and the thermodynamically stable (101) facet by Yang et al.,20 there has been an ever-growing scientific interest in elucidating the impact of the (001) facet on the photocatalytic properties of anatase.21–28 From the related literature, it is well-established that the distinct surface crystalline facets of facet-tailored TiO2 single crystal particles determine surface-specific atomic structure, coordination, surface energy, band structures, and defects.16,22,29 Within this context, Han et al. have reported significantly improved photocatalytic properties in anatase with co-exposed (101) and (001) facets.30 While Tachikawa et al. explored facet-dependent photocatalysis in anatase with co-exposed (101) and (001) facets using single-molecule fluorescence imaging and kinetic analysis with redox-responsive fluorogenic dyes.31 A preferential reduction of fluorogenic dyes on the (101) facet was established, thus confirming the migration and trapping of photogenerated electrons onto the (101) facet.
In addition, a theoretical study by Yu et al. confirmed the existence of a surface heterojunction between the (101) and (001) facets due to energy band mismatch, which results in the accumulation of photogenerated electrons and holes on the (101) and (001) facets, respectively,8 and should exhibit distinct photocatalytic properties. Kashiwaya et al. reported that band bending should occur between the (101) and (001) facets, possibly due to the difference in their Fermi levels, as determined through the VB measurements of their thin film samples.32 While these reports provide valuable insights, the specific interactions between the two facets or the potential impact of the interface that could form between them, is not fully understood.
Zhang et al. performed density functional theory (DFT) calculation using a refined co-exposed mode, which demonstrated a higher VBM difference by considering the interaction between the (101) and (001) facets of anatase TiO2.25 However, there is still a lack of detailed experimental evidence regarding the electronic structure of each facet of a single-crystal anatase TiO2 particle. Furthermore, less attention has been paid to the interface between these facets, which could significantly influence the band alignment and the dynamics of photogenerated charge carrier transfer, thereby affecting the overall photocatalytic properties.33
To comprehensively understand the photogenerated charge-separation mechanism, it is essential to elucidate the electronic structure of each facet and the interface between them, as well as correlate them with facet-dependent photocatalytic behavior. This requires an experimental technique with a spatial resolution of 1 μm or better to analyze individual facets within a single particle. X-ray photoelectron spectromicroscopy (XPS) is recognized as a powerful approach for elucidating the facet-dependent electronic structure of micron-sized single-crystalline metal oxide particles.34–36 In this study, we aim to unravel and compare the electronic structure of each surface facet and their interface of a single-crystalline anatase TiO2 particle, as well as understand the mechanisms of facet-mediated charge carrier separation in heterogeneous catalysis.
Results and discussion
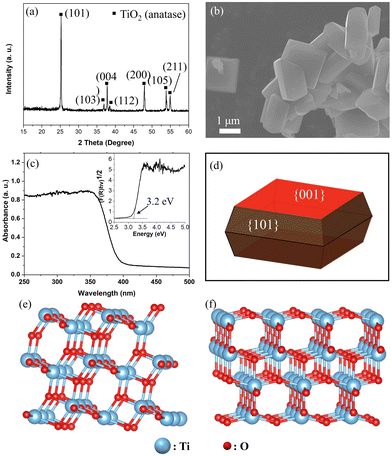
Fig. 1a and b show the X-ray diffraction (XRD) pattern and scanning electron microscopy (SEM) image of the anatase TiO2 sample, respectively. The XRD pattern indicates the formation of a pure anatase TiO2 phase. Moreover, based on the wide XPS spectra shown in Fig. S1 (ESI†), only Ti and O were detected except for the signals from the In sheet for holding the sample and adventitious carbon on it, suggesting the pure phase of anatase TiO2 without contamination. The anatase TiO2 particle exhibits a truncated octahedral bipyramid morphology, which consists of eight (101) facets on the sides and two (001) facets on the top and bottom (Fig. 1b, d). The corresponding facets of the single-crystalline anatase particle were confirmed as the (001) and (101) facets by the SHAPE simulation (Fig. 1d). The average particle size of the anatase TiO2 single crystal was on the order of approximately 3 μm. Considering the spatial resolution of the 3DnanoESCA (<100 nm), each facet of the TiO2 particle can be well distinguished after X-ray mapping, allowing for pinpoint XPS measurements on each characterized facet. Fig. 1c shows the UV-Vis absorption spectrum of the anatase TiO2 sample, indicating a band gap (Eg) of 3.2 eV. Additionally, the specific surface atomic structure for the (101) and (001) facets was simulated using VESTA, as shown in Fig. 1e and f, respectively.As estimated, the anatase (001) facet mainly exposes uncoordinated atoms, namely, 5-fold Ti (Ti5c) and 2-fold O (O2c) atoms (Fig. 1e). In contrast, the anatase (101) facet exposes 6-fold coordinated Ti (Ti6c), along with Ti5c, O2c, and O3c (Fig. 1f). The uncoordinated atoms could act as active sites for photocatalysis, which contributes to higher surface energy. Thus, the (001) facet (0.90 J m−2) shows a higher surface energy than that of the (101) facet (0.44 J m−2).37 These surface energies were calculated using first-principles density functional theory (DFT) methods, applying both the Perdew–Burke–Ernzerhof (PBE) and local density approximation (LDA) exchange–correlation functionals.37,38 Surface energy was determined by calculating the difference between the total energy of a relaxed slab and the energy of an equal number of bulk TiO2 units, divided by the exposed surface area. Furthermore, we can see a geometry difference between the two facets, whereby a larger Ti–O–Ti bond angle of the (001) facet (146°) is found vs. the (101) facet (102°).39
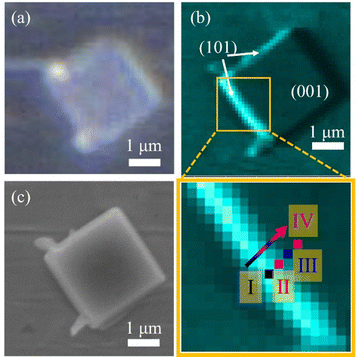
Fig. 2b shows the O 1s (450–470 eV for kinetic energy) photoelectron intensity mapping of the anatase TiO2 particle, which was selected based on the 2D optical microscope image (Fig. 2a). The O 1s photoelectron intensity mapping of the anatase particle was obtained by using 3DnanoESCA with an incident photon energy of 1000 eV. The spatial resolution of the mapping is comparable with the SEM image (Fig. 2c), which was taken after the 3DnanoESCA measurement. Based on the SEM images, the lateral dimensions of the anatase TiO2 were found at 2.4 μm for the (001) facet vs. 0.4 μm for the (101) facet. The thickness of the particle was calculated to be approximately 740 nm, based on the angle between the (101) and (001) facets, which is about 68.3°.20 The photoelectron intensity is higher on the left side of the (101) facet than on the right due to the geometrical arrangement, which made the beam spot on the left (101) facet more visible from the photoelectron detection direction.34–36
Fig. 3a and b show the pinpoint O 1s and Ti 2p XPS spectra, respectively, obtained from the yellow-squared region in Fig. 2b. The consecutive 4 spots (100 × 100 nm2 each) indicate the measured area that crosses the (101) and (001) facets of the single-crystalline anatase particle, including the interface between them. In addition, the localized amplification of the peak positions is presented in Fig. S2 (ESI†). The binding energies for the O 1s and Ti 2p3/2 core levels obtained from each spot are listed in Table 1. It is noted that both the O 1s and Ti 2p3/2 peaks of the anatase TiO2 are continuously shifted to lower binding energies on moving from the (101) facet to the (001) facet (Table 1).
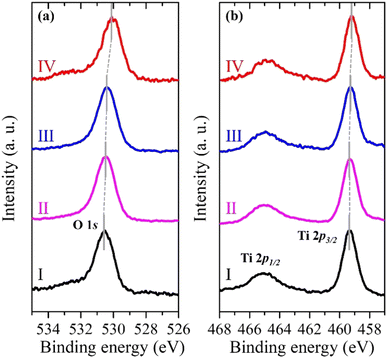 | ||
| Fig. 3 Pinpoint (a) O 1s and (b) Ti 2p XPS spectra of the single-crystalline anatase TiO2 particle from 4 consecutive spots (I, II, III, and IV) shown in Fig. 2b. | ||
| Spot | O 1s (eV) | Ti 2p3/2 (eV) | VB width (eV) | E VBM (eV) |
|---|---|---|---|---|
| I | 530.55 | 459.35 | 6.5 | 2.95 |
| II | 530.45 | 459.30 | 6.8 | 2.60 |
| III | 530.35 | 459.25 | 7.0 | 2.50 |
| IV | 530.05 | 459.20 | 7.3 | 2.30 |
Fig. 4a shows the VB spectra obtained from the same 4 spots, as shown in Fig. 2b. They exhibit typical VB profiles of the double-layered TiO2 structure, mainly showing O 2p π and σ bonding states at binding energies of 5 and 8 eV, respectively.32 The VBM was determined by applying a linear extrapolation to the high-energy edge of the VB.40 The VBM exhibits the same tendency as the O 1s and Ti 2p XPS spectra, i.e. a smaller binding energy of the VBM for the (001) facet compared to the (101) facet. The VBM positions (EVBM) relative to the Fermi level (EF) and VB width are also summarized in Table 1.
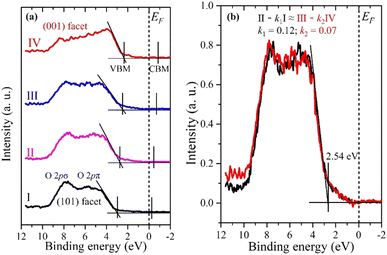 | ||
| Fig. 4 (a) Valence XPS spectra of anatase TiO2 particles from 4 consecutive spots (I, II, III, and IV) shown in Fig. 2b. The conduction band minimum (CBM) is only estimated from the band gap Eg = 3.2 eV. (b) Valence XPS spectra of the interface between two facets. k1 = 0.12, k2 = 0.07. Area of interface = (1 − k1) × 100 nm + (1 − k2) × 100 nm = 88 nm + 93 nm = 181 nm. | ||
The VB widths for the (101) and (001) facets are 6.5 eV and 7.3 eV, respectively. The larger bandwidth for the (001) facet compared to the (101) facet is attributed to the presence of density of states (DOS) at the upper edge of the O 2p VB near the EF. The DFT calculation demonstrated that the DOS is formed by the surface O2c of the (001) facet, which is responsible for its activity.41 Moreover, we can see the intensity difference of the O 2p π and σ bonding states between the (101) and (001) facets, which could be ascribed to their different coordination environment and the Ti–O–Ti bond angle as explained in Fig. 1e and f. The larger Ti–O–Ti bond angle on the (001) facet leads to the destabilization of the O 2p states on the surface, making them highly reactive.41,42 Consistent VB spectra were observed at different spots on both the (101) and (001) facets (see Fig. S3, ESI†). This confirms that the VB spectra obtained from spots I and IV are exactly representative of the (101) and (001) facets of anatase, respectively.
The positions II and III lie near the interface between the two facets. If their VB spectra can be represented by a simple sum of the (001) and (101) facets (VB spectra IV and I, respectively), it would imply that there are no interface-specific electronic states. However, the VB spectrum of II in particular cannot be reproduced by the sum of the VB spectra at positions I and IV (see Fig. S4, ESI†). Therefore, there should be an independent VB spectrum corresponding to the interface. In fact, by subtracting contributions from the pure (101) and (001) facets from the valence spectra II and III, respectively, similar VB spectra can be obtained (Fig. 4b), suggesting that this is an independent VB spectrum corresponding to the interface. The interface VB spectrum has a VBM of 2.54 eV and a VB width of 6.9 eV, which lies between the (101) and (001) facets, indicating a continuous electronic structure transition from the (101) facet to the (001) facet. The interface areas for both II and III were calculated to be approximately 88 nm and 93 nm, respectively, by fitting with the constraint: II – k1I ≈ III – k2IV (see ESI† for details). Previous research also supports the formation of an interface between the (101) and (001) facets of the single-crystalline anatase.25 The interface could be a convenient channel for a rapid transfer of photogenerated charge carriers, which is beneficial for heterogeneous catalysis applications. The difference in the VBM (ΔEVBM) between the (101) and (001) facets was found to be 0.65 eV (Table 1). According to theoretical studies by Zhang et al.25 the VBM difference between the (101) and (001) facets was calculated to be 0.32 eV by using the isolated slab mode, which is very similar or even higher compared to VBM differences by using the thin films obtained from different methods.32,43 On the other hand, the VBM difference of the (001) and (101) facets of anatase was calculated to be 0.61 eV when the interactions between facets by the co-exposed mode are considered,25 indicating that the direct interactions between the facets significantly influence their electronic properties. Meanwhile, the DFT calculation result is in good agreement with our experimental results.25 This distinction highlights the difference between the electronic structure of a crystal with co-exposed facets compared to thin films where an individual facet is exposed.
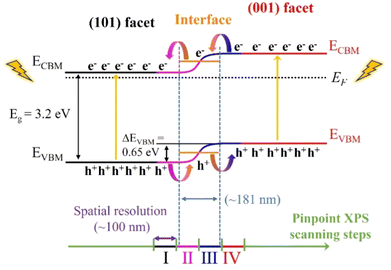
Assuming the band gap (Eg) of 3.2 eV for both facets, a charge separation scheme for the anatase particle with co-exposed (101) and (001) facets is presented in Fig. 5. The band structures (VBM and CBM) for both the (101) and (001) facets are aligned by the difference in the VBM (ΔEVBM = 0.65 eV) and Eg of 3.2 eV. In addition, an epitaxial interface area with a thickness of ∼181 nm is formed between the (001) and (101) facets. Also, the energy level of the interface resides at the level between two facets.
As a result, a continuous band bending along the epitaxial interface of the two facets forms, which could provide convenient channels for charge carrier separation and rapid transfer. The large VBM difference could improve the dynamics for charge separation, i.e. photogenerated electrons and holes preferentially accumulate at the (101) and (001) facets through the epitaxial interfacial region, respectively, which could then function as effective reaction sites for reduction and oxidation reactions, accordingly. The separated electrons and holes at the (101) and (001) facets could effectively inhibit their recombination during the photocatalysis process, increasing the yield and lifetime of charge carriers on the anatase TiO2 single crystals, thereby enhancing the photocatalysis performance. In terms of the individual facets, the lower VBM of the (001) facet, which is closer to the EF, makes it easier to lose electrons than that of the (101) facet, implying greater reactivity during photocatalysis. Zhou et al. compared the photocatalytic dye degradation performance of anatase particles with different exposed facets, finding that the (001) facets exhibited higher photocatalytic activity than the (101) facets,39 consistent with our valence band structure analysis. Similarly, Wang et al. demonstrated that anatase with co-exposed (001) and (101) facets showed significantly enhanced photocatalytic performance compared to single-faceted structures.8 In their study on photocatalytic CO2 reduction, particles dominated by the (001) facet demonstrated a relatively higher photocatalytic activity compared to samples whereby the (101) facet is dominating. Notably, particles with a (101) to (001) facet exposure ratio of 45![[thin space (1/6-em)]](https://www.rsc.org/images/entities/char_2009.gif) :
:![[thin space (1/6-em)]](https://www.rsc.org/images/entities/char_2009.gif) 55 demonstrated the best performance, as electron–hole pairs migrated efficiently to the (101) and (001) facets, respectively. While the (001) facet is more reactive, reducing the (101) facet area hinders electron transfer and increases the recombination rate of photogenerated carriers. Thus, increasing the proportion of (001) facets does not exclusively enhance photocatalytic performance. Instead, the interaction between the (001) and (101) facets, particularly the formation of an interface with continuous band bending, facilitates electron and hole transfer during excitation, thus resulting in an improved photocatalytic efficiency.
55 demonstrated the best performance, as electron–hole pairs migrated efficiently to the (101) and (001) facets, respectively. While the (001) facet is more reactive, reducing the (101) facet area hinders electron transfer and increases the recombination rate of photogenerated carriers. Thus, increasing the proportion of (001) facets does not exclusively enhance photocatalytic performance. Instead, the interaction between the (001) and (101) facets, particularly the formation of an interface with continuous band bending, facilitates electron and hole transfer during excitation, thus resulting in an improved photocatalytic efficiency.
Conclusions
In summary, the facet-dependent electronic structure of the single-crystalline anatase TiO2 particle, specifically the (101) and (001) facets, was elucidated through X-ray photoelectron spectromicroscopy using 3DnanoESCA for the first time owing to the remarkable spatial resolution of 100 nm. The binding energies of the O 1s and Ti 2p core levels, as well as the VB, exhibited a consistent decrease when transitioning from the (101) to the (001) facets. Notably, the (001) facet demonstrated a 0.65 eV lower VBM compared to the (101) facet. The energy level of the interface lies between two facets. Therefore, a continuous band bending spanning approximately ∼181 nm along the epitaxial interface is formed. As a result, photogenerated electrons tend to accumulate on the (101) facet, while holes accumulate on the (001) facet through the interface between them, leading to enhanced photocatalytic activity. The employment of synchrotron soft X-ray spectromicroscopy enables effective morphology control strategies to enhance the photocatalytic performance of TiO2 and other metal oxides. These findings bear significant implications for the development of robust facet-engineered photocatalysts applicable across diverse energy and environmental contexts.Experimental
Synthesis of single-crystalline anatase
The anatase TiO2 powder sample was synthesized according to the hydrothermal synthesis procedure.21 First, 30% titanium sulfate solution (Wako) was dissolved in 0.2 M hydrofluoric acid (HF) solution and the mixture was heated in a Teflon-lined stainless-steel autoclave at 180 °C for 12 h. The obtained sample was separated by centrifugation for 15 min at 8000 rpm, repeatedly washed with distilled water until pH = 7, and then dried at 100 °C for 12 h in the air. To remove surface fluorine species, the powder samples were heated at 600 °C for 2 h in the air.Shape simulation of anatase
The facet of the anatase TiO2 particle was identified by SHAPE simulation, a program designed to depict the external morphology (facets) of crystals and quasi-crystals.44 Details such as crystal system, lattice constants, symmetry, and d-spacings for each facet of the anatase TiO2 particle are necessary inputs for the simulation process.Characterizations
The crystal structure of the powder sample was studied by X-ray diffractometer (XRD) (Shimadzu, XRD-6100) with Cu Kα (λ = 0.15418 nm) radiation. The particle size and morphology of the samples were depicted using a scanning electron microscope (SEM) (JEOL, JCM-6000Plus). The band gap (Eg) of the sample was measured by UV-Vis absorption spectroscopy (Shimadzu, Solidspec-3700UV-Vis-NIR spectrophotometer).X-ray photoelectron spectroscopy (XPS) imaging was performed using a 3DnanoESCA system, which provides a spatial resolution of 100 nm and an energy resolution of 0.1 eV, enabling element-selective chemical analysis. The samples for XPS measurements were prepared by pressing the TiO2 powder on an indium sheet, which was then mounted on a sample holder using copper conductive tape36 and transferred to the main chamber of 3DnanoESCA. In the 3DnanoESCA station, a synchrotron radiation soft X-ray was focused by a Fresnel zone plate and an order-sorting pinhole aperture of 80 μm (see Fig. S5a, ESI†).45 Photoelectrons were detected by a modified angle-resolved photoelectron spectrometer (VG Scienta R3000-EWAL) with a pass energy of 200 eV.36 This setup allows for 3D spectral imaging with an in-plane spatial resolution better than 100 nm. Then, pinpoint XPS is conducted at selected spots on the facets of individual particles (see Fig. S5b, ESI†). A clean surface of an Au (4f) sample was used for energy calibration and the background signal was subtracted from the XPS spectra using a Shirley-type function.
Author contributions
W. Z., M. S., and Y. H. conceived, designed, and coordinated the study. F. Y. prepared the materials of interest. W. Z., M. S., and H. Z. conducted the 3DnanoESCA measurement. W. Z., M. S., D. L., R. U., H. K., F. Y., S. L., and Y. H. analyzed the data from the 3DnanoESCA measurement. All authors discussed the results and wrote the manuscript.Data availability
The data supporting this article have been included as part of the ESI.†Conflicts of interest
We declare no conflicts of interest.Acknowledgements
This work was carried out by joint research by the Synchrotron Radiation Research Organization and the Institute for Solid State Physics, The University of Tokyo (Proposal Numbers 2022A7450 and 2022A7452).References
- C. Byrne, G. Subramanian and S. C. Pillai, J. Environ. Chem. Eng., 2018, 6, 3531–3555 CrossRef CAS.
- S. Kreft, D. Wei, H. Junge and M. Beller, EnergyChem, 2020, 2, 100044 CrossRef.
- D. Chen, Y. Cheng, N. Zhou, P. Chen, Y. Wang, K. Li, S. Huo, P. Cheng, P. Peng and R. Zhang, J. Cleaner Prod., 2020, 268, 121725 CrossRef CAS.
- S. Nishioka, F. E. Osterloh, X. Wang, T. E. Mallouk and K. Maeda, Nat. Rev. Methods Primers, 2023, 3, 42 CrossRef CAS.
- E. A. Abdullah, Eur. J. Chem., 2019, 10, 82–94 CrossRef CAS.
- R. Chen, S. Pang, H. An, J. Zhu, S. Ye, Y. Gao, F. Fan and C. Li, Nat. Energy, 2018, 3, 655–663 CrossRef CAS.
- R. Li, F. Zhang, D. Wang, J. Yang, M. Li, J. Zhu, X. Zhou, H. Han and C. Li, Nat. Commun., 2013, 4, 1432 CrossRef.
- J. Yu, J. Low, W. Xiao, P. Zhou and M. Jaroniec, J. Am. Chem. Soc., 2014, 136, 8839–8842 CrossRef CAS.
- S. Peiris, H. B. de Silva, K. N. Ranasinghe, S. V. Bandara and I. R. Perera, J. Chin. Chem. Soc., 2021, 68, 738–769 CrossRef CAS.
- P. Roy, D. Kim, K. Lee, E. Spiecker and P. Schmuki, Nanoscale, 2010, 2, 45–59 RSC.
- E. A. N. Simonetti, T. C. de Oliveira, Á. E. do Carmo Machado, A. A. C. Silva, A. S. dos Santos and L. de Simone Cividanes, Ceram. Int., 2021, 47, 17844–17876 CrossRef.
- H. Tang, K. Prasad, R. Sanjines, P. Schmid and F. Levy, J. Appl. Phys., 1994, 75, 2042–2047 CrossRef CAS.
- M. Xu, Y. Gao, E. M. Moreno, M. Kunst, M. Muhler, Y. Wang, H. Idriss and C. Wöll, Phys. Rev. Lett., 2011, 106, 138302 CrossRef PubMed.
- T. Luttrell, S. Halpegamage, J. Tao, A. Kramer, E. Sutter and M. Batzill, Sci, Rep., 2014, 4, 4043 CrossRef PubMed.
- G. Liu, J. C. Yu, G. Q. Lu and H.-M. Cheng, Chem. Commun., 2011, 47, 6763–6783 RSC.
- G. Liu, H. G. Yang, J. Pan, Y. Q. Yang, G. Q. Lu and H.-M. Cheng, Chem. Rev., 2014, 114, 9559–9612 CrossRef CAS.
- X.-M. Cheng, J. Zhao and W.-Y. Sun, EnergyChem, 2022, 4, 100084 CrossRef CAS.
- X.-Y. Zhang, P. Wang, X.-Y. Lu, Y. Zhang and W.-Y. Sun, Chem. Eng. J., 2023, 476, 146560 CrossRef CAS.
- X.-Y. Lu, Q. Zhou, X.-Y. Zhang, Y. Zhang, F. Gong and W.-Y. Sun, J. Mater. Chem. A, 2024, 12, 19414–19421 RSC.
- H. G. Yang, C. H. Sun, S. Z. Qiao, J. Zou, G. Liu, S. C. Smith, H. M. Cheng and G. Q. Lu, Nature, 2008, 453, 638–641 CrossRef CAS.
- G. Liu, C. Sun, H. G. Yang, S. C. Smith, L. Wang, G. Q. M. Lu and H.-M. Cheng, Chem. Commun., 2010, 46, 755–757 RSC.
- S. Liu, J. Yu and M. Jaroniec, Chem. Mater., 2011, 23, 4085–4093 CrossRef CAS.
- J. Pan, G. Liu, G. Q. Lu and H. M. Cheng, Angew. Chem., Int. Ed., 2011, 50, 2133–2137 CrossRef CAS PubMed.
- Z. Zheng, B. Huang, J. Lu, X. Qin, X. Zhang and Y. Dai, Chem. – Eur. J., 2011, 17, 15032–15038 CrossRef CAS.
- A.-Y. Zhang, W.-Y. Wang, J.-J. Chen, C. Liu, Q.-X. Li, X. Zhang, W.-W. Li, Y. Si and H.-Q. Yu, Energy Environ. Sci., 2018, 11, 1444–1448 RSC.
- J. Geiger, M. Sprik and M. M. May, J. Chem. Phys., 2020, 152, 194706 CrossRef CAS.
- Y. Gao, X. Zhang, C. Ban, R. Feng, J. Hou, J. Meng, G. Yang, C. Gao, L. Xia, P. Ma, K. Wang and X. Qu, Mater. Today Energy, 2024, 40, 101483 CrossRef CAS.
- S. Selcuk and A. Selloni, Nat. Mater., 2016, 15, 1107–1112 CrossRef CAS PubMed.
- N. Tian, Z.-Y. Zhou, S.-G. Sun, Y. Ding and Z. L. Wang, Science, 2007, 316, 732–735 CrossRef CAS PubMed.
- X. Han, Q. Kuang, M. Jin, Z. Xie and L. Zheng, J. Am. Chem. Soc., 2009, 131, 3152–3153 CrossRef CAS PubMed.
- T. Tachikawa, S. Yamashita and T. Majima, J. Am. Chem. Soc., 2011, 133, 7197–7204 CrossRef CAS PubMed.
- S. Kashiwaya, T. Toupance, A. Klein and W. Jaegermann, Adv. Energy Mater., 2018, 8, 1802195 CrossRef.
- Y. Wang, Y. Shi, C. Zhao, Q. Zheng and J. Zhao, Phys. Rev. B, 2019, 99, 165309 CrossRef CAS.
- K. Akada, T. Sudayama, D. Asakura, H. Kitaura, N. Nagamura, K. Horiba, M. Oshima, E. Hosono and Y. Harada, Sci. Rep., 2019, 9, 1–7 CrossRef CAS.
- K. Akada, T. Sudayama, D. Asakura, H. Kitaura, N. Nagamura, K. Horiba, M. Oshima, E. Hosono and Y. Harada, J. Electron Spectrosc. Relat. Phenom., 2019, 233, 64–68 CrossRef CAS.
- W. Zhang, E. Hosono, D. Asakura, S. Tanaka, M. Kobayashi, N. Nagamura, M. Oshima, J. Miyawaki, H. Kiuchi and Y. Harada, CrystEngComm, 2023, 25, 183–188 RSC.
- M. Lazzeri, A. Vittadini and A. Selloni, Phys. Rev. B: Condens. Matter Mater. Phys., 2001, 63, 155409 CrossRef.
- M. Lazzeri, A. Vittadini and A. Selloni, Phys. Rev. B: Condens. Matter Mater. Phys., 2002, 65, 119901 CrossRef.
- L. Ye, J. Mao, T. Peng, L. Zan and Y. Zhang, Phys. Chem. Chem. Phys., 2014, 16, 15675–15680 RSC.
- S. A. Chambers, T. Droubay, T. C. Kaspar and M. Gutowski, J. Vac. Sci. Technol., B, 2004, 22, 2205–2215 CrossRef CAS.
- X.-Q. Gong and A. Selloni, J. Phys. Chem. B, 2005, 109, 19560–19562 CrossRef CAS PubMed.
- A. Selloni, Nat. Mater., 2008, 7, 613–615 CrossRef CAS PubMed.
- A. Sandell, B. Sanyal, L. E. Walle, J. H. Richter, S. Plogmaker, P. G. Karlsson, A. Borg and P. Uvdal, Phys. Rev. B: Condens. Matter Mater. Phys., 2008, 78, 075113 CrossRef.
- SHAPE, V7.4, 1987, https://www.shapesoftware.com.
- K. Horiba, Y. Nakamura, N. Nagamura, S. Toyoda, H. Kumigashira, M. Oshima, K. Amemiya, Y. Senba and H. Ohashi, Rev. Sci. Instrum., 2011, 82, 113701 CrossRef CAS.
Footnote |
| † Electronic supplementary information (ESI) available. See DOI: https://doi.org/10.1039/d4tc03100h |
| This journal is © The Royal Society of Chemistry 2025 |

