
Ternary afterglow and dynamic anti-counterfeiting applications of self-activated zinc germanate†
Tianyu
Hu
 ,
Jie
Yu
,
Qiqi
Zeng
,
Cong
Zhang
,
Yuanjie
Teng
,
Kang
Shao
and
Zaifa
Pan
*
,
Jie
Yu
,
Qiqi
Zeng
,
Cong
Zhang
,
Yuanjie
Teng
,
Kang
Shao
and
Zaifa
Pan
*
College of Chemical Engineering, Zhejiang University of Technology, Hangzhou 310014, China. E-mail: panzaifa@zjut.edu.cn
First published on 25th October 2024
Abstract
Up to now, there is still a lack of understanding of luminescence and afterglow in connection with native defects in self-activated zinc germanate (Zn2GeO4, abbreviated as ZGO). In this paper, a series of zinc–germanate (Zn/Ge) samples with various ratios were prepared via a high temperature solid-state method under different sintering atmospheres to analyze their self-activated luminescence characteristics. All ZGO samples exhibited ternary persistent luminescence with blue (430 nm), green (530 nm), and near-infrared (NIR, 800 nm) emissions, each with different decay rates, and a NIR afterglow with higher intensity than green emission was observed for the first time in undoped ZGO materials. By studying the effects of different synthesis conditions, native luminescence linked with ternary persistent luminescence bands was discussed; consequently, a reasonable afterglow mechanism was proposed for the self-activated system. Furthermore, aliovalent Al3+-doped self-activated ZGO (abbreviated as ZAGO) showed better luminescence and afterglow properties, with yellow (632 nm) light emission enhanced by 10 times and green (530 nm) light afterglow increased by 18.5 times compared with ZGO. Finally, taking advantage of the unique yellow light and enhanced green afterglow, dynamic anti-counterfeiting applications were achieved.
1. Introduction
Energy storage and afterglow effects in persistent luminescence materials have been widely explored during the past several decades.1–8 Zinc germanate (Zn2GeO4, abbreviated as ZGO), with a wide band gap of about 4.68 eV,9,10 has been employed as fascinating persistent luminescence materials for biomedical, optical, sensing, electronic applications, and so on.11,12 In particular, ZGO doped with rare earth ions or transition metal ions has been widely studied owing to its excellent luminescence properties.13–16 Many researchers have concluded that activator-doped ZGO can effectively extend the duration of luminescence. Wan et al.17 reported an enhanced persistent luminescence in ZGO:Mn2+, Pt3+ with a green afterglow for three hours. Srivastava et al.18 further optimized the dopant Mn2+ concentration to 2%, set the pH value of the reaction medium to pH = 10.5, and adjusted the precursor zinc–germanium (Zn/Ge) molar ratio to 1/2 in Mn2+-based ZGO to achieve excellent afterglow. He et al.19 reported that ZGO:Eu3+ nanomaterials with multicolor luminescence can be used as white light-emitting diodes. Bai et al.20 found that the emission color can be tuned from bluish-white to green when Cr3+ is doped with ZGO. Zhang et al.21 synthesized ZGO:Bi3+ with bluish-green emission light under 300 nm excitation and weak persistent luminescence after irradiation with 254 nm ultraviolet (UV) light for 3 min.However, activator-doping has its shortcomings, especially for rare earth ions, whose limited supply and high cost restrict mass production and industrial applications.22,23 Therefore, self-activated ZGO materials have received increasing attention in recent years. Since both Zn and Ge atoms have a tetrahedral crystal structure with slight distortion,24 there are many native defects in pure ZGO, resulting in self-activated luminescence without the introduction of rare earth or transition group elements as emitting ions.25 There have been limited reports available on self-activated ZGO materials. Shang et al.26 utilized a hydrothermal method for synthesizing ZGO submicrorods which exhibited a self-activated blue emission. Liu et al.27 prepared ZGO with bluish-white light by a solid-phase method, and speculated that the bluish-white emission arose from the recombination between native defects of the donors, oxygen vacancies (VO) and zinc interstitials (Zni), and the acceptors, Zn vacancies (VZn) and ionized germanium vacancies (VGe). Dolado et al.28 and Wu et al.29 further proved the presence of Znivia studying UV emission from ZGO microwires and ZGO nanorods, respectively. Although the study of self-activated ZGO has progressed, the luminescence process and afterglow phenomenon during the self-activation process have not been fully clarified. Thus, it is necessary to perform a comprehensive study of ZGO and provide a reasonable interpretation of its native defect related luminescence mechanism. Furthermore, by aliovalent substitution of lattice ions, positively and negatively charged defects can be created as electron and hole traps that would improve emission intensity and afterglow duration.1
Herein, we successfully synthesized ZGO series samples (with and without dopants) to regulate the native defects. Systematic investigations were performed using X-ray diffraction (XRD), diffuse reflectance spectroscopy (DRS), photoluminescence (PL) spectroscopy, thermoluminescence (TL) spectroscopy and afterglow decay curves to evaluate the influence of native defects on ZGO's properties. An afterglow mechanism based on the recombination of multiple luminescence centers was thus proposed to explain ternary persistent luminescence in connection with native defects. Furthermore, the afterglow performance was enhanced considerably via an aliovalent substitution strategy. Finally, efficient applications in dynamic anti-counterfeiting encryption were designed with a Tai Chi pattern and a digital pattern taking advantage of the fluorescence and afterglow performance of ZGO and ZAGO.
2. Materials and methods
2.1. Synthesis of zinc germanate phosphors
All ZGO phosphors were synthesized by high-temperature solid-state reactions. Highly purified ZnO (99.99%, Aladdin) and GeO2 (99.99%, Cinor) were weighed according to the designed stoichiometric ratio of the formula (Table S1, ESI†) and ground in an agate mortar. The precursors were put into a corundum crucible (10 mL), and then placed in a high-temperature furnace at a heating rate of 10 °C min−1 until 1200 °C for 8 hours. The entire reaction was carried out under a certain sintering atmosphere, such as air, nitrogen (N2), and carbon monoxide (CO). After cooling to room temperature, the phosphors were ground homogenously to achieve fine powders, namely, a series of ZGO materials with different host compositions under different atmospheres. The powders were stored in a light-proof desiccator for the next step of testing and characterization.2.2. Synthesis of Al3+-doped zinc germanate phosphors
A series of ZAGO materials were prepared using a high-temperature solid-phase method. Raw materials of ZnO, GeO2, and Al2O3 were accurately weighed based on the stoichiometric ratios, in which the chemical composition is shown in Table S2 (ESI†). The weighed samples were put into an agate mortar and ground thoroughly, and then transferred into a corundum crucible and calcined at high temperature of 1400 °C for 8 hours. After cooling to room temperature, the phosphors were ground, and finally the prepared ZAGO series samples were obtained.2.3. Characterization
The crystalline phases and structures were characterized using an X'pert PRO powder diffractometer (PANlytical, Netherlands) at an operating voltage of 40 kV and a current of 40 mA in the 2θ range from 10° to 80° at a scanning step of 0.0167°. DRS were obtained with a UV-2700 ultraviolet-visible (UV-vis) spectrometer (SHMADZU, Japan). The scanning wavelength range was set as 200–800 nm and BaSO4 powder was used as a standard reference. Steady-state PL excitation and emission spectra, time-resolved PL emission spectra, and persistent luminescence spectra were recorded with a Fluoromax-4P fluorescence spectrometer (HORIBA, Jobin Yvon France). For afterglow decay measurements, the samples were tested in the kinetics mode of the fluorescence spectrometer. After irradiating with a xenon lamp for 5 minutes, the afterglow intensity was recorded immediately for 15 minutes. For TL measurements, samples were irradiated with a xenon lamp for 20 minutes in advance, and then heated from 30 to 270 °C at 20 °C min−1. All luminescence images were taken using a Canon R6 with the lens of RF 24–105 mm USM.3. Results and discussion
3.1. Morphology and structure
In order to investigate the crystal phase and structure of ZGO with different host compositions under air and N2 conditions, XRD patterns were measured. As shown in Fig. 1a and b, the diffraction peaks of all samples are sharp and narrow, which shows that the synthesized phosphors have high crystallinity. The main phase of all ZGO matches with the standard diffraction patterns of Zn2GeO4 (PDF#11-0687), indicating the successful formation of ZGO. The crystal structure of ZGO comprises corner-shared ZnO4 and GeO4 tetrahedral units, in which Zn has two different crystallographic positions as shown in Fig. S1 (ESI†). However, it is worth noting that compared with ZnO (PDF#36-1451), diffraction peaks of ZnO impurities appear in Zn2GeO4 under an air atmosphere and Zn2Ge0.9O4 under both air and N2 atmospheres. The impurity phase has emerged because ZnO has not reacted completely. Since ZnO has a higher boiling point (1949 °C) than GeO2 (1200 °C),30 the segregation coefficient of GeO2 is greater, and thus GeO2 is easier to volatilize when reacting at a high temperature of 1200 °C, leading to defect generation such as VGe and VO. Therefore, the low proportion of Zn/Ge promotes the achievement of pure-phase ZGO.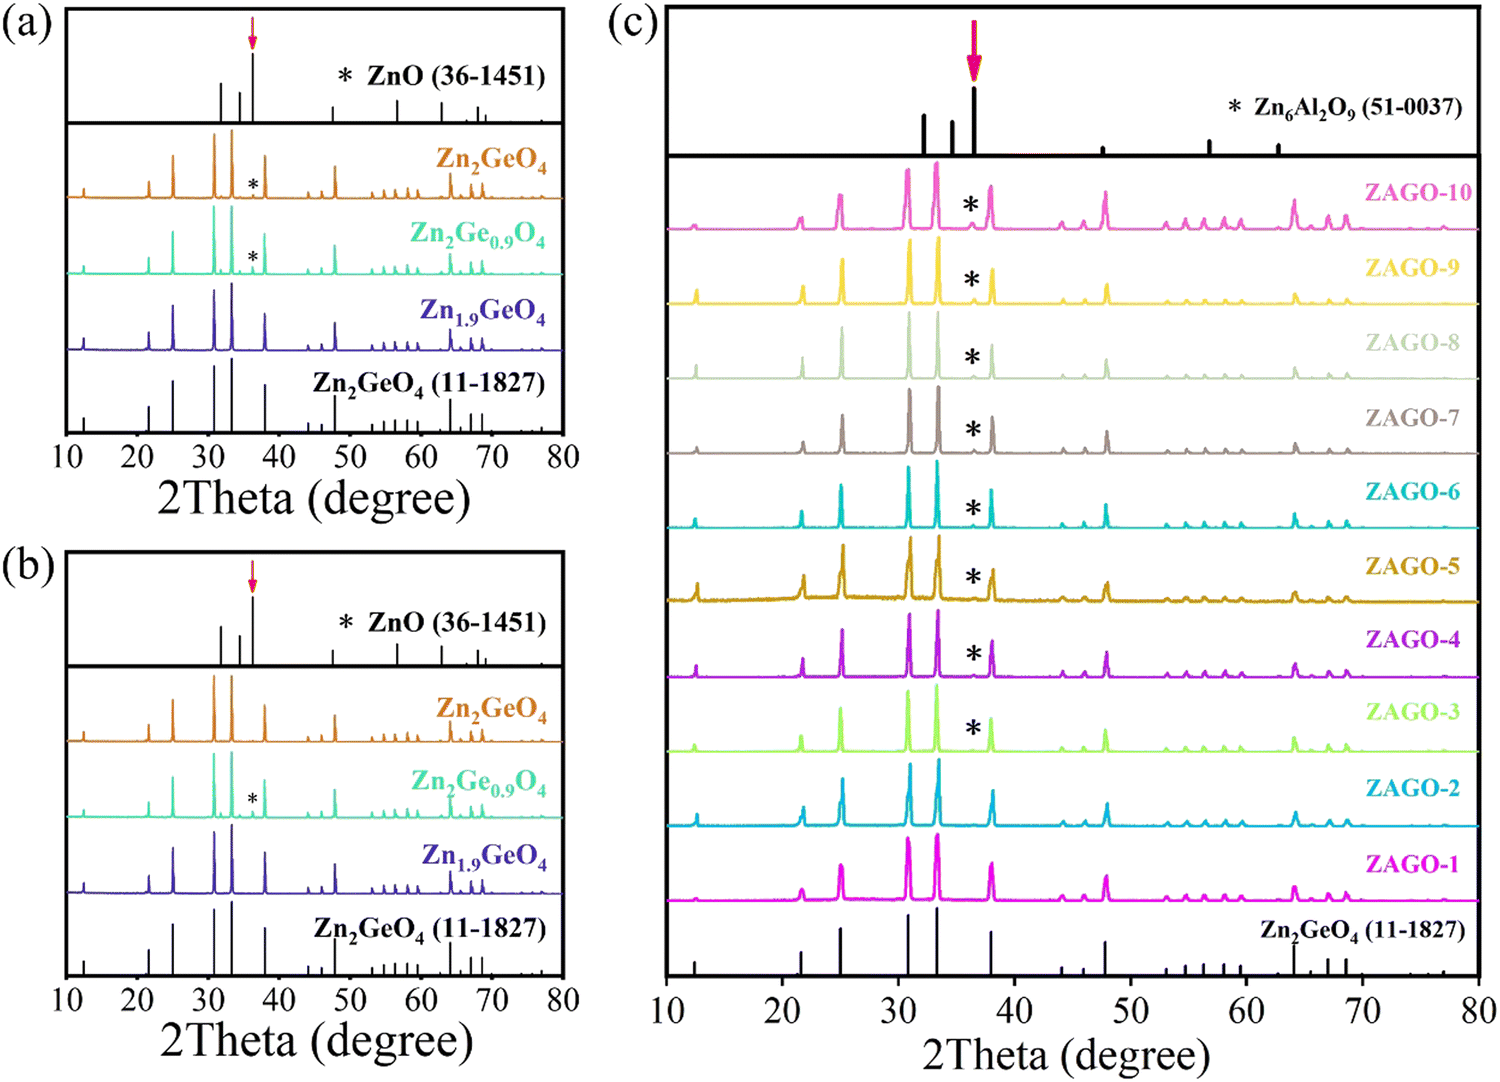 | ||
| Fig. 1 XRD patterns of ZGO at different Zn/Ge ratios under (a) air and (b) N2 atmospheres, together with (c) ZAGO at different doping concentrations of Al3+. ZGO, zinc germanate; ZAGO, Al3+-doped zinc germanate; XRD, X-ray diffraction. | ||
Through the characterization of XRD, we also find that the ZGO phase cannot be obtained under a CO atmosphere, which is attributed to the following reactions between ZnO and CO at high temperature.31
| C + O2 → CO2 |
| CO2 + C → CO |
| ZnO + CO → Zn (vapor) + CO2 |
ZnO is reduced to zinc vapor by CO, then evaporated as exhaust gas that partly condensed in the lid of the crucible. Hence, there is no ZGO product in the crucible and the CO atmosphere is not discussed any more in the later content.
Moreover, the XRD patterns of ZAGO were also investigated (Fig. 1c). The main phase of ZAGO at different proportions of Al3+ can be indexed to ZGO, but as Al3+ concentration increases, diffraction peaks appear at 38° with enhanced intensities, which belong to the impurity phase of Zn6Al2O9 (PDF#51-0037). ZAGO shows the pure phase upon the addition of 0.015 Al3+, indicating that a small amount of Al3+ successfully replaces Ge4+ to form a solid solution. When the concentration of Al3+ continues to increase, impurities emerge in the crystal, and thus the optimal concentration of Al3+ in ZGO is about 0.015. Therefore, ZAGO is further discussed as a representation for studying the effect of the dopant on the luminescence and afterglow properties of ZGO.
3.2. Photoluminescence properties
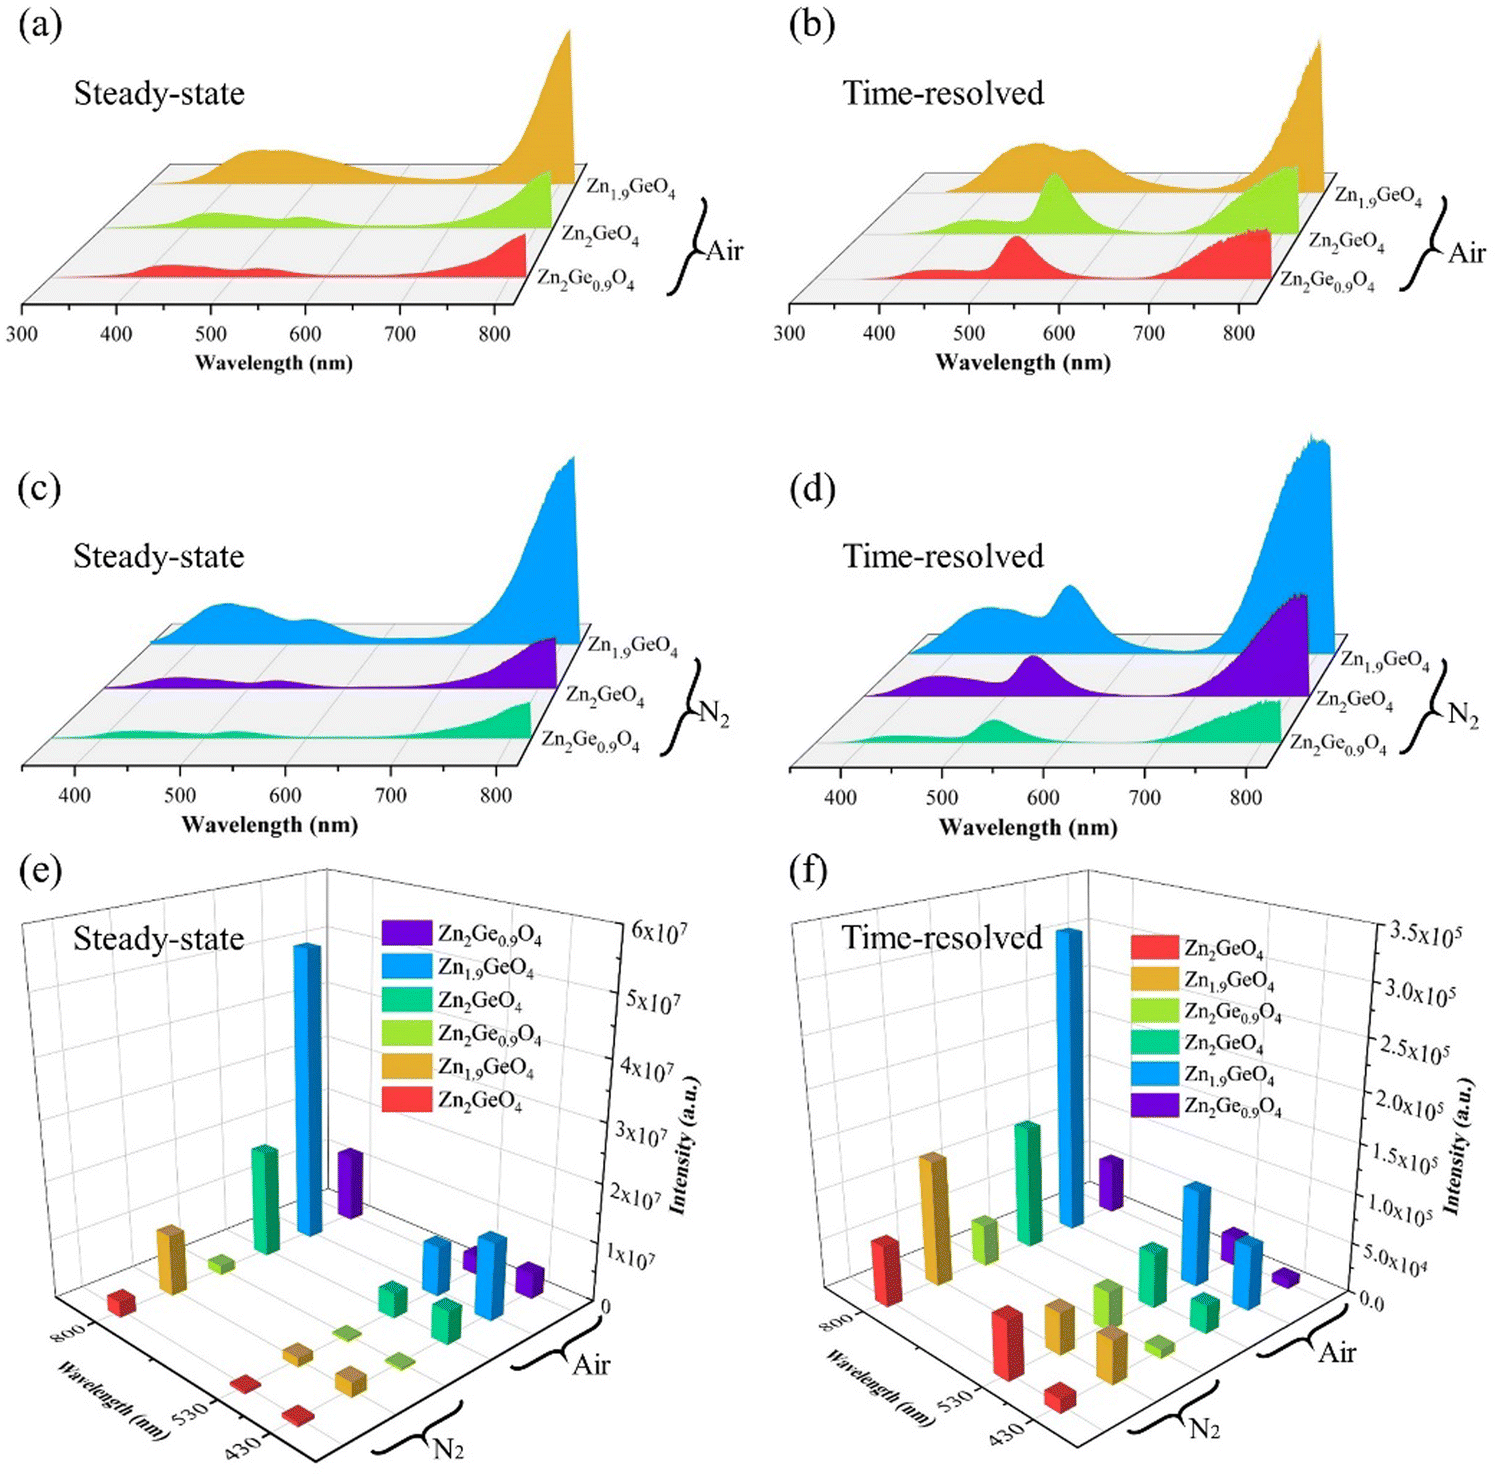 | ||
| Fig. 2 Steady-state and time-resolved emission spectra of ZGO at different Zn/Ge ratios in (a) and (b) air and (c) and (d) N2 atmospheres, together with (e) and (f) peak intensities of ZGO at different emission wavelengths (430 nm, 530 nm, 800 nm). Excitation wavelength: 273 nm. ZGO, zinc germanate. | ||
| Defect types | Chemical equation |
|---|---|
| Schottky | 2ZnZn + GeGe + 4OO → 2VZn + VGe + 4VO + Zn2GeO4 |
| Pseudo-Schottky | ZnZn + OO → VZn + VO + ZnO |
| GeGe + 2OO → VGe + 2VO + GeO2 | |
| Anti-Schottky | Zn2GeO4 → 2Zni + Gei + 4Oi |
| Frenkel | OO → Oi + VO |
| ZnZn → Zni + VZn | |
| GeGe → Gei + VGe |
There are many types of native defects in ZGO, such as Gei, Zni, VO, and VZn, depending on the adjacent atom, charge, and coordination structure. Each native defect corresponds to a different trap depth. These defects, serve as emissive centers, and are triggered by the recombination of electron–hole traps, leading to blue, green, and near-infrared (NIR) light under 273 nm excitation.
The emission intensities of Fig. 2 show that zinc-deficient sample Zn1.9GeO4 has the highest emission intensity among all the samples regardless of under air or N2 conditions (Fig. 2e and f), indicating that VZn defects are involved as main hole trap in the afterglow process. In addition, for steady-state emission spectra as shown in Fig. 2a and c, the intensity of green light emission which peaked at 530 nm is lower than that of blue light emission which peaked at 430 nm in all ZGO samples. However, for time-resolved emission spectra as shown in Fig. 2b and d, the intensity at 530 nm is significantly higher than that of the 430 nm peak in Zn2GeO4 and Zn2Ge0.9O4, indicating green light has a longer persistent luminescence duration than blue light. Interestingly, the green-blue ratio of ZGO emission intensity decreased with the zinc content, which suggests the green light emission is related to the native defects Zni. Hence, we speculate that the green light emission comes from the recombination of positively charged Zni and negatively charged zinc holes (VZn). Meanwhile, germanium-excess sample Zn1.9GeO4 shows relative stronger intensity for the blue band, indicating that Gei may participate in the blue band emission process. Therefore, we conclude that Zni, Gei, and VZn play the role of luminescent centers in ZGO and the reduction of the Zn/Ge ratio boosts the PL properties of ZGO. The assignment for each emission band will be further discussed in the following sections based on the afterglow decays and thermoluminescence results.
Excitation intensities at three emission wavelengths of different ZGO samples given in Fig. 3a shows that Zn1.9GeO4 always has the highest intensities. By comparing excitation spectra, as shown in Fig. S2 (ESI†), a high excitation peak at around 270 nm is observed in all excitation spectra, which is attributed to the transition from the valence band (VB) to the conduction band (CB) with the band gap of about 4.6 eV. One more excitation band at about 380 nm is displayed at an emission wavelength of 800 nm. These excitation peak positions also conform to those of UV-vis DRS of ZGO samples in Fig. 3b and c, showing two strong absorption peaks at around 270 and 380 nm. Furthermore, all samples have no obvious absorption in the visible light region ranging from 400 to 800 nm, and thus are shown in white under sunlight (Fig. 3d). Interestingly, after irradiation for 5 minutes under a 254 nm UV lamp, the diffuse reflection coefficient of all samples has a considerable decrease, indicating the enhanced absorption of visible light. Meanwhile, samples change from white to greyish, with Zn1.9GeO4 and Zn2Ge0.9O4 showing more obvious greyish color compared with Zn2GeO4, which corresponds to stronger absorption of visible light in DRS. This photochromic property may be related to the defects' ability to capture electrons. After exposure to sunlight or heat again, the samples are bleached back to white, suggesting a reversible color conversion process. So ZGO can reversibly record and erase information through UV and visible light irradiation, and thus has the potential as an optical information storage material.
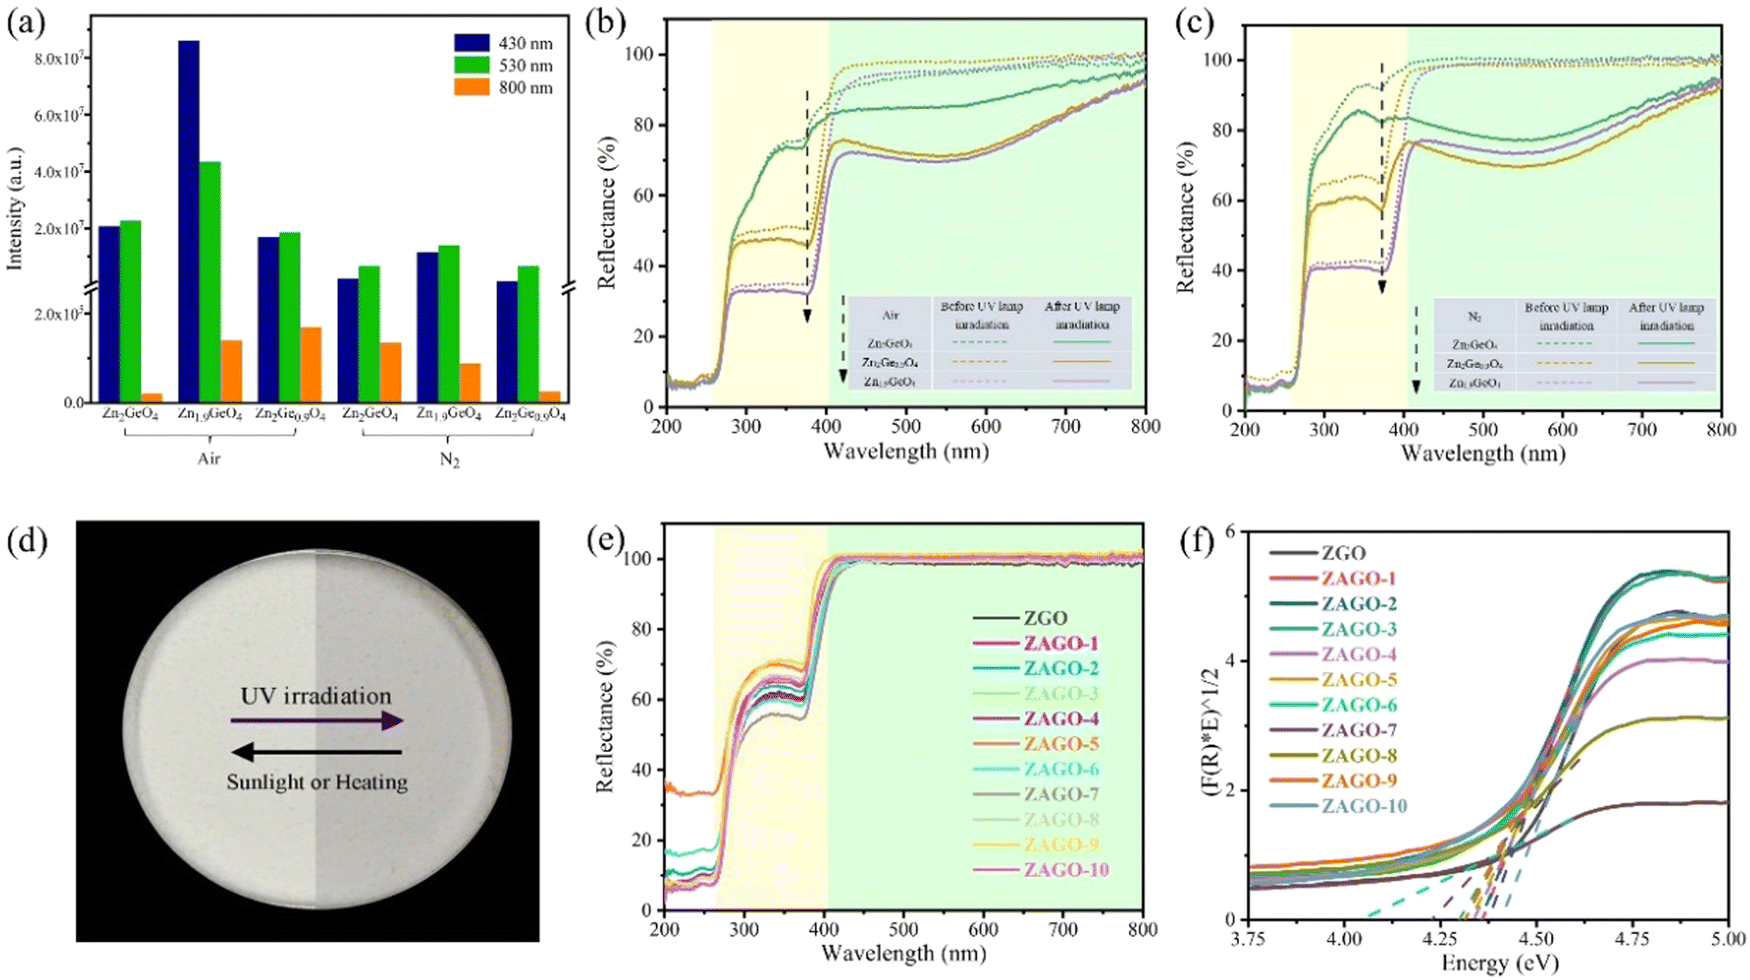 | ||
| Fig. 3 (a) Excitation intensities at different emission wavelengths of ZGO, DRS of ZGO at different Zn/Ge ratios in (b) air and (c) N2 atmospheres before and after 254 nm UV lamp irradiation, and (d) reversible color conversion process of Zn1.9GeO4 in air atmosphere, together with (e) DRS and (f) (F(R) × E)1/2 versus Energy diagram of ZAGO at different doping concentrations of Al3+. ZGO, zinc germanate; ZAGO, Al3+-doped zinc germanate. DRS, diffuse reflectance spectra; UV, ultraviolet. | ||
The excitation spectra almost agree with UV-vis DRS results as shown in Fig. S4 (ESI†). The peaks at 264 nm have high excitation intensities under an emission wavelength of 530/632 nm, whereas the excitation peaks at 371 nm are more obvious by monitoring emission at 632 nm compared with 530 nm. The excitation intensity at 264 nm increases with the addition of Al3+, with ZAGO-2 reaching the highest point. After that, the excitation intensity gradually decreases, but it always several times higher than that of ZGO, indicating a good excitation efficiency in ZAGO. This excitation peak appears both in ZGO and ZAGO, which is attributed to the inter-band transition of the ZGO host. The other excitation peak of 371 nm is due to the enhanced energy level of a certain defect between the CB and VB after the incorporation of Al3+, thus it only appears in ZAGO.
Steady-state and time-resolved emission spectra of ZAGO given in Fig. 4 show that fluorescence intensities of ZAGO series samples are significantly stronger than those of ZGO by nearly 10 times. Comparing the emission peak shapes of ZAGO and ZGO, when excited at 264 nm, ZAGO samples only have an emission peak at around 530 nm, whereas the emission peaks at 430 nm and 800 nm for ZGO disappear in ZAGO due to the doping of Al3+. Moreover, it is surprising that ZAGO samples exhibit a broadband emission at around 632 nm and emit yellow light under an excitation of 370 nm. Time-resolved emission spectra show that ZAGO samples have broad emission with high intensity compared with three emission peaks of ZGO. The different emission spectra between ZGO and ZGAO is most likely because Al3+ replaces Ge4+ and thus change Ge related defects in the crystal. The ionic radii in the tetrahedral structure of zinc germanate satisfy the replacement rule as Ge4+ (CN = 4) and Al3+ (CN = 4) have the same ionic radius of 0.39 Å. Furthermore, the disappearance of 430 nm and 800 nm emission in ZAGO indicates that the blue and red emissions in ZGO may be related to Ge. Due to the non-equivalent incorporation of Al3+ into the Ge4+ site, the incorporation of Al3+ generates new defects AlGe. The emission of 632 nm in ZAGO under the excitation of 371 nm cannot be found in ZGO, which suggests that the incorporation of Al3+ into ZGO may introduce AlGe defects into the crystal, leading to yellow emission.
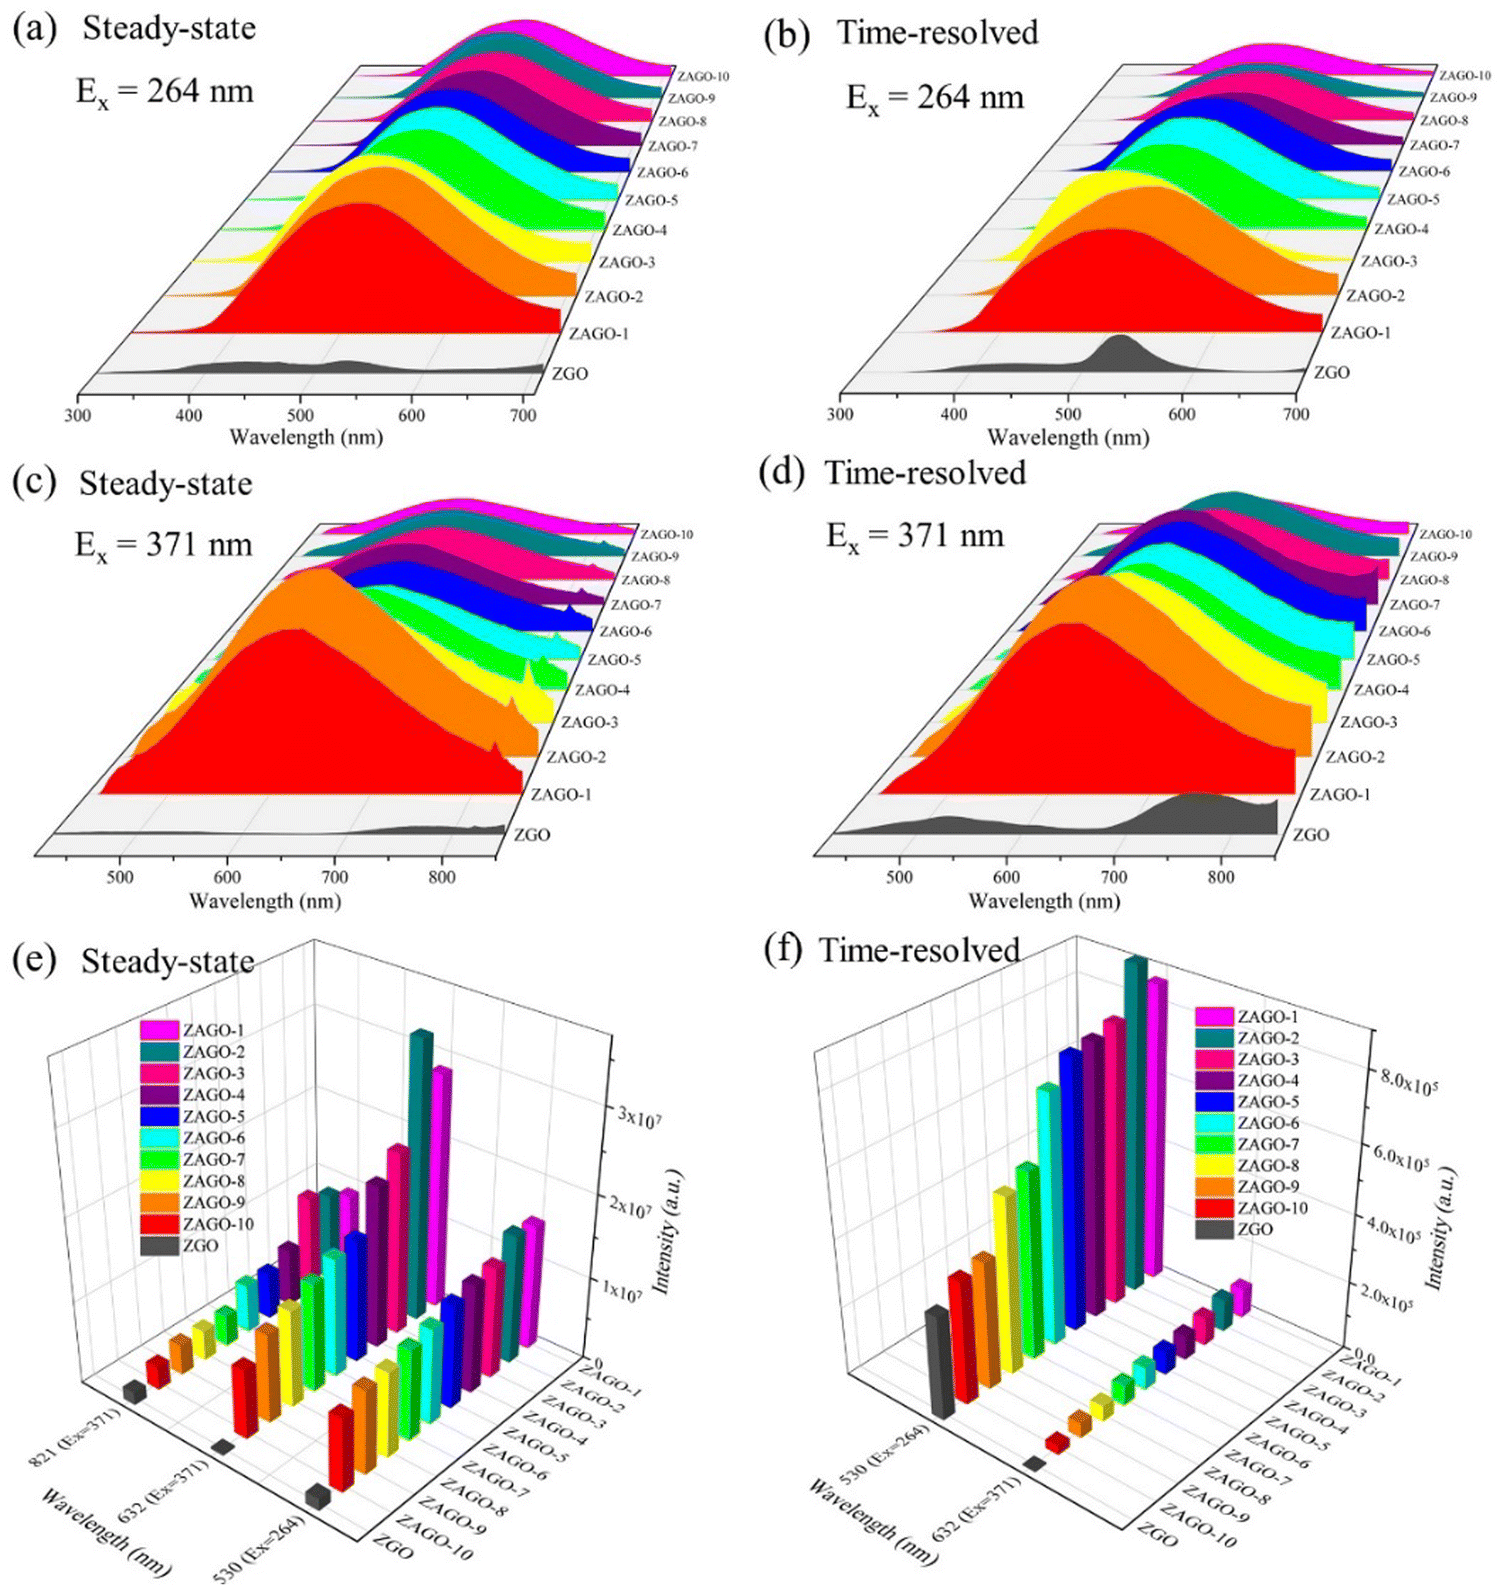 | ||
| Fig. 4 Steady-state and time-resolved emission spectra of ZAGO excited at (a) and (b) 264 nm and (c) and (d) 371 nm, together with (e) and (f) peak intensities at different emission wavelengths (430 nm excited at 264 nm and 530 nm and 800 nm excited at 371 nm). ZGO, zinc germanate; ZAGO, Al3+-doped zinc germanate. | ||
3.3. Afterglow performance
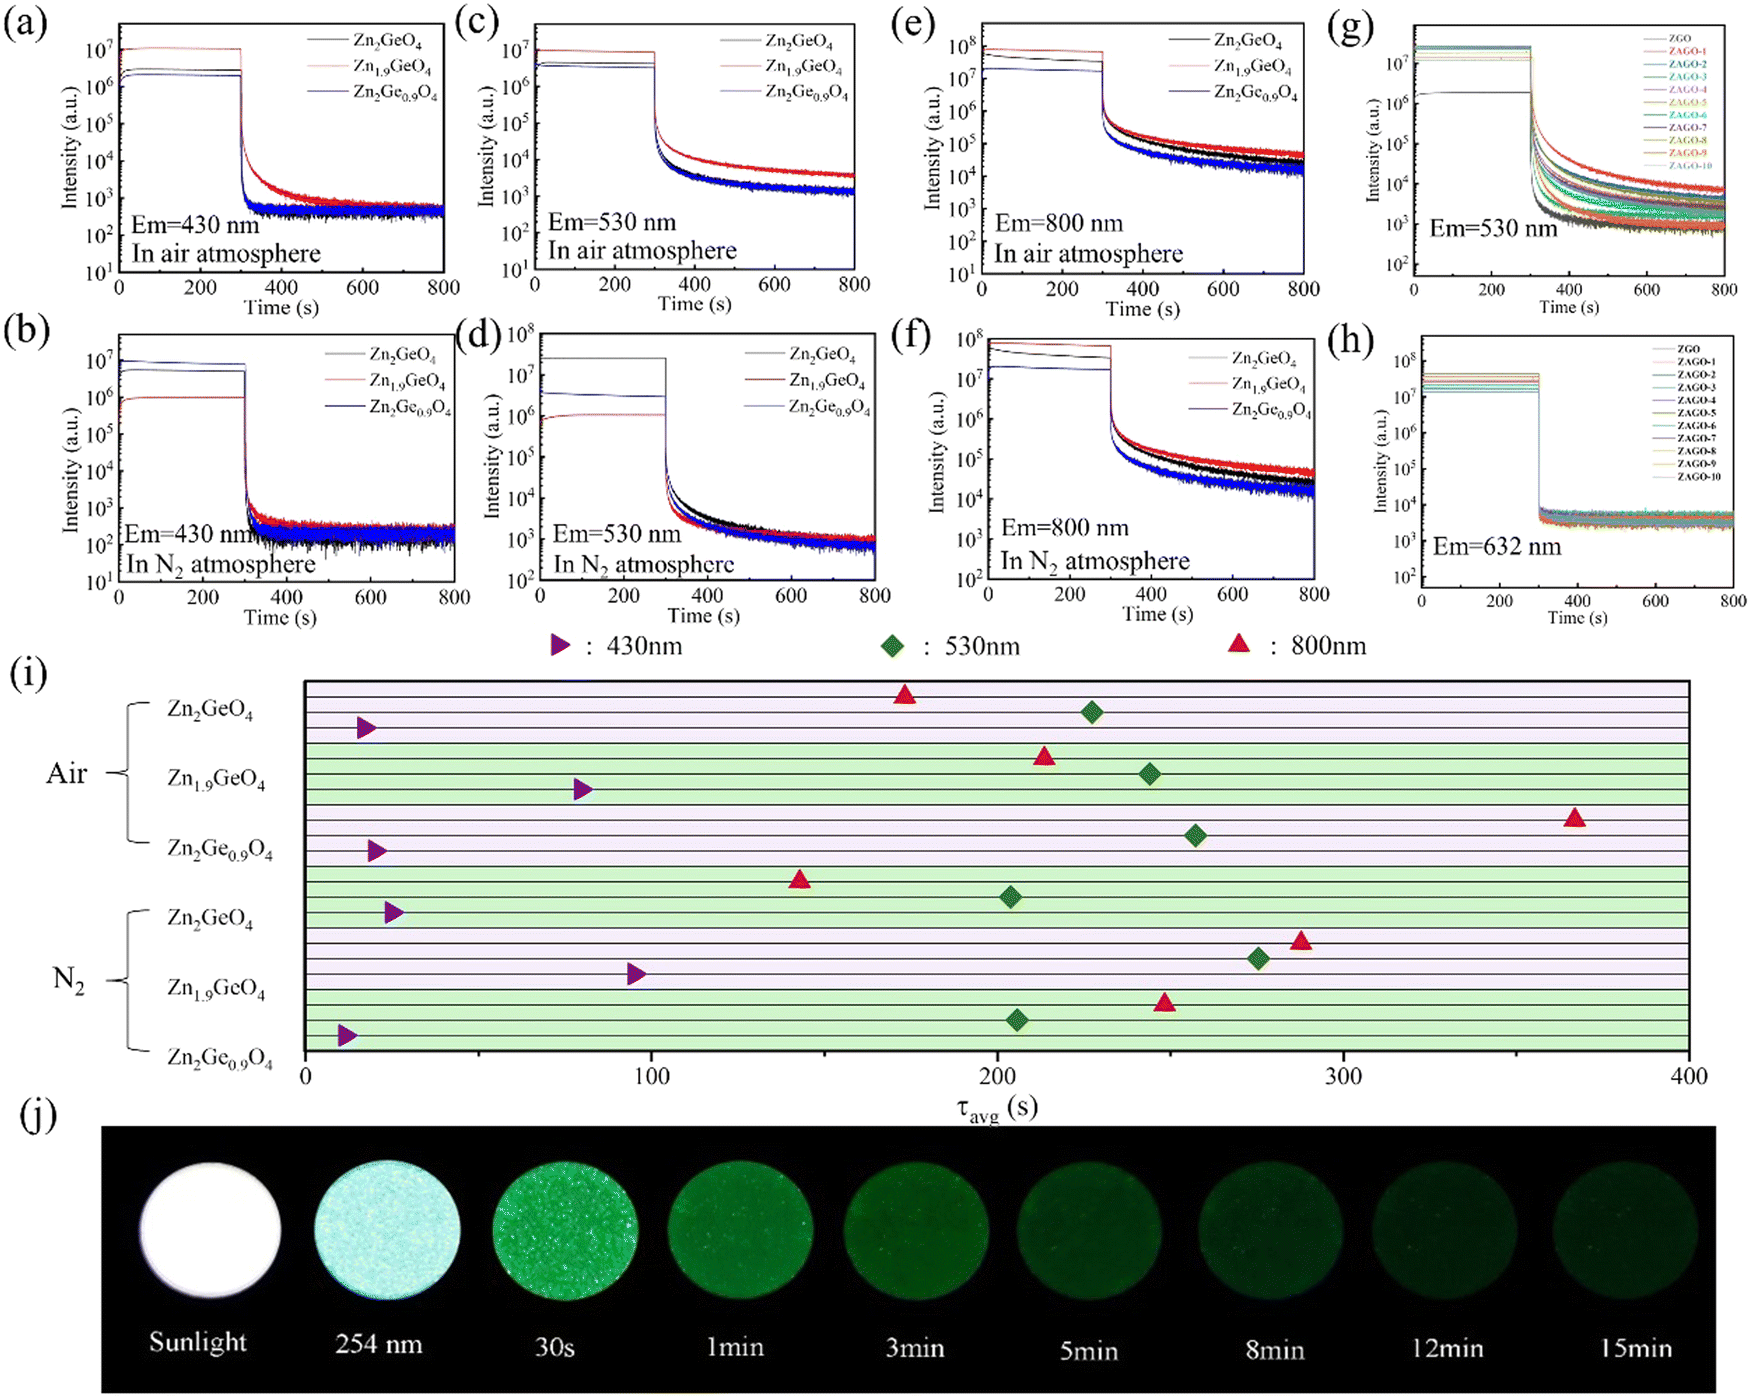 | ||
| Fig. 5 The afterglow decay curves of ZGO at emission wavelengths of (a) 430 nm, (c) 530 nm, and (e) 800 nm under an air atmosphere, (b) 430 nm, (d) 530 nm, and (f) 800 nm under an N2 atmosphere, and ZAGO at emission wavelengths of (g) 530 nm, and (h) 632 nm, together with (i) decay times of different ZGO and (j) the images of Zn1.9GeO4 (air) under natural light, 254 UV lamp, and at different decay time after irradiation. ZGO, zinc germanate; ZAGO, Al3+-doped zinc germanate; UV, ultraviolet. | ||
By comparing samples with different Zn/Ge ratios under the same emission wavelength, it can be seen that the afterglow intensity of zinc-deficient sample Zn1.9GeO4 in all emissions is the strongest and the afterglow decay time is relatively long (Fig. 5i), which indicates that reducing the Zn/Ge ratio is beneficial for increasing the number of native defects and the trap depth, thereby improving the afterglow performance. In comparison to the common ZGO with a Zn/Ge ratio of 2![[thin space (1/6-em)]](https://www.rsc.org/images/entities/char_2009.gif) :1, Zn1.9GeO4 lacks Zn atoms, which leads to the generation of more zinc vacancies (VZn). This can provide further evidence for enhanced afterglow performance of zinc-deficient samples.
:1, Zn1.9GeO4 lacks Zn atoms, which leads to the generation of more zinc vacancies (VZn). This can provide further evidence for enhanced afterglow performance of zinc-deficient samples.
Furthermore, it is worth noting that owing to dispersive afterglow decay dynamics of the three colors, only one fixed emission color can be observed in a time window. As shown in Fig. 5j, at the beginning Zn1.9GeO4 is white under natural light, and when illuminated by a 254 nm UV lamp, it exhibits a bluish-white luminescence. After excitation ceases, due to bad sensitivity of NIR light by the human eye, the initial afterglow mainly exhibits blue and green light at the first 30 s. With the blue luminescence decaying rapidly, the sample starts to emit green light, and this duration is as long as 15 min. This feature of color changing indicates a promising dynamic anti-counterfeiting application.
Double exponential fitting was performed on the afterglow decay curves of ZGO and a representative ZAGO sample to further compare the changes in their afterglow performance. The fitting is used in the following equation:
| I(t) = I0 + A1exp(−t/τ1) + A2exp(−t/τ2) |
where I represents the fluorescence intensity, τ is the decay time constant, t represents the time, and A is a constant. The double exponential fitting results are shown in Table S4 (ESI†). It is clear that the incorporation of Al3+ significantly increases the decay rate constant from 66.58 s in ZGO to 120.45 s in ZGAO-2, indicating that the number of traps inside the crystal becomes larger with Al3+, thereby enhancing the afterglow performance of ZAGO.
3.4. Thermoluminescence
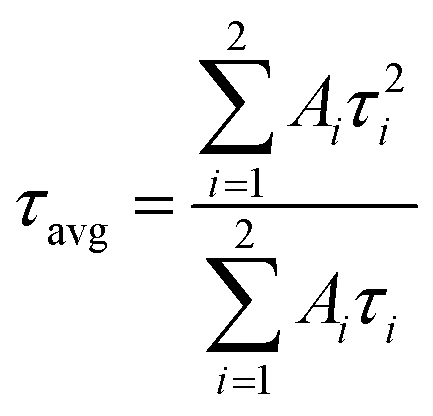
| E (eV) = Tm (K)/500 |
 | ||
| Fig. 6 TL spectra of ZGO at emission wavelengths of (a) 430 nm, (b) 530 nm, and (c) 800 nm under different atmospheres, together with (d) peak temperature and (e) trap depth of ZGO at different emissions, and (f) trap density of ZGO at 800 nm emission in the thermal release process. ZGO, zinc germanate; TL, thermoluminescence. | ||
According to Urbach's empirical formula, the trap depth linked with blue light and green light is not more than 0.61 eV in all ZGO samples except for Zn1.9GeO4 under an air atmosphere at 530 nm emission, with 0.63 eV. For 800 nm emission, all TL curves consist of two peaks, and the peaks shift to the high temperature with decreasing Zn/Ge ratios. Compared with other ZGO samples, Zn1.9GeO4 under an air atmosphere has deeper traps of 0.70 and 0.91 eV. Furthermore, in order to estimate the trap density in ZGO, TL spectra were integrated to calculate the TL peak areas at 800 nm emission. As shown in Fig. 6f, Zn1.9GeO4 has the largest TL area, indicating that it has the highest trap density when emitting NIR light. This result is consistent with TL spectra, in which Zn1.9GeO4 under an air atmosphere has the highest curve at 800 nm emission. Therefore, TL results prove that an appropriate decrease in the Zn/Ge ratio promotes the formation of more VZn, leading to an increase in the trap concentration in ZGO. Moreover, the reduced Zn/Ge ratio is also beneficial for deepening the trap depth, and thus the afterglow performance can be improved.
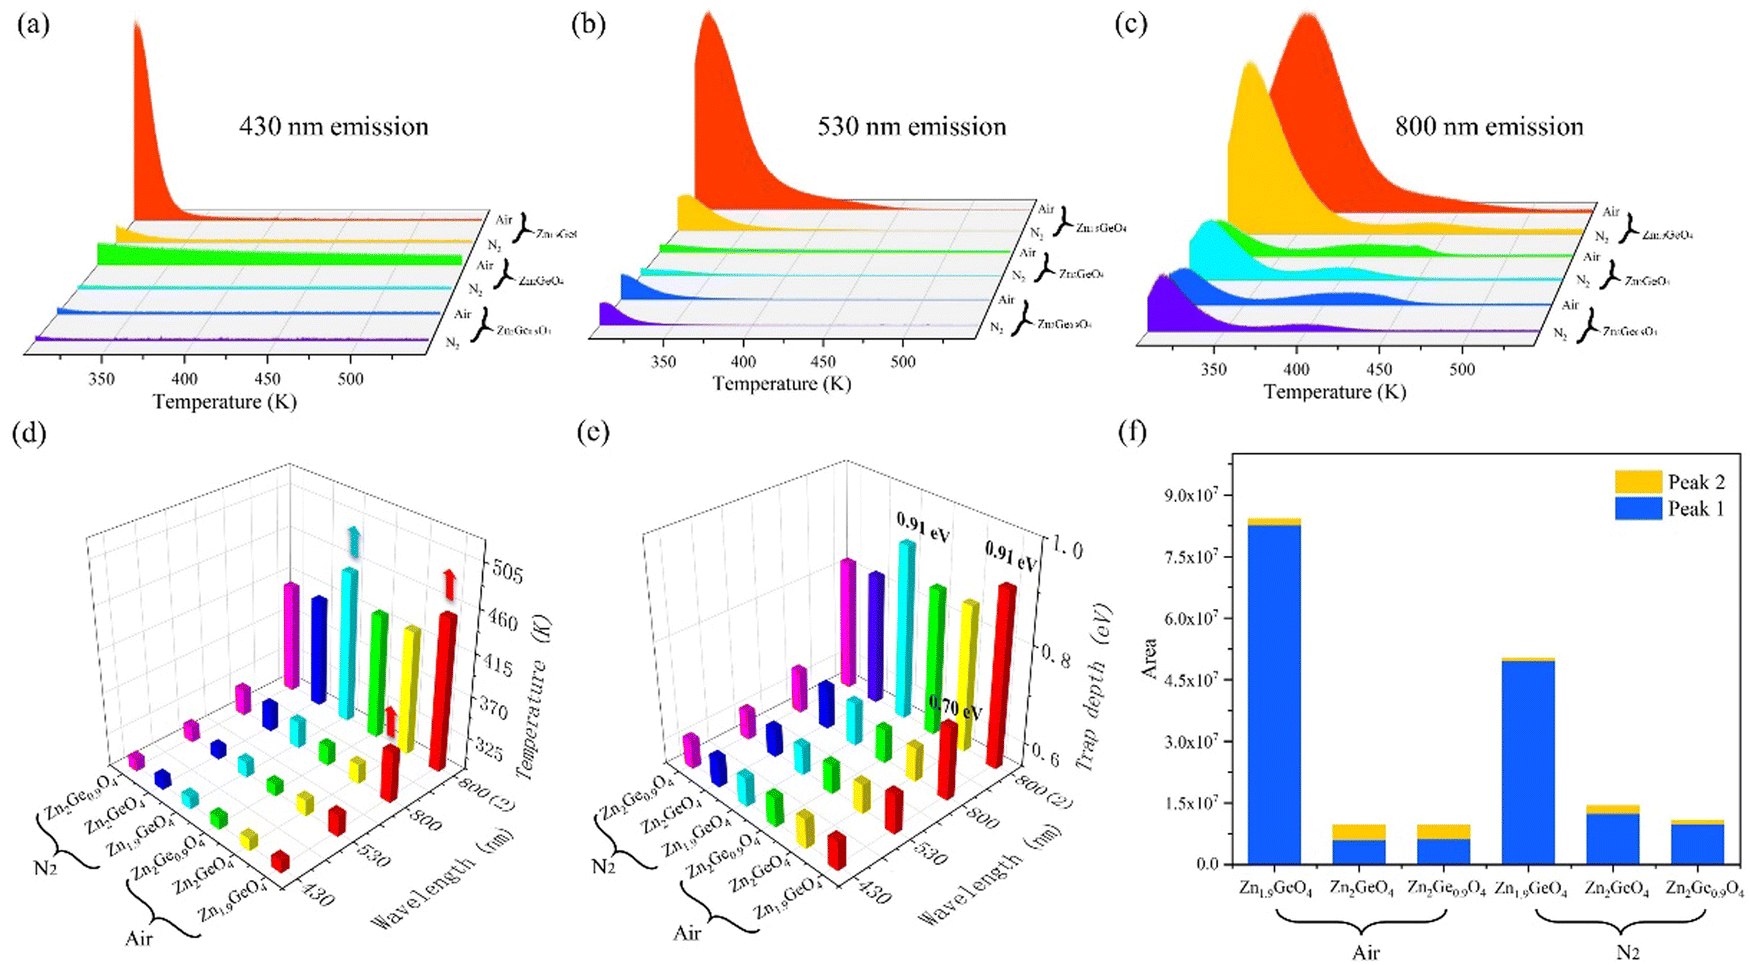
In order to further reveal the optical properties of ZGO related to temperature, a series of temperature-dependent PL spectra of Zn1.9GeO4 under an air atmosphere were recorded from 303 to 473 K. As shown in Fig. 7a, the emission intensities at 430 and 530 nm decrease significantly with the increase of temperature, while the intensity of 800 nm emission has a small change. The spectral change of Zn1.9GeO4 (air) as a function of temperature can be clearly read out on the CIE chromaticity diagram. Fig. 7b shows a trend of CIE coordinates from (0.2495, 0.3153) to (0.3057, 0.3242) when the temperature increases from 303 to 473 K, and the color gradually changes from blue-green to green-yellow. The change in emission colors with the increase of temperature gives Zn1.9GeO4 (air) an opportunity for thermal sensing.
 | ||
| Fig. 7 (a) Temperature-dependent PL spectra and (b) the CIE chromaticity diagram of Zn1.9GeO4 (air). PL, photoluminescence. | ||
To verify the trap depth in calculations, thermal emptying treatments were further carried out by heating Zn1.9GeO4 to 333 K for 3 min. As shown in Fig. S6d (ESI†), TL peaks at 430 nm and 530 nm emissions disappear, indicating all electrons in the traps have been released during the preceding thermal treatment. Meanwhile, an apparent peak is observed by monitoring at 800 nm emission, which corresponds to the defects with deep traps as explained above. Combined with all TL results, we affirm that long-wavelength emission connects with deeper traps.
3.5. Afterglow mechanism
The above phenomenon in ZGO and ZAGO is difficult to explain by the well-known activator based afterglow models,33–36 but it is somewhat similar to the afterglow model proposed by Clabau,37 in which a phosphor can emit light directly without electron transfer through the CB. Therefore, unlike the afterglow mechanism based on luminescent centers, we have constructed an afterglow mechanism for a self-activated system based on native defects.Through afterglow spectra and TL tests of ZGO and ZAGO, we confirm that there are a large number of traps with a wide distribution range (0.61–0.91 eV) due to native defects in ZGO. The schematic diagram of our speculated afterglow emission is shown in Fig. 8. Different from the traditional afterglow materials with discrete luminescence centers, ZGO samples are considered to have the recombination of multiple luminescence centers. Firstly, electrons in the VB are excited to the CB under 270 nm UV light as the result of the generation of holes in the VB. Then parts of electrons are captured by traps through the relaxation process. In order to simplify the diagram of the afterglow emission mechanism, electron defects of each energy level are simplified to representative native defects corresponding to the wavelength, though in fact each electron defect should be a complex composed of multiple native defects. These native defects, Gei, Zni, and VO, combine with the hole traps VZn and VGe to emit 430 nm, 530 nm, and 800 nm light, respectively. It should be noted that VZn formed due to the deficiency of Zn atoms plays a major role of a hole trap, based on the characterization results of ZGO at different Zn/Ge ratios and sintering atmospheres. However, VGe theoretically works as the hole trap as well in the afterglow mechanism of ZGO, so it is also marked in Fig. 8. After the excitation is stopped, electrons stored in the electron traps return to the VB due to the disturbance of light, heat, etc, and meanwhile, some of the electrons combine with the defects during the free movement process to produce afterglow luminescence. Since electron traps have different concentrations, the afterglow decay rates are inequable. Thereinto VO has the highest trap concentration and depth, and therefore, a higher afterglow intensity and a longer lifetime are achieved under 800 nm light, in which VO mainly occur.
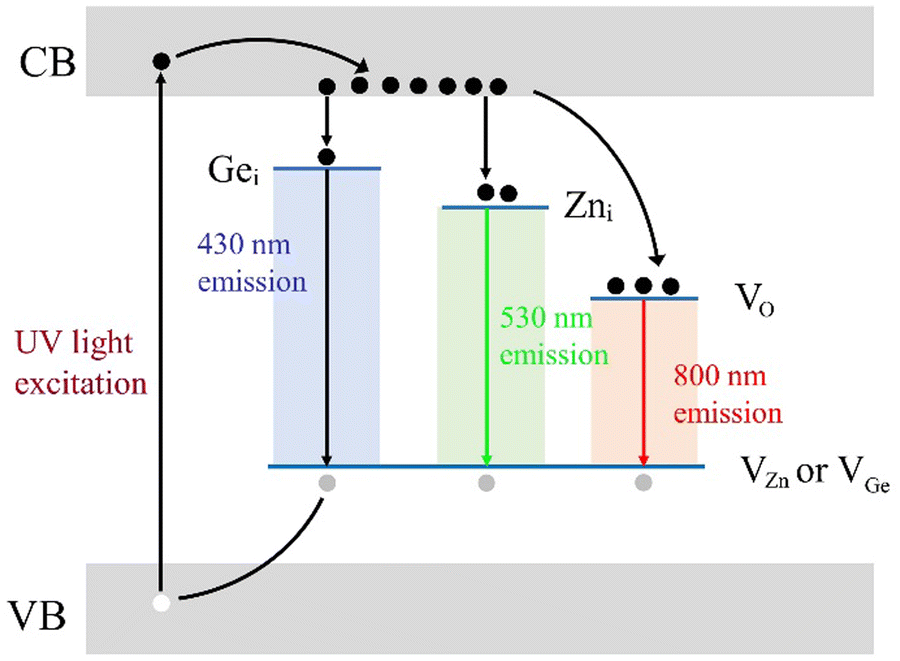 | ||
| Fig. 8 Schematic diagram of the afterglow mechanism of ZGO. ZGO, zinc germanate. | ||
3.6. Anti-counterfeiting application
Benefitting from the stable afterglow for a considerable time in ZGO and ZAGO after excitation ceases, two dynamic anti-counterfeiting applications were designed. A Tai Chi pattern, as shown in Fig. 9a, consists of two parts, the red part indicating BaSO4 with non-light-absorbing characteristics and the white part representing ZGO with photochromic and multi-color properties. Under sunlight, the whole pattern is nearly shown as white, and thus the pattern details are difficult to distinguish. After being irradiated with a 254 nm UV lamp for 5 minutes, ZGO becomes gray, showing a small difference between ZGO and BaSO4 and an outline of the Tai Chi pattern. In the dark, observation under 254 nm UV light, the two parts show red for BaSO4 and light cyan for ZGO when the light hits the pattern, and furthermore, ZGO shows an obvious green afterglow after the light ceases due to its afterglow properties while BaSO4 is completely dark. Two “Yin and Yang Fish” formed the circle, the Tai Chi pattern is clearly observed for up to 10 min, and the afterglow color gradually changes from blue-green to green. | ||
| Fig. 9 The anti-counterfeiting application of ZGO and ZAGO. (a) The designed Tai Chi pattern filled with BaSO4 and ZGO, and (b) a digital pattern “8888” painted with ZGO and ZAGO, showing the color change under natural light, 254 UV lamp, 365 UV lamp, and at different decay times after irradiation. ZGO, zinc germanate; ZAGO, Al3+-doped zinc germanate; and UV, ultraviolet. | ||
In order to distinguish anti-counterfeiting effects of ZGO with and without a dopant, a digital pattern “8888” was created based on the different fluorescence and afterglow characteristics of ZGO and ZAGO, where “2023” was painted with ZAGO and the rest was ZGO as shown in Fig. 9b. Under natural light, both ZGO and ZAGO represent white, so the pattern is displayed as the original design “8888”. Similarly, the displayed number is still “8888” under 254 nm UV irradiation, which is ascribed to the strong fluorescence intensity of ZAGO and ZGO. After the excitation light source is turned off, ZAGO retains strong afterglow emission, whereas ZGO exhibits a green afterglow due to its relatively longer lifetime of green emission compared with blue emission. Afterwards, the afterglows of ZGO and ZAGO continuously reduced. Until the excitation ceases for about 1 minute and 30 seconds, the afterglow of ZGO is hard to observe, but ZAGO still maintains strong fluorescence, therefore, the pattern appears as “2023”, achieving the change from “8888” to “2023”, and the digital pattern continues to maintain fluorescence for about 5 minutes. Moreover, ZAGO has an obvious excitation peak at about 371 nm, therefore, when irradiated at 365 nm, ZAGO emits yellow while ZGO shows weak purple fluorescence, thus a yellow “2023” pattern can be observed. After turning off the UV lamp, due to a much stronger afterglow intensity in ZAGO compared with ZGO, ZAGO shows a slight afterglow decay, and a faint green fluorescence of “2023” could still be observed after 30 seconds. Therefore, by utilizing the differences in fluorescence and afterglow performance between ZGO and ZAGO, dynamic anti-counterfeiting can be achieved, enhancing the security of authenticity identification.
4. Conclusions
In summary, a series of ZGO samples were synthesized and their native defects were regulated successfully by changing the Zn/Ge ratio, sintering atmosphere, and aliovalent substitution strategy. All ZGO samples exhibit ternary persistent luminescence with blue (430 nm), green (530 nm), and new observed near-infrared (NIR, 800 nm) emissions. Aliovalent substitution sample ZAGO exhibits high-intensity yellow (632 nm) light emission and a considerably enhanced green (530 nm) light afterglow. We figured out that luminescence and afterglow properties are enhanced by reducing the Zn/Ge ratio and increasing the proportion of oxygen, which is caused by the formation of VZn and VO. Hence, we proposed that blue, green, and NIR emissions are linked to transitions from electron traps Gei, Zni, and VO, to the hole traps VZn and VGe, respectively. The deduced mechanism is beneficial for light tunability and paves the way to exploit new ZGO materials with better persistent luminescence properties. The final anti-counterfeiting applications on the basis of photochromic and multi-color properties of ZGO and ZAGO provide efficient strategies for more secure dynamic anti-counterfeiting encryption.Data availability
The data supporting this article have been included as part of the ESI.†Conflicts of interest
The authors declare that they have no known competing financial interests or personal relationships that could have appeared to influence the work reported in this paper.Acknowledgements
The authors gratefully acknowledge the financial support from the National Natural Science Foundation of China (52372158 and 22404150), the Zhejiang Provincial Natural Science Foundation of China (LZ18B050002 and LQ24B020010), and the Scientific Research Foundation for Scholars funded by Zhejiang University of Technology (2022181010002).References
- L. L. Liang, J. Y. Chen, K. Shao, X. Qin, Z. F. Pan and X. G. Liu, Nat. Mater., 2023, 22, 289–304 CrossRef CAS PubMed.
- T. Hu, H. Cheng, D. Yang, K. Shao, Y. Teng and Z. Pan, Mater. Today Chem., 2023, 30, 11 Search PubMed.
- Q. P. Du, J. Ueda and S. Tanabe, J. Mater. Chem. C, 2023, 11, 16225–16233 RSC.
- T. Lyu and P. Dorenbos, Appl. Phys. Rev., 2024, 11, 17 Search PubMed.
- T. S. Lyu, P. Dorenbos and Z. H. Wei, Acta Mater., 2024, 273, 18 CrossRef.
- T. Lyu, P. Dorenbos and Z. H. Wei, Chem. Eng. J., 2023, 461, 15 CrossRef.
- Y. Liu, S. P. Yan, T. C. Wang, Q. S. He, X. D. Zhu, C. Wang, D. Y. Liu, T. Wang, X. H. Xu and X. Yu, Angew. Chem., Int. Ed., 2023, 62, 7 Search PubMed.
- K. Bartosiewicz, V. Fritz, D. van der Heggen, D. Szymanski, J. Zeler, J. Pejchal, A. Yamaji, R. Kucerkova, A. Beitlerova, S. Kurosawa, A. Yoshikawa, P. F. Smet, E. Zych and M. Nikl, J. Mater. Chem. C, 2023, 11, 8850–8865 RSC.
- C. Y. Yan, N. Singh and P. S. Lee, Appl. Phys. Lett., 2010, 96, 3 Search PubMed.
- J. Dolado, J. García-Fernández, P. Hidalgo, J. González-Calbet, J. Ramírez-Castellanos and B. Méndez, J. Alloys Compd., 2022, 898, 8 CrossRef.
- D. L. Gao, F. Gao, Q. Q. Kuang, X. Y. Zhang, Z. H. Zhang, Y. Pan, R. P. Chai and H. Jiao, ACS Appl. Nano Mater., 2022, 11, DOI:10.1021/acsanm.2c02163.
- M. Masjedi-Arani and M. Salavati-Niasari, Int. J. Hydrogen Energy, 2017, 42, 17184–17191 CrossRef CAS.
- Z. D. Han, Y. Zhao, G. Y. Gao, W. Y. Zhang, Y. Qu, H. Y. Zhu, P. F. Zhu and G. F. Wang, Small, 2021, 17, 10 Search PubMed.
- M. M. S. Sanad, J. Mater. Sci.: Mater. Electron., 2021, 32, 9929–9937 CrossRef CAS.
- Q. Y. Bai, Z. J. Wang, P. L. Li, S. C. Xu, T. Li and Z. P. Yang, RSC Adv., 2016, 6, 102183–102192 RSC.
- M. H. Wan, Y. H. Wang, X. S. Wang, H. Zhao, H. L. Li and C. Wang, J. Lumin., 2014, 145, 914–918 CrossRef CAS.
- M. H. Wan, Y. H. Wang, X. S. Wang, H. Zhao and Z. F. Hu, Opt. Mater., 2014, 36, 650–654 CrossRef CAS.
- B. B. Srivastava, S. K. Gupta, Y. Li and Y. B. Mao, Dalton Trans., 2020, 49, 7328–7340 RSC.
- H. L. He, Y. H. Zhang, Q. W. Pan, G. B. Wu, G. P. Dong and J. R. Qiu, J. Mater. Chem. C, 2015, 3, 5419–5429 RSC.
- Q. Y. Bai, P. L. Li, Z. J. Wang, S. C. Xu, T. Li, Z. P. Yang and Z. Xu, Spectrochim. Acta, Part A, 2018, 199, 179–188 CrossRef CAS.
- S. A. Zhang, Y. H. Hu, R. Chen, X. J. Wang and Z. H. Wang, Opt. Mater., 2014, 36, 1830–1835 CrossRef CAS.
- T. Meng, Z. F. Wang, T. Yuan, X. H. Li, Y. C. Li, Y. Zhang and L. Z. Fan, Angew. Chem., Int. Ed., 2021, 60, 16343–16348 CrossRef CAS PubMed.
- R. E. Rojas-Hernandez, F. Rubio-Marcos, I. Romet, A. del Campo, G. Gorni, I. Hussainova, J. F. Fernandez and V. Nagirnyi, Inorg. Chem., 2022, 61, 11886–11896 CrossRef CAS PubMed.
- L. Y. Li, F. Pan, P. A. Tanner and K. L. Wong, ACS Appl. Nano Mater., 2020, 3, 1961–1971 CrossRef CAS.
- R. L. Moreira and A. Dias, Mater. Res. Bull., 2019, 118, 8 CrossRef.
- M. M. Shang, G. G. Li, D. M. Yang, X. J. Kang, C. Peng, Z. Y. Cheng and J. Lin, Dalton Trans., 2011, 40, 9379–9387 RSC.
- Z. S. Liu, X. P. Jing and L. X. Wang, J. Electrochem. Soc., 2007, 154, H500–H506 CrossRef CAS.
- J. Dolado, R. Martínez-Casado, P. Hidalgo, R. Gutierrez, A. Dianat, G. Cuniberti, F. Domínguez-Adame, E. Díaz and B. Méndez, Acta Mater., 2020, 196, 626–634 CrossRef CAS.
- S. P. Wu, Z. L. Wang, X. Ouyang and Z. Q. Lin, Nanoscale, 2013, 5, 12335–12341 RSC.
- X. X. Duan, M. Yuan, K. Ou, W. B. Duan, L. X. Yi and X. Q. Zhang, Mater. Today Commun., 2020, 24, 9 Search PubMed.
- H. S. Chou, K. D. Yang, S. H. Xiao, R. A. Patil, C. C. Lai, W. C. V. Yeh, C. H. Ho, L. O. Yung and Y. R. Ma, Nanoscale, 2019, 11, 13385–13396 RSC.
- F. Urbach, Measurement Methods Meeting, Verinna, Austria, 1930, vol. 139, pp. 363–372 Search PubMed.
- P. Boutinaud, L. Sarakha and R. Mahiou, J. Phys.: Condens. Matter, 2009, 21, 6 CrossRef.
- X. P. Gao, Z. Y. Zhang, C. Wang, J. Xu, Z. H. Ju, Y. Q. An and W. S. Liu, J. Electrochem. Soc., 2011, 158, J405–J408 CrossRef CAS.
- J. L. Qin, H. R. Zhang, B. F. Lei, C. F. Hu, J. F. Li, Y. L. Liu, J. X. Meng, J. Wang, M. T. Zheng and Y. Xiao, J. Am. Ceram. Soc., 2013, 96, 3149–3154 CrossRef CAS.
- X. H. Xu, Y. H. Wang, X. Yu, Y. Q. Li and Y. Gong, J. Am. Ceram. Soc., 2011, 94, 24–27 CrossRef.
- F. Clabau, X. Rocquefelte, S. Jobic, P. Deniard, M. H. Whangbo, A. Garcia and T. Le Mercier, Chem. Mater., 2005, 17, 3904–3912 CrossRef CAS.
Footnote |
| † Electronic supplementary information (ESI) available. See DOI: https://doi.org/10.1039/d4tc04090b |
| This journal is © The Royal Society of Chemistry 2025 |