 Open Access Article
Machine learning application in municipal wastewater treatment to enhance the performance of a sequencing batch reactor wastewater treatment plant
Hagar H.
Hassan
 *
*
Department of Sanitary Engineering, Faculty of Engineering, Alexandria University, Alexandria, Egypt. E-mail: hagar.adel@hotmail.com; Tel: +201112272882
First published on 29th October 2024
Abstract
Municipal wastewater treatment plants (WWTPs) with sequencing batch reactors (SBRs) face many challenges due to organic shock load (OSL) flocculation caused by population growth and industrialization. Guaranteeing that effluent quality remains within regulatory limits is vital for environmental protection and public health. Using conventional methods for managing variations in OSL faces a lot of difficulties, specifically when it comes to accurately predicting the effluent quality that complies with regulatory standards. This study addressed this by integrating a machine learning (ML) model, to anticipate how varying OSL can affect the effluent quality of an operational SBR WWTP located in Egypt. The novelty of this research lies in using ML to predict the system's performance when applied to different OSL scenarios, showing a dynamic method for SBR optimization operations. Initial trials with OSL values of 2× and 1.6× the actual influent levels resulted in non-compliance with regulatory standards, whereas the optimal OSL was determined to be 1.3×. The study illustrates that the incorporation of ML into the process results in superior plant performance and greater decision-making amid variable settings, presenting an innovative approach for employing data-driven models in municipal wastewater treatment, and yielding fresh perspectives on the improvement of WWTP operations.
Environmental significanceThe use of machine learning (ML) in municipal wastewater treatment marks a significant step forward in managing fluctuating organic shock loading (OSL) in Sequencing Batch Reactor (SBR) systems. Predicting effluent quality under different influent conditions boosts the stability and efficiency of wastewater treatment plants (WWTPs). This study shows how ML models, particularly linear regression, can optimize the treatment process by keeping effluent quality within legal limits, even with increased OSL. By pinpointing the optimal influent load that maintains compliance, this research offers essential guidelines for plant operators, improving management practices, reducing environmental risks, and enhancing public health. The potential of ML to forecast and handle plant responses to organic load changes highlights its value for sustainable and effective wastewater management. |
Introduction
With the increase in population and industrialization, there is a substantial impact on the management of WWTPs1 due to the immense pressure to manage higher loads while maintaining treatment efficiency. In the field of wastewater treatment engineering, the key concern should be the environmental impact and public health.2 It is crucial to ensure that stringent regulatory standards are applied before wastewater is discharged into natural aquatic systems.3 One major challenge faced by WWTPs is the effect of OSL since a sudden increase in influent organic matter leads to the disruption of the entire treatment process4 and effluent quality noncompliance with regulatory standards.5Traditional methods for handling WWTPs are often based on empirical adjustments and manual involvement, which especially in dynamic contexts may not be so adaptive.6 This shows that there is a need for more sophisticated and adaptable alternatives, such as open-source programming, which can offer an effective solution for wastewater treatment operational problems with minimal effort and cost.7
This has increased attention to ML, which is a subset of artificial intelligence (AI) technologies, used in classifying patterns in complex data for prediction purposes with high accuracy.8 Integrating ML models in the field of wastewater treatment can provide plant operators with a more responsive and adaptive approach.9,10 This semi-supervised approach is capable of managing variations in the influent conditions while maintaining compliance with effluent regulatory standards.5 ML is already being successfully applied in environmental modeling, such as in predicting weather events and air quality.11
This research seeks to bridge the gap in this knowledge by employing ML tools to improve the performance of SBR WWTP effluent quality when applied to different OSL scenarios.12
The study also aimed to achieve the following specific objectives: firstly, to establish a model that can predict the acceptable effluent quality of an SBR WWTP that complies with effluent limitations; secondly, to specify the best OSL threshold while maintaining compliance with acceptable effluent limitations, without overloading the system; finally, to assess the performance and reliability of this developed model using influent and effluent data obtained from a real operational WWTP to ensure that the data are valid and confirm that the model is robust since it is based on real-world data.13,14
This research is a novel contribution because it applies a linear regression model, which is a supervised and simpler ML approach, to dynamically predict and optimize SBR WWTP performance under different OSL conditions. In contrast to prior studies that rely on complex and computationally expensive models, this study shows that linear regression models can be used effectively and deployed for real-time wastewater management. This approach helps plant operators by providing a more advanced tool for anticipating the impact of flocculating OSL on the effluent quality,15 providing more efficient solutions for maintaining regulatory compliance with minimal effort and less wasted time.16
Materials and methods
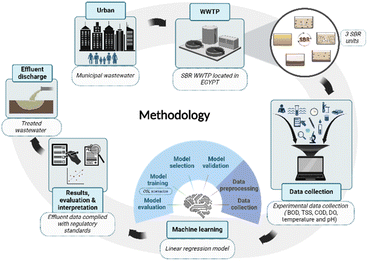
The overall flowchart adopted for this study methodology is shown in Fig. 1 including data collection, model evaluation, and validation. This overall workflow highlights each step in integrating a ML model for predicting effluent quality when applied to different OSLs. The experimental data were collected from an SBR unit of a WWTP located in Alagamy (Alexandria, Egypt).17 The plant is designed to treat municipal wastewater with an average influent flow rate of 50![[thin space (1/6-em)]](https://www.rsc.org/images/entities/char_2009.gif) 000 m3 per day. The WWTP used in this study is divided into three main units, and all are SBR biological processes, each with specific details as shown in Table 1.
000 m3 per day. The WWTP used in this study is divided into three main units, and all are SBR biological processes, each with specific details as shown in Table 1.
| First unit | Second unit | Third unit | ||
|---|---|---|---|---|
| Average influent flow rate (m3 per day) | 10![[thin space (1/6-em)]](https://www.rsc.org/images/entities/char_2009.gif) 000 000 |
10![[thin space (1/6-em)]](https://www.rsc.org/images/entities/char_2009.gif) 000 000 |
30![[thin space (1/6-em)]](https://www.rsc.org/images/entities/char_2009.gif) 000 000 |
|
| Number of SBR units | 2 | 5 | 4 | |
| Dimensions | V (m3) | 4167 | 2420 | 8333 |
| A (m2) | 970 | 484 | 1852 | |
| Depth (m) | 4.3 | 5.0 | 4.5 | |
| Cycle period (min) | Total | 360 | 570 | 480 |
| Fill | 90 | 140 | 120 | |
| Aeration | 135 | 220 | 180 | |
| Settle | 60 | 90 | 90 | |
| Decant | 60 | 90 | 60 | |
| Wastage | 15 | 30 | 30 | |
| Decant flow rate (m3 per cycle) | 1200 | 750 | ||
| Waste sludge flow rate (m3 per cycle) | 50 | 25 | 100 | |
The data collected from the SBR units included biochemical oxygen demand (BOD), total suspended solids (TSS), chemical oxygen demand (COD), dissolved oxygen (DO), temperature, and pH for both influent and effluent.17 These data were recorded over 90 weeks giving valuable details into the performance of the entire WWTP before any applied variations in OSL.
Throughout the entire 90 week period, over 500 samples were recorded for each parameter previously mentioned, and these samples were the basis for validation, training, and testing. The data were used as the core for integrating the machine learning model that was designed to predict and analyze the response of the SBR WWTP when applied to different operational conditions.17
The data were all collected directly from the WWTP and there were no external sources used for this phase of the study. Moreover, all effluent data were compared to the Egyptian environmental requirements18 shown in Table 2.
| Item | Max. limits of specifications (mg L−1) unless otherwise indicated |
| Temperature | 10 °C > average temperature of the receiving body |
| pH | 6–9 |
| COD (chemical oxygen demand) | 100 |
| BOD (biochemical oxygen demand) | 60 |
| Total suspended solids | 60 |
The main objective of the study is to integrate an ML model to predict the effluent quality of the SBR WWTP after applying varying OSL to improve the performance of the WWTP. The overall workflow involved collecting data, developing the model, evaluation, and validation. Pre-processing data were applied by cleaning any raw data to remove outliers and managing missing values with data analysis techniques.19 All parameters were normalized to ensure that they were uniform to assist in improving the model performance.20 Moreover, a linear regression model was created to predict the effluent quality of the plant, based on the influent data. The linear regression algorithm was selected due to its simplicity and efficiency in predicting the effluent data according to the input.21 Prior to linear regression selection, linear supervised algorithms were tested, including ridge and logistic regression, but the linear regression model gave the best outputs for the dataset applied. Mean absolute error (MAE) and R-squared (R2) techniques were used to avoid over-fitting22,23 and to ensure the accuracy of the model. Additionally, several graphs were created for further validation including the difference between actual and predicted effluent, a residual plot that compares the actual BOD values, and a regression plot with confidence intervals. These metrics and visualizations were very important to ensure that the model was not over-fitted and could further be applied to new data.21 This was done by controlling the shock loadings to confirm that the model was accurate and reliable. Furthermore, according to these acceptable predictions, more applications were done on the plant. Here, more OSLs were applied, along with testing the quality of effluent when compared to the acceptable regulatory standards in ref. 18 (Table 2).
Results and discussion
A linear regression model was developed and evaluated to predict the effluent quality of the SBR WWTP when varying the OSL influents. The key metrics and the techniques applied for validation were analyzed to ensure the accuracy and reliability of the performance of the model.For the validation of the model, cross validation was performed where the model yielded a mean squared error (MSE) of 1.4615 and a Root Mean Squared Error (RMSE) of 1.2063. These metrics indicate the average squared and absolute deviations of the effluent BOD from actual values, respectively. Moreover, the mean absolute percentage error (MAPE) was 0.1107, which shows the average percentage deviation of predictions from the actual values. Furthermore, the model had reached an MAE of 1.108 mg2 L−2. This represents the average squared difference between the actual and predicted BOD effluent values of the WWTP. The low value of MAE represents that the predictions of the trained model are accurate and also near the actual data of the SBR WWTP performance. Additionally, the trained model displayed an R2 value of 0.762, which means that approximately 76.2% of the effluent BOD variance data are explained by the model.
All these metrics suggest that the model will perform well in cross validation, where this demonstrates the robustness and effectiveness in the prediction of the effluent BOD from the SBR WWTP.
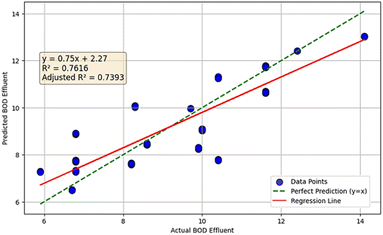
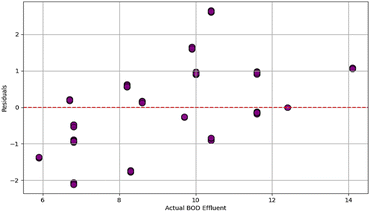
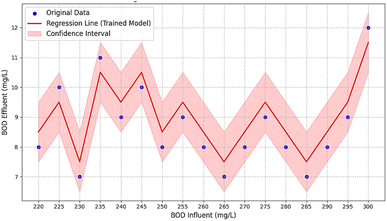
Three validation techniques were applied to prove that the model is working successfully. Firstly, a graph showing the alignment between actual and predicted effluent BOD values is presented (Fig. 2). Secondly, a residual plot demonstrates the residuals distributed around zero to indicate how the model is not over-fitted (Fig. 3). Finally, a regression plot with confidence intervals further validates the predictions of the model (Fig. 4).
Fig. 2 shows a comparison between the actual BOD effluent and the predicted effluent BOD from the trained linear regression model for the SBR WWTP. The green dashed line indicates a perfect prediction for the model, where every predicted value exactly matches the corresponding value accurately. This can be represented by eqn (1).24
| y = x | (1) |
The regression line shown in Fig. 2 represents the best linear fit for the actual data points as determined by the linear regression algorithm. This line is described as y = 0.75x + 2.27, where the slope “m” is 0.75 and the intercept “c” is 2.27. This equation demonstrates that with every increase in the actual effluent BOD, the predicted effluent BOD increases by 0.75 units from the beginning of an intercept of 2.27. As presented in the following equation shown in eqn (2),25 it minimizes the summation of residuals between actual and predicted values.
| y = mx + c | (2) |
The linear regression line shows the overall trend data captured by the linear model. The slope m represents the predicted effluent BOD with respect to changes in the actual effluent BOD.
Scattered points show the actual vs. the predicted effluent BOD values as seen in Fig. 2. Ideally, all points should lie exactly on the green dashed line for a perfect prediction. However, this will only mean an overly perfect answer, which means that the model fits the trained data extremely well. In other words, covering all the complexities, deviations, and noise is exactly what is called over-fitting.7 The main drawback of over-fitting is that while it can perform perfectly well on a trained model, it will perform poorly with a new model or any unseen data.26
The current model demonstrates a good balance between the spread of the scattered points and the regression line, with some deviations shown but not excessively. This spread of scattered points presents the variability in prediction and this indicates that the model captures all the underlying trend rather than the noise in the data.26,27 The R-squared value of 0.7616 and the adjusted R-squared value of 0.7393 imply that the model is capable of explaining a significant amount of variance in the actual effluent BOD data.
Although some of the scattered points deviate, the overall trend shown by the data in Fig. 2 indicates that the linear regression model captures the whole pattern of BOD effluent levels, which substantially means that the model is robust enough to predict the effluent quality and can manage further predictions of applied OSL in the SBR WWT.
The representation of the accuracy of the ML model for predicting the effluent BOD values28 is shown in Fig. 3. The x-axis indicates the actual BOD effluent values, while the y-axis shows the difference between the actual and predicted BOD values, which are called “residuals”. The red dashed line at the y-value indicates that the predictions perfectly match with the actual values.
The scattered residual points around the red dashed line presented in Fig. 3 have no obvious pattern, which signifies that the prediction errors of the model are biased in any specific direction.15 This demonstrates how the model is performing reliably. Since most of the residuals are in a close range between 2 and −2, this shows that the actual effluent BOD values are close to the predictions of the model and that it is performing accurately. Moreover, there are no curvatures in the residuals that prove that the residuals are consistent when compared to all actual BOD effluent values.
In the residual plot shown in Fig. 3, some of the values were more than 10 representing a suboptimal accuracy of the model. While considering that the deviation is not significant, the results suggest that it is not severely deviated and within the acceptable range. The residual plot is very important for proving the accuracy and reliability of the ML model.29
The residual plot displayed in Fig. 3 can predict the effluent BOD values for the SBR WWTP. Meanwhile, the residuals are around zero and no patterns are evident, demonstrating that the model has random errors without flaws in the model itself. Moreover, the small range of residuals shows that the model is accurate.
In Fig. 4, a detailed analysis of the predictive performance of the model is presented. This plot compares the predicted values produced by the trained ML model with the actual BOD effluent values of the SBE WWTP.
The blue dots demonstrate the values of actual effluent BOD from the SBR WWTP and the red line demonstrates the values of predicted effluent BOD by the trained ML model. Moreover, the close alignment of the red line with the blue dots as seen in Fig. 4 indicates that the model effectively captures the relationship between the values of influent and effluent BOD. Also, the shaded area around the regression line represents the confidence intervals that indicate the prediction uncertainty of the model. The narrow width of the confidence interval showed in most parts suggests high precision in the linear regression model's overall prediction.30
Despite a slight deviation between the actual and predicted values presented in Fig. 4, they still fall within an acceptable range.28 Consequently, the model appears to be reliable for further applications, including predicting outcomes under varying OSL to test the performance of the SBR WWTP.
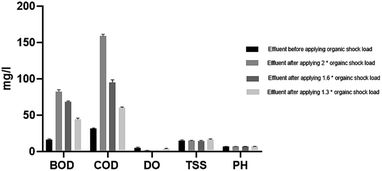
Afterwards, the model is applied to various scenarios of increasing the organic shock load for the SBR WWTP, and the resulting effluent in each scenario is compared with the Egyptian requirements outlined in Table 2. As shown in Fig. 5, before applying the OSL, it ranged from 15.36 to 17.90 mg L−1. After applying 2× OSL, the BOD effluent ranged from 75.34 to 85.83 mg L−1 and after applying 1.6× OSL, the BOD effluent shock load was from 65.49 to 69.91 mg L−1, and then for the last trial with 1.3× OSL, the effluent BOD ranged from 41.67 to 46.88 mg L−1.
For COD effluent, the values before applying the OSL ranged from 30.14 to 32.76 mg L−1 and after doubling the OSL, COD effluent data ranged from 162.31 to 154.28 mg L−1. After another trial of applying 1.6× OSL, the effluent was from 91.38 to 102.04 mg L−1 and in the last trial, effluent COD was from 58.65 to 61.63 mg L−1.
As for the TSS before applying OSL, it ranged from 13.58 to 16.65 mg L−1 and after doubling the OSL, it ranged from 13.1 to 15.8 mg L−1, while after applying 1.3× OSL, the effluent TSS ranged from 12.9 to 16.1 mg L−1. For the last trial, the effluent ranged from 15.13 to 17.56 mg L−1.
For the influent DO before applying the OSL, it ranged from 2.1 to 3.3 mg L−1, and for the 2× OSL, the effluent DO was 1.3 to 2.5 mg L−1 and for the 1.6× OSL, the effluent DO ranged from 1.9 to 2.4 mg L−1. For the last trial, it ranged from 2.2 to 3.4 mg L−1. As for pH in all cases, it was almost within the same range from 6.7 to 7.1.
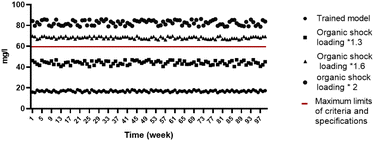
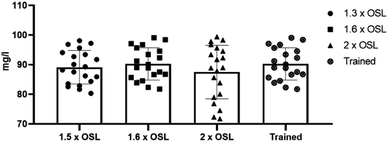
Fig. 6 shows the variation between values for all three trials including the trained model where the red line represents the maximum permissible limit according to Egyptian requirements. Generally, any effluent quality below the 60 mg L−1 threshold is considered acceptable. The output shows that for 2× the organic load the values were significantly higher than the threshold with approximately 80 mg L−1 while when decreasing the organic load to 1.6× BOD effluent values complied to the acceptable thershold.
Organic shock loading *1.3: although the increase in effluent quality is approaching the acceptable range, it is still below the threshold and thus permissible. Organic shock loading *1.6: the effluent quality is nearing the acceptable range but remains higher than the threshold, necessitating additional trials. Organic shock loading *2: the effluent quality is significantly above the acceptable range, indicating potential process failure.
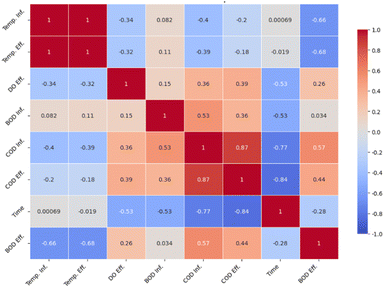
The correlation map presented in Fig. 7 shows a comprehensive view of the relationship between various influents and effluent parameters in the wastewater treatment process.31
The correlation coefficient of influent temperature (Temp. Inf.) is perfectly aligned with the effluent temperature (Temp. Eff.), showing a correlation value of 1.00. This denotes how the temperature remains constant in the entire treatment process. Moreover, Temp. Inf. has a negative correlation with effluent BOD (BOD Eff.) at −0.66 and effluent COD (COD Eff.) at −0.40. The results demonstrate that at higher temperatures the influent temperature can be associated with lower effluent BOD and COD levels.
For DO correlations in the influent DO (DO Inf.), the results show a weak negative correlation in the BOD Eff. at −0.32 and COD Eff. at −0.39. This represents a slight inverse correlation. As for the effluent DO (DO Eff.), it has a weak positive correlation when compared to BOD Eff. at 0.26 and COD Eff. at 0.39, and this shows that when effluent DO levels are high, they are associated with high BOD and COD levels.
The influent BOD (BOD Inf.) has a medium positive relationship with the COD Eff. at a value of 0.53, meaning that the higher the BOD Inf. levels, the higher the COD Eff. levels. Additionally, for BOD Eff., it has a medium positive relationship with COD Eff. at a value of 0.57, strengthening the connection between both parameters in the treatment process.
The influent COD (COD Inf.) has a strong positive relationship with COD Eff. at a value of 0.87, and this indicates the COD Inf. values have a substantial impact on effluent COD levels. COD Eff. has a high negative relationship with time (Time) at a value of −0.84, and this suggests that when the treatment takes longer times it will be associated with low effluent COD levels.
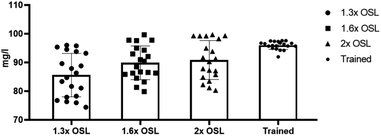
From the percentage of BOD removal shown in Fig. 8, the highest removal efficiency was achieved by the trained model, which ranged from 94% to 97%. When subjected to 2× and 1.6× OSLs, the removal efficiency decreased to a range of 80% to 97%. For the 1.3× shock load, the removal efficiency ranged from 75% to 98%. The decreased removal efficiency signifies that variability in rising organic loads can reduce the efficiency of BOD removal.
The trained model has the highest removal efficiency, ranging from 90% to 99% as shown in Fig. 9. Furthermore, regarding the 1.3× and 1.6× trials, the removal efficiency was approximately 88% to 85%. Subsequently, a decrease in the stability of the system under these conditions was observed. When doubling the organic load, the removal efficiency drops to 80%, demonstrating reduced performance for this trial.
Fig. 10 shows the removal efficiency for COD in all applied trials. For the trained model, the removal percent of TSS ranged from 95, it had the highest efficiency. Under the 2× and 1.6× organic loads, the COD range was from 85% to 95%, which is greater than that of the trained model. The last removal efficiency trail ranged from 71% to 96%. This indicates the stress of the system under increased OSL. Therefore, improving the performance of the system to handle such conditions is very important for optimal operation.
Conclusion
This study shows the significant role of ML in improving the performance of WWTPs, specifically when applied to different OSLs. A linear regression model was integrated from an SBR WWTP located in Egypt, and the study demonstrated that after several trials of increased levels of OSL, the optimal OSL threshold was 1.3 times the normal influent level. Effluent quality failed to meet the regulatory standards when exceeding this threshold, showing how ML can be practically applied to guide operational limits and process management. These results provide the operators of WWTPs with an essential predictive tool for reducing environmental risks and avoiding mechanical failures. The ability of the ML model to predict the effluent outcome when varying the OSL gives significance to the ML capabilities in offering substantial improvement in decision-making, and this leads to more effective strategical maintenance in WWTPs. By integrating predictive ML models, operators for the WWTPs can subsequently anticipate the potential performance issues that might affect the whole system, leading to plant optimization efficiency and also maintaining regulatory compliance under different OSL conditions. The study quantitatively supports the incorporation of ML into wastewater management, showing its potential for addressing real-world challenges in municipal wastewater treatment.Data availability
The code used for this study is private and cannot be shared. The data utilized in this research were collected from a real existing Sequencing Batch Reactor (SBR) wastewater treatment plant located in Alagamy, Alexandria, Egypt. Detailed experimental effluent and influent data, covering a period of 90 weeks, along with specific parameters and dimensions of the wastewater treatment plant, were used in this study. All effluent and influent data were collected from this plant. The modeling approach for this study references: Hassan H. H. Improving the performance of SBR WWTP under the effect of organic shock load using Stoat software. International Journal of Environmental Sciences & Natural Resources, 2019; 20(2), doi: https://doi.org/10.19080/ijesnr.2019.20.556035. Hassan, H. H. Improving the performance of an SBR WWTP under the effect of shock load using STOAT software. Master's thesis, Arab Academy for Science, Technology and Maritime Transport, Alexanderia, Egypt, 2019. The analysis was conducted using Python.Author contributions
The sole author of this paper, Hagar H. Hassan, was responsible for all aspects of the research, including the conceptualization, methodology, data collection, analysis, and writing of the manuscript.Conflicts of interest
There are no conflicts of interest to declare.References
- B. Adibimanesh, S. Polesek-Karczewska, F. Bagherzadeh, P. Szczuko and T. Shafighfard, Energy consumption optimization in wastewater treatment plants: Machine learning for monitoring incineration of sewage sludge, Sustain. Energy Technol. Assessments, 2023, 56, 103040, DOI:10.1016/j.seta.2023.103040.
- E. Aghdam, S. R. Mohandes, P. Manu, C. Cheung, A. Yunusa-Kaltungo and T. Zayed, Predicting quality parameters of wastewater treatment plants using artificial intelligence techniques, J. Clean. Prod., 2023, 405, 137019, DOI:10.1016/j.jclepro.2023.137019.
- Y. Alali, F. Harrou and Y. Sun, Unlocking the Potential of Wastewater Treatment: Machine Learning Based Energy Consumption Prediction, Water, 2023, 15, 2349, DOI:10.3390/w15132349.
- M. Bahramian, R. K. Dereli, W. Zhao, M. Giberti and E. Casey, Data to intelligence: The role of data-driven models in wastewater treatment, Expert Syst. Appl., 2023, 217, 119453, DOI:10.1016/j.eswa.2022.119453.
- V. Ganthavee and A. P. Trzcinski, Artificial intelligence and machine learning for the optimization of pharmaceutical wastewater treatment systems: a review, Environ. Chem. Lett., 2024, 22, 2293–2318, DOI:10.1007/s10311-024-01748-w.
- S. K. Bhagat, K. E. Pilario, O. E. Babalola, T. Tiyasha, M. Yaqub, C. E. Onu, K. Pyrgaki, M. W. Falah, A. H. Jawad, D. A. Yaseen, N. Barka and Z. M. Yaseen, Comprehensive review on machine learning methodologies for modeling dye removal processes in wastewater, J. Clean. Prod., 2023, 385, 135522, DOI:10.1016/j.jclepro.2022.135522.
- T. C. Ekundayo, M. A. Adewoyin, O. A. Ijabadeniyi, E. O. Igbinosa and A. I. Okoh, Machine learning-guided determination of Acinetobacter density in waterbodies receiving municipal and hospital wastewater effluents, Sci. Rep., 2023, 13 DOI:10.1038/s41598-023-34963-6.
- M. A. P. Cechinel, J. Neves, J. V. R. Fuck, R. C. De Andrade, N. Spogis, H. G. Riella, N. Padoin and C. Soares, Enhancing wastewater treatment efficiency through machine learning-driven effluent quality prediction: A plant-level analysis, J. Water Proc. Eng., 2024, 58, 104758, DOI:10.1016/j.jwpe.2023.104758.
- A. Elsayed, M. Ghaith, A. Yosri, Z. Li and W. El-Dakhakhni, Genetic programming expressions for effluent quality prediction: Towards AI-driven monitoring and management of wastewater treatment plants, J. Environ. Manage., 2024, 356, 120510, DOI:10.1016/j.jenvman.2024.120510.
- N. Khatri, K. K. Khatri and A. Sharma, Prediction of effluent quality in ICEAS-sequential batch reactor using feedforward artificial neural network, Water Sci. Technol., 2019, 80, 213–222, DOI:10.2166/wst.2019.257.
- N. E. El-Attar, H. R. Lotfy and W. A. Awad, Performance of Artificial Intelligence Models in Analysis and Prediction of Water Potability, 2022 Search PubMed.
- M. S. Hamada, H. A. Zaqoot and W. A. Sethar, Using a supervised machine learning approach to predict water quality at the Gaza wastewater treatment plant, Environ. Sci.: Adv., 2024, 3, 132–144, 10.1039/d3va00170a.
- N. Khatri, A. K. Vyas, A. S. H. Abdul-Qawy and E. R. Rene, Artificial neural network based models for predicting the effluent quality of a combined upflow anaerobic sludge blanket and facultative pond: Performance evaluation and comparison of different algorithms, Environ. Res., 2022, 217, 114843, DOI:10.1016/j.envres.2022.114843.
- F. Granata, S. Papirio, G. Esposito, R. Gargano and G. De Marinis, Machine Learning Algorithms for the Forecasting of Wastewater Quality Indicators, Water, 2017, 9, 105, DOI:10.3390/w9020105.
- N. K. Singh, M. Yadav, V. Singh, H. Padhiyar, V. Kumar, S. K. Bhatia and P. L. Show, Artificial intelligence and machine learning-based monitoring and design of biological wastewater treatment systems, Bioresour. Technol., 2023, 369, 128486, DOI:10.1016/j.biortech.2022.128486.
- N. Khatri, K. K. Khatri and A. Sharma, Artificial neural network modelling of faecal coliform removal in an intermittent cycle extended aeration system-sequential batch reactor based wastewater treatment plant, J. Water Proc. Eng., 2020, 37, 101477, DOI:10.1016/j.jwpe.2020.101477.
- H. H. Hassan, Improving the Performance of SBR WWTP under the Effect of Organic Shock Load using Stoat Software, Int. J. Environ. Sci. Nat. Resour., 2019, 20, 556035, DOI:10.19080/ijesnr.2019.20.556035.
- Ministry of Housing, Utilities and Urban Communities, Egyptian Code for Design and Execution Requirements of Water Treatment Plants, Sewage Treatment Plants, and Pump Stations, Housing and Building National Research Center, Cairo, Egypt, 2017 Search PubMed.
- M. Khalil, A. AlSayed, Y. Liu and P. A. Vanrolleghem, Machine learning for modeling N2O emissions from wastewater treatment plants: Aligning model performance, complexity, and interpretability, Water Res., 2023, 245, 120667, DOI:10.1016/j.watres.2023.120667.
- M. Lai, S. S. Wulff, Y. Cao, T. J. Robinson and R. Rajapaksha, An interpretable time series machine learning method for varying forecast and nowcast lengths in wastewater-based epidemiology, MethodsX, 2023, 11, 102382, DOI:10.1016/j.mex.2023.102382.
- N. Nomanifar, M. Davoudi, A. Ghorbanian, A. A. Najafpoor and A. Hosseinzadeh, Fe recovery from drinking water treatment sludge for reuse in tannery wastewater treatment: Machine learning and statistical modelling, J. Water Proc. Eng., 2024, 60, 105224, DOI:10.1016/j.jwpe.2024.105224.
- R. Mathur, M. K. Sharma, K. Loganathan, M. Abbas, S. Hussain, G. Kataria, M. S. Alqahtani and K. Srinivas Rao, Modeling of two-stage anaerobic onsite wastewater sanitation system to predict effluent soluble chemical oxygen demand through machine learning, Sci. Rep., 2024, 14, 1835, DOI:10.1038/s41598-023-50805-x.
- M. Gholizadeh, R. Saeedi, A. Bagheri and M. Paeezi, Machine learning-based prediction of effluent total suspended solids in a wastewater treatment plant using different feature selection approaches: A comparative study, Environ. Res., 2024, 246, 118146, DOI:10.1016/j.envres.2024.118146.
- W. E. Odiete, Novel pollution prevention process for regulating industrial wastewater for better protection of the environment and public health, Heliyon, 2024, 10, e25308, DOI:10.1016/j.heliyon.2024.e25308.
- A. D. Sakti, J. N. Mahdani, C. Santoso, K. T. N. Ihsan, A. Nastiti, Z. Shabrina, M. Safira, F. Rohmat, F. Yulianto and R. Virtriana, Optimizing city-level centralized wastewater management system using machine learning and spatial network analysis, Environ. Technol. Innovat., 2023, 32, 103360, DOI:10.1016/j.eti.2023.103360.
- M. A. Saleem, F. Harrou and Y. Sun, Explainable machine learning methods for predicting water treatment plant features under varying weather conditions, Results Eng., 2024, 21, 101930, DOI:10.1016/j.rineng.2024.101930.
- S. Shao, D. Fu, T. Yang, H. Mu, Q. Gao and Y. Zhang, Analysis of Machine Learning Models for Wastewater Treatment Plant Sludge Output Prediction, Sustainability, 2023, 15, 13380, DOI:10.3390/su151813380.
- H. Y. Shyu, C. J. Castro, R. A. Bair, Q. Lu and D. H. Yeh, Development of a Soft Sensor Using Machine Learning Algorithms for Predicting the Water Quality of an Onsite Wastewater Treatment System, ACS Environ. Au, 2023, 3, 308–318, DOI:10.1021/acsenvironau.2c00072.
- S. Tasneem, A. A. Ageeli, W. M. Alamier, N. Hasan and M. R. Safaei, Organic catalysts for hydrogen production from noodle wastewater: Machine learning and deep learning-based analysis, Int. J. Hydrogen Energy, 2024, 52, 599–616, DOI:10.1016/j.ijhydene.2023.07.114.
- Y. C. Wirasembada, B. Shin, J. Shin, A. Kurniawan and J. Cho, Effects of sudden shock load on simultaneous biohythane production in two-stage anaerobic digestion of high-strength organic wastewater, Bioresour. Technol., 2024, 394, 130186, DOI:10.1016/j.biortech.2023.130186.
- J. Yu, Y. Tian, H. Jing, T. Sun, X. Wang, C. B. Andrews and C. Zheng, Predicting Regional Wastewater Treatment Plant Discharges Using Machine Learning and Population Migration Big Data, ACS EST Water, 2023, 3, 1314–1328, DOI:10.1021/acsestwater.2c00639.
| This journal is © The Royal Society of Chemistry 2025 |

