Theoretical understanding of the in-plane tensile strain effects on enhancing the ferroelectric performance of Hf0.5Zr0.5O2 and ZrO2 thin films†
Kun Hee
Ye
ab,
Taeyoung
Jeong
ab,
Seungjae
Yoon
 ab,
Dohyun
Kim
 ab,
Cheol Seong
Hwang
 *b and
Jung-Hae
Choi
 *a
*a
aElectronic Materials Research Center, Korea Institute of Science and Technology, Seoul 02792, Korea. E-mail: choijh@kist.re.kr; Fax: +82 2 958 6658; Tel: +822 958 5488
bDepartment of Materials Science and Engineering and Inter-University Semiconductor Research Center, Seoul National University, Seoul 08826, Korea. E-mail: cheolsh@snu.ac.kr; Fax: +82 2 884 1413; Tel: +822 880 7535
First published on 12th November 2024
Abstract
In-plane tensile strain was reported to enhance the ferroelectricity of Hf1−xZrxO2 thin films by promoting the formation of a polar orthorhombic (PO-) phase. However, its origin remains yet to be identified unambiguously, although a strain-related thermodynamic stability variation was reported. This work explores the kinetic effects that have been overlooked to provide a precise answer to the problem, supplementing the thermodynamic calculations. The in-plane strain-dependent phase fractions were identified by calculating the relative influences of the thermodynamic factor (Boltzmann distribution of free energies of polymorphs) and the kinetic factor (transition rate between polymorphs using the Johnson–Mehl–Avrami equation). The monoclinic (M-) phase constitutes the ground state under almost all conditions. However, its formation is kinetically suppressed by the high activation barrier for the transition from the tetragonal (T-) phase. In contrast, PO-phase formation is dominated by thermodynamic effects and is promoted under in-plane tensile strain due to the energetic stabilization of the PO-phase, while the T- to PO-phase transition is kinetically probable due to a low activation barrier. The in-plane tensile strain also lowers the activation barrier of T → M. Hence, the optimal tensile strain for PO-phase formation varies depending on the thermal conditions. The remanent polarization was calculated using spontaneous polarization and the PO-phase fraction. The in-plane tensile strain of 2–2.5% and moderate annealing at approximately 700 K were optimum for increasing ferroelectricity by 34% in Hf0.5Zr0.5O2 and 106% in ZrO2 along the 〈111〉 orientation.
Introduction
Ferroelectric Hf1−xZrxO2 (HZO) thin films draw significant attention for their applications in complementary metal–oxide-semiconductor (CMOS) compatible semiconductor memory.1,2 Ferroelectricity in HZO thin films originates from the metastable Pca21 polar orthorhombic (PO-) phase, and field-induced ferroelectric characteristics in Zr-rich HZO thin films manifest through the phase transition between the metastable P42/nmc tetragonal (T-) phase and the PO phase.3–6 Therefore, promoting the formation of metastable phases while suppressing the ground state P21/c monoclinic (M-) phase is desirable for memory applications. Over the past decades, this issue has been the subject of extensive research in academia and industry, where the thin film composition and growth steps were examined. Besides, the HZO thin films on electrodes/substrates generally involve strains of diverse origins, including intrinsic growth and extrinsic thermal strains. It was recently reported that in-plane tensile strain substantially enhances ferroelectricity in HZO thin films. Kim et al. demonstrated that increasing in-plane tensile stress through thicker TiN electrodes enhances the remanent polarization (Pr) in polycrystalline Hf0.5Zr0.5O2.7 Similarly, Y. Goh et al. reported increasing Pr of polycrystalline Hf0.5Zr0.5O2 under thermal tensile stress from heat treatment by adopting different electrodes.8 An increase in ferroelectricity under tensile strain was also observed in epitaxial Hf0.5Zr0.5O2 on (La,Sr)MnO3.9 Therefore, strain control is crucial in achieving high performance.Another essential research area is the theoretical understanding of the strain effects on ferroelectricity by density functional theory (DFT) calculations. The primary target of DFT calculations is to calculate the thermodynamic free energy of HZO polymorphs, considering the contributions from the surface energy.10 However, the surface effects alone cannot thermodynamically stabilize the PO phase. Several recent DFT studies also considered the effects of in-plane strain on the thermodynamic stability of various polymorphs. However, the conclusions remain controversial. For example, Materlik et al. reported that {001} plane-oriented PO-phase Hf0.5Zr0.5O2 could be stabilized under ∼8 GPa compressive stress from their DFT study,11 while the experimental results generally indicated destabilization under compressive stress.12,13
Several works reported the phase stability of 〈111〉 oriented HfO2.14–16 The M-(![[1 with combining macron]](https://www.rsc.org/images/entities/char_0031_0304.gif) 11) and M-(111) planes were reported to be stable under in-plane compressive and tensile strain, respectively, indicating that the PO-phase formation is impossible even under strain.14 Therefore, previous theoretical studies on the effects of in-plane strain in HZO have not fully explained the increase in ferroelectricity under in-plane tensile strain in the experiments. Such a discrepancy may arise from considering only the free energy of the HZO polymorphs and neglecting the kinetic effects of the transition between them, implying that the consideration of the transition barrier between the polymorphs is essential for understanding the formation of the PO phase under in-plane strain.
11) and M-(111) planes were reported to be stable under in-plane compressive and tensile strain, respectively, indicating that the PO-phase formation is impossible even under strain.14 Therefore, previous theoretical studies on the effects of in-plane strain in HZO have not fully explained the increase in ferroelectricity under in-plane tensile strain in the experiments. Such a discrepancy may arise from considering only the free energy of the HZO polymorphs and neglecting the kinetic effects of the transition between them, implying that the consideration of the transition barrier between the polymorphs is essential for understanding the formation of the PO phase under in-plane strain.
On the other hand, the authors’ recent work elucidated the phase formation on the general thermal process of thin film HZO during atomic layer deposition (ALD): crystallization from amorphous → phase transition and annealing → phase transition during cooling.17 The phase fractions were calculated using the Boltzmann distribution of thermodynamic free energy of polymorphs and the kinetic activation barrier based on the Johnson–Mehl–Avrami (JMA) equation, respectively. The quantitative phase fractions were calculated as a function of Zr content (x), annealing temperature, and grain size, consistent with the experimental results, thus validating the robustness of this methodology. Nonetheless, the strain effect has not been considered in previous studies. Therefore, this study investigates the effects of in-plane strain on the phase fractions of Hf0.5Zr0.5O2 and ZrO2 by taking the strain term into theoretical consideration. A comprehensive analysis of the in-plane strain-dependent free energy and activation barrier shows that the PO phase is preferred under tensile strain. In addition, optimal ranges for the in-plane tensile strain and annealing temperature are proposed where the PO-phase fraction and polarization are maximized. Therefore, this study is expected to contribute to optimizing the electrical properties of HZO through in-plane strain engineering.
Method
DFT calculations were performed by using the Vienna Ab initio Simulation Package (VASP)18,19 using the local density approximation (LDA)20,21 with Blöchl's projector augmented wave approach.22,23 The valence electrons of Hf (5p65d36s1), Zr (4s24p64d35s1), and O (2s22p4) were considered in pseudopotentials. A plane-wave basis cutoff energy of 600 eV was adopted, and k-point meshes of Γ-centered 8 × 8 × 8 were sampled for the conventional unit cell of T-, PO-, and M-phases. The lattice constants and atomic coordinates were allowed to relax until the Hellmann–Feynman forces were below 0.02 eV Å−1.To estimate the energetic stability of Hf0.5Zr0.5O2 and ZrO2 polymorphs under in-plane strain, the 〈111〉 orientations were determined as the out-of-plane direction. Biaxial in-plane strain was then applied to {111} planes, with the lattice constants and angles of in-plane directions fixed, while the out-of-plane lattice parameter and angle were allowed to relax freely. The vibration-free energies of the strained structures were calculated using phonopy via the finite displacement method, enabling the calculation of Helmholtz free energy.24 The 96-atom structures (2 × 2 × 2 supercells) were used for the M- and PO-phases. In the case of the T-phase, the supercell having 216 atoms was utilized to remove the computationally generated imaginary frequency under in-plane strain. The primitive T-phase was expanded by the matrix operation of  . The surface energy was computed using the slabs of 8 layers with a vacuum region thicker than 10 Å. For the slab structures, the k-point meshes of Γ-centered 6 × 6 × 1 were used. Several surface energies of the PO phase may not converge due to the polarity of the PO phase. Thus, the antipolar orthorhombic (AO-) phase, composed of two PO phases with opposite dipole moments, was employed to replace the surface energy of the PO phase. The in-plane strain-dependent spontaneous polarizations (Ps) of the PO phase were calculated through the Berry phase method by considering the polarization quantum.25,26
Results and discussion
In-plane strain effects on the thermodynamic free energy
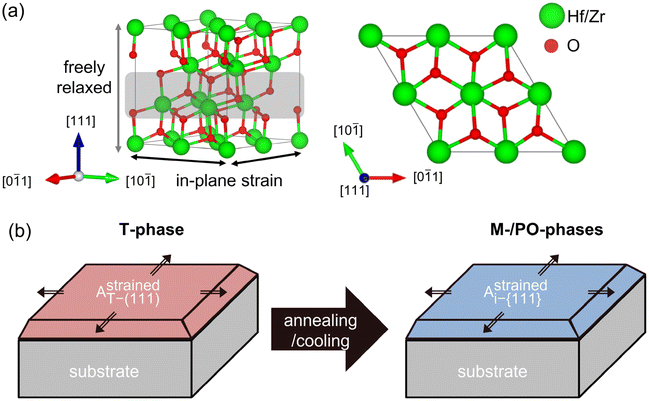
The 〈111〉 orientations were set to the out-of-plane direction because {111} planes were reported to have the lowest surface energy in all the HZO polymorphs.10,17,27Fig. 1(a) shows the cell structure used in the calculations, composed of 12 Hf/Zr and 24 O atoms along the 〈111〉 orientation. The gray shade region has 4 cations and 8 anions and is regarded as one layer along 〈111〉.Table 1 shows the lattice constants, unit cell volume (V), and bulk internal energy (Ei,bulk). The subscript i indicates a particular phase of the T-, PO-, and M-phases in Hf0.5Zr0.5O2 and ZrO2 – the major phases observed in experiments. Therefore, only these phases are considered in this study. Regardless of the Zr fraction, the M-phase was identified as the ground state in the equilibrium bulk state. The lattice parameters of Hf0.5Zr0.5O2 were determined using Vegard's law between HfO2 and ZrO2, consistent with previous studies.11,17
| Hf0.5Zr0.5O2 | a (Å) | b (Å) | c (Å) | V (Å3) | E i,bulk (meV per f.u.) |
|---|---|---|---|---|---|
| T | 5.01 | — | 5.09 | 127.72 | 0 |
| PO | 5.19 | 4.99 | 5.01 | 129.60 | −39 |
| M | 5.06 | 5.16 | 5.22 | 134.16 | −83 |
| ZrO2 | a (Å) | b (Å) | c (Å) | V (Å3) | E i,bulk (meV per f.u.) |
|---|---|---|---|---|---|
| T | 5.03 | — | 5.11 | 129.52 | 0 |
| PO | 5.22 | 5.02 | 5.03 | 131.77 | −10 |
| M | 5.09 | 5.19 | 5.24 | 136.34 | −49 |
Fig. 1(b) shows the schematic diagram showing the transition from the T- to other phases (M- or PO-phase) during heat treatment, representing the experimental observations. The T-phase crystallizes from amorphous Hf0.5Zr0.5O2 and ZrO2, so other polymorphs are formed from the T-phase after subsequent annealing and cooling steps.10,17,28 Therefore, it was assumed that the in-plane strain of the (111) plane of the T-phase induced by the substrate remains on the {111} plane of any i-phase transformed from the T-phase. This assumption indicates that the in-plane area of the {111} plane for any i-phase (Astrainedi-{111}) remained unvaried at the value of the (111) plane of the T-phase (AstrainedT-(111)) even after phase transition. The in-plane strain of the {111} plane, ε{111}, was determined by Astrainedi-{111} (= AstrainedT-(111)) and the equilibrium in-plane area of the (111) plane of the T-phase (AequilT-(111)) was determined using eqn (1). Therefore, the strain-free state is the ground state of the T-phase in this study.
 | (1) |
The ε{111} along the two orthogonal directions on the {111} plane was assumed to be identical. The ε{111} was used in all the calculations and ultimately served as the critical parameter for calculating the phase fractions throughout this study. The details on the strain conditions for all the polymorphs were investigated and are shown in Fig. S1.†
The free energy of HZO grains (Fi,grain) was calculated for all polymorphs, considering ε{111}, as well as the temperature (T) and grain diameter (dT):
 | (2) |
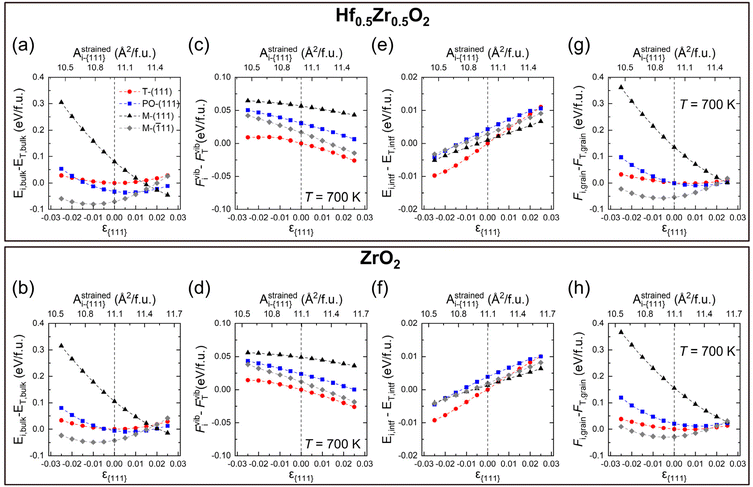
Eqn (2) comprises the strain-dependent internal energy (Ei,bulk(ε{111})), free energy related to phonon vibration (Fvibi(ε{111},T)), and interface energy of grains (Ei,intf(ε{111},dT)). The ε{111} range was set to −0.025 to 0.025, following the frequently reported value in experiments.12,29Fig. 2(a)–(f) show each term on the right side of eqn (2) – Ei,bulk, Fvibi, and Ei,intf of the T-(111), PO-(111), M-(111), and M-(![[1 with combining macron]](https://www.rsc.org/images/entities/char_0031_0304.gif) 11) oriented grains. Fig. 2(g) and (h) show their sum, Fi,grain, for Hf0.5Zr0.5O2 (upper panel) and ZrO2 (lower panel), respectively. The energies were all calculated as a function of ε{111} (lower x-axis) and Astrainedi-{111} (upper x-axis).
11) oriented grains. Fig. 2(g) and (h) show their sum, Fi,grain, for Hf0.5Zr0.5O2 (upper panel) and ZrO2 (lower panel), respectively. The energies were all calculated as a function of ε{111} (lower x-axis) and Astrainedi-{111} (upper x-axis).
Among the three energy terms, Ei,bulk contributes the most to Fi,grain for both Hf0.5Zr0.5O2 and ZrO2, as shown in Fig. 2(a) and (b), and the M-(![[1 with combining macron]](https://www.rsc.org/images/entities/char_0031_0304.gif) 11) grain generally has the lowest Ei,bulk. In addition, M-(
11) grain generally has the lowest Ei,bulk. In addition, M-(![[1 with combining macron]](https://www.rsc.org/images/entities/char_0031_0304.gif) 11) is stabilized under compressive ε{111}, while M-(111) is generally favored under tensile ε{111} due to its difference in the equilibrium in-plane area, as shown in Table 2. The differences of Ei,bulk among polymorphs are lower under tensile ε{111} rather than under compressive ε(111), indicating that the phase stability under tensile ε{111} might be delicately affected by other factors, such as Fvibi and Ei,intf.
11) is stabilized under compressive ε{111}, while M-(111) is generally favored under tensile ε{111} due to its difference in the equilibrium in-plane area, as shown in Table 2. The differences of Ei,bulk among polymorphs are lower under tensile ε{111} rather than under compressive ε(111), indicating that the phase stability under tensile ε{111} might be delicately affected by other factors, such as Fvibi and Ei,intf.
| Phase | A equili-{111} (Å2 per f.u.) | |
|---|---|---|
| Hf0.5Zr0.5O2 | ZrO2 | |
| T-(111) | 10.98 | 11.09 |
| PO-(111) | 11.09 | 11.22 |
| M-(111) | 12.02 | 12.15 |
M-(![[1 with combining macron]](https://www.rsc.org/images/entities/char_0031_0304.gif) 11) 11) |
10.75 | 10.87 |
The Fvibi values of Hf0.5Zr0.5O2 and ZrO2 at 700 K, the normal annealing temperature, tend to decrease slightly as ε{111} increases, as shown in Fig. 2(c) and (d). Nevertheless, their relative magnitude among the polymorphs does not change over the investigated ε{111} range. The effects of the annealing temperature on Fvibi in Hf0.5Zr0.5O2 and ZrO2 are summarized in Fig. S2.† They commonly showed an identical tendency of gradually decreasing Fvibi with increasing temperature due to phonon softening, irrespective of the phase and ε{111}. Nonetheless, the Fvibi of the T-phase has the lowest value, which coincides with the preference for the T-phase at high temperatures. For the Fvibi calculations on the individual strained structures, only the quasi-harmonic effects were taken into account. Based on a previous report, the energy change considering the anharmonic effects was about 10−3 eV per f.u. for ZrO2 at 300–700 K.30 For Hf0.5Zr0.5O2 polymorphs, the cation configuration was assumed to be identical to that of the primitive T-phase structure (2 Hf/Zr and 4 O atoms). It was based on the fact that the cation configuration hardly affects the mixing energy17 and Fvibi (Fig. S3 of the ESI†) in Hf0.5Zr0.5O2.
On the other hand, the variation of Ei,intf with ε{111} variation is an order of magnitude smaller compared to Ei,bulk and Fvibi for both Hf0.5Zr0.5O2 and ZrO2, as shown in Fig. 2(e) and (f). Previous studies reported that the interface energy per area (γi,intf) is calculated to be 0.33–0.5 times the surface energy.31–34 Thus, to estimate the ε{111}-dependent Ei,intf, γi,intf was assumed to be 0.4 times the surface energy of the {111} plane (γi,{111}), and the ε(111)-dependent γi,{111} is shown in Fig. S4.† The film thickness was set to 10 nm and assumed to be equal to dT, which was converted from the volume of the spherical T-phase (VT) [ ]. Hence, the Ei,intf(ε{111},dT) was calculated by using the formula – γi,intf × 4π(dT/2)2. The interface in this study includes the interface between amorphous and crystalline phases, the interface between different phases, and grain boundaries in polycrystalline structures. Since the contribution of Ei,intf on Fi,grain is much smaller than those of Ei,bulk and Fvibi, the effect of Ei,intf on the phase stability will be minimal. Finally, Fi,grain values at T = 700 K in Hf0.5Zr0.5O2 and ZrO2 (shown in Fig. 2(g) and (h)) show that the T-phase is stabilized in the tensile ε{111} ranges. Fi,grain values at T = 1000 K shown in Fig. S5† also present a similar tendency.
In this study, the LDA functional was used because the average surface energy of the T-phase was calculated to be lower than that of the M-phase, which is consistent with the experimental observations.2,3,31,35 In contrast, several studies utilized the Perdew–Burke–Ernzerhof (PBE)10,16 or PBEsol functional.36–38 Nevertheless, the overall bulk energetic trends were similar between the LDA and PBEsol functionals, as shown in Fig. S6.†
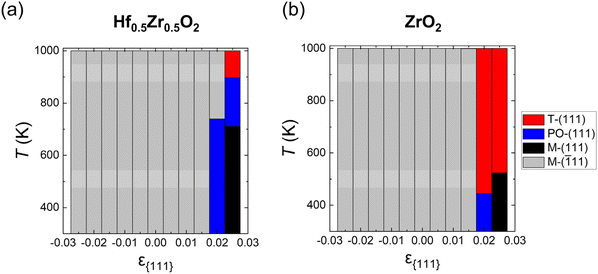
Fig. 3(a) and (b) show the ground state distributions of Hf0.5Zr0.5O2 and ZrO2 as a function of ε{111} in a temperature range of 300–1000 K when dT is 10 nm. The red, blue, black, and gray regions indicate that the T-(111), PO-(111), M-(111), and M-(![[1 with combining macron]](https://www.rsc.org/images/entities/char_0031_0304.gif) 11) oriented grains have the lowest Fi,grain under the given ε{111} and temperature conditions, respectively. In both Hf0.5Zr0.5O2 and ZrO2, the M-(
11) oriented grains have the lowest Fi,grain under the given ε{111} and temperature conditions, respectively. In both Hf0.5Zr0.5O2 and ZrO2, the M-(![[1 with combining macron]](https://www.rsc.org/images/entities/char_0031_0304.gif) 11) grain was the most stable at ε{111} of −0.025 to 0.015, irrespective of the temperature. In Hf0.5Zr0.5O2 at ε{111} of 0.02, the PO-(111) grain had the lowest Fi,grain up to 740 K. At higher temperatures, the M-(
11) grain was the most stable at ε{111} of −0.025 to 0.015, irrespective of the temperature. In Hf0.5Zr0.5O2 at ε{111} of 0.02, the PO-(111) grain had the lowest Fi,grain up to 740 K. At higher temperatures, the M-(![[1 with combining macron]](https://www.rsc.org/images/entities/char_0031_0304.gif) 11) grain was preferred due to its lower Fvibi than those of PO-(111) and M-(111) despite the high Ei,bulk of M-(
11) grain was preferred due to its lower Fvibi than those of PO-(111) and M-(111) despite the high Ei,bulk of M-(![[1 with combining macron]](https://www.rsc.org/images/entities/char_0031_0304.gif) 11). At ε{111} of 0.025, the most stable phase changes in the following order: M-(111), PO-(111), and T-(111) as temperature increases. In ZrO2 at ε{111} of 0.02 and 0.025, on the other hand, the PO-(111) and M-(111) grains were stable at lower temperatures, respectively, but the T-(111) grains became stabilized as the temperature increased. The variations in thermodynamic stability with temperature implied the significance of Fvibi, suggesting that the annealing temperature is expected to affect the phase formation of HZO. Overall, the calculation based on the thermodynamic energy indicates that the M-(
11). At ε{111} of 0.025, the most stable phase changes in the following order: M-(111), PO-(111), and T-(111) as temperature increases. In ZrO2 at ε{111} of 0.02 and 0.025, on the other hand, the PO-(111) and M-(111) grains were stable at lower temperatures, respectively, but the T-(111) grains became stabilized as the temperature increased. The variations in thermodynamic stability with temperature implied the significance of Fvibi, suggesting that the annealing temperature is expected to affect the phase formation of HZO. Overall, the calculation based on the thermodynamic energy indicates that the M-(![[1 with combining macron]](https://www.rsc.org/images/entities/char_0031_0304.gif) 11) grain is thermodynamically stable over most of the ε{111} ranges, whereas the PO-(111) grain is preferred only in a narrow range of tensile ε{111}. However, the PO-phase was primarily observed in various in-plane strain ranges in experiments,12,29 implying that the kinetic effect plays a crucial role in the phase formation of HZO.
11) grain is thermodynamically stable over most of the ε{111} ranges, whereas the PO-(111) grain is preferred only in a narrow range of tensile ε{111}. However, the PO-phase was primarily observed in various in-plane strain ranges in experiments,12,29 implying that the kinetic effect plays a crucial role in the phase formation of HZO.
In-plane strain effects on the kinetic activation barrier of the phase transition
This section describes the ε{111}-dependent activation barrier of the phase transition to examine the kinetic effects on the transitions from the T-phase to the M- and PO-phases. Fig. 4(a) provides the schematic diagram outlining the calculation of the nucleation activation barriers of the M- or PO-phase in the T-phase (Ea,nuc(T → M) or Ea,nuc(T → PO)). Since the activation barrier for growth is significantly lower than that for nucleation,17 only the nucleation activation barrier is considered in this study. Following the previous study, the Ea,nuc was determined by the energy difference between the 3 × 3 × 3 supercell composed solely of the T-phase and that containing a 1 × 1 × 1 M- or PO-phase within the 3 × 3 × 3 T-phase.17 The 3-coordinated O ions of M- and PO-phases were fixed to maintain the atomic structures. The energy profiles during the nucleation determined by the nudged elastic band method are shown in Fig. S7.†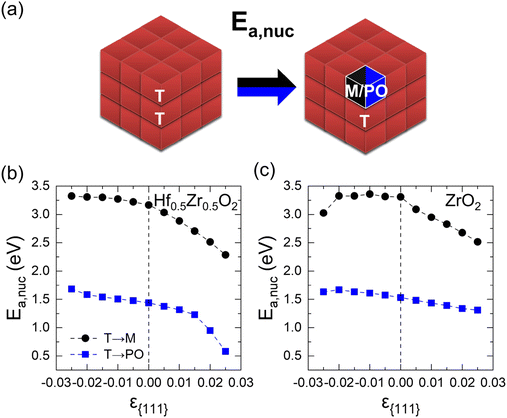 | ||
| Fig. 4 (a) Schematics of Ea,nuc from the T- to M or PO-phase. The ε{111}-dependent Ea,nuc(T → M) and Ea,nuc(T → PO) of (b) Hf0.5Zr0.5O2 and (c) ZrO2. | ||
Fig. 4(b) and (c) show the ε{111}-dependent Ea,nuc(T → M) and Ea,nuc(T → PO) in Hf0.5Zr0.5O2 and ZrO2, respectively. In all ε{111} ranges, Ea,nuc(T → M) is significantly higher than Ea,nuc (T → PO), suggesting that the phase transition from the T-phase to the M-phase is kinetically suppressed than that to the PO-phase.
Under a tensile ε{111} of 0.025, Ea,nuc(T → M) and Ea,nuc(T → PO) decrease by 0.89 eV and 0.85 eV in Hf0.5Zr0.5O2, and 0.79 eV and 0.22 eV in ZrO2, respectively. Under compressive ε{111}, on the other hand, Ea,nuc increases only marginally. The variations in Ea,nuc with ε{111} could be related to the unit cell volume change. As presented in Fig. S8,† the unit cell volumes of polymorphs in Hf0.5Zr0.5O2 and ZrO2 increase (decrease) as ε{111} increases (decreases). Since the equilibrium unit cell volumes of the M- and PO-phases are larger than that of the T-phase, the PO- and M-phases can be more stabilized under tensile ε{111}. Thus, the tensile ε{111} results in smaller Ea,nuc values.
In-plane strain effects on the phase fraction
Amorphous HZO is generally formed in the ALD process, and subsequent heat treatment is required for crystallization. The crystallized fraction of the i-phase from amorphous (Ci,crystn) could be calculated from its crystallization barrier according to our previous study,17 and the results are described in Fig. S9.† In Hf0.5Zr0.5O2, CT,crystn gradually increased from 0.86 at 700 K to 0.99 at 1000 K, and the CM,crystn was calculated to be 1 − CT,crystn. The PO-phase fraction, CPO,crystn, is negligible due to its high crystallization barrier. In ZrO2, on the other hand, CT,crystn is ∼1.00 across the entire temperature range. The details on the crystallization process are reported elsewhere,17 and are also summarized in SM. However, the effect of strain on the crystallization process could not be considered because applying strain in an amorphous structure was challenging. In addition, CM,crystn was assumed to remain unchanged in the subsequent heat treatment and cooling step after crystallization in this study because the M-phase generally forms the ground state, even if a slight in-plane strain is applied. Besides, the T-phase is the primary phase formed from amorphous Hf0.5Zr0.5O2 and ZrO2. Due to the metastability of the T-phase, transitions from the T-phase to other phases occur during the subsequent process. Therefore, this section focuses on transitions from the T- to M- and PO-phases during annealing and cooling, taking into account the effects of ε{111} on both the thermodynamic (Fi,grain) and kinetic (Ea,nuc) terms.Due to the lower Ea,nuc(T → PO) than Ea,nuc(T → M), the phase transition from the T- to PO-phases is faster than that from the T- to M-phases. However, in this study, the fraction transitioned from the T- to M-phases (CT→M) was calculated prior to that from the T- to PO phases (CT→PO) because the high Ea,nuc(T → M) allows for the M-phase formation only during annealing, not during cooling. Nonetheless, the calculation sequence does not significantly affect the overall phase fractions because the transition from the T- to PO-phases is suppressed at high annealing temperatures due to the higher stability of the T-phase than the PO-phase. At low annealing temperatures, the transition to M-phase is small from both T- and PO-phases due to low thermal energy. Therefore, the total phase fractions are negligibly affected even if the PO-phase forms before the M-phase.
The equilibrium fraction of the M-phase transformed from the T-phase (CBoltzmannT→M) is described by the Boltzmann distribution of Fi,grain.
 | (3) |
This equation is valid only when the thermal energy is sufficient to overcome the Ea,nuc(T → M), which is generally not the case at moderate annealing temperatures (∼700K), rendering the kinetically formed fraction smaller than the CBoltzmannT→M. To address the kinetic effect, the kinetically limited fraction of the M-phase transformed from the T-phase (CJMAT→M) was calculated based on the Johnson–Mehl–Avrami (JMA) equation:
| CJMAT→M(T) = CT,crystn[1 − exp(−(kT→M(T)·tannealing)n)], | (4) |
 | (5) |
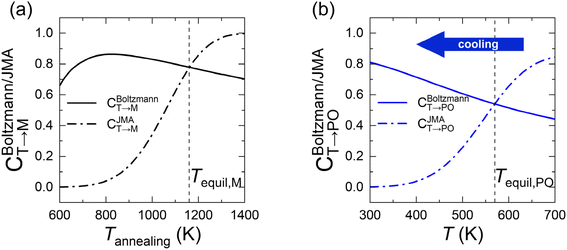
In eqn (6), the equilibrium temperature of the M-phase (Tequil,M) is the temperature where CBoltzmannT→M(T) and CJMAT→M(T) are equal. Thus, CT→M is determined as CBoltzmannT→M(Tequil,M) or CJMAT→M(Tannealing) if the heat treatment is conducted at Tannealing higher or lower than Tequil,M. Fig. 5(a) shows the variations in CBoltzmannT→M and CJMAT→M of Hf0.5Zr0.5O2 as a function of Tannealing when ε{111} = 0.00. Below 1160 K, CJMAT→M is lower than CBoltzmannT→M, indicating that thermal energy is insufficient to achieve thermal equilibrium. Hence, the CT→M is determined by CJMAT→M following eqn (6-1). Above 1160 K, in contrast, CJMAT→M is greater than CBoltzmannT→M, representing that thermal energy is enough to establish thermal equilibrium. Therefore, CT→M is saturated to CBoltzmannT→M(Tequil,M) following eqn (6-2).
Meanwhile, the PO-phase transition from the T-phase (CT→PO) is also determined similarly to CT→M. Due to the much lower Ea,nuc(T → PO) than Ea,nuc(T → M) for all ε{111} shown in Fig. 4, the transition from the T- to the PO-phases is expected to occur during both annealing and cooling. This fact manifests that thermal equilibrium between the T- and PO-phases is maintained at a specific cooling temperature. In other words, the equilibrium temperature of the PO-phase (Tequil,PO), where CBoltzmannT→PO(T) and CJMAT→PO(T) are equal, is lower than the usual annealing temperatures. After annealing, the equilibrium phase fraction of the PO-phase was also calculated by the Boltzmann distribution of Fi,grain as shown in eqn (7).
 | (7) |
The M-phase formed during annealing was assumed not to participate in the cooling process due to the high Ea,nuc(T → M). Thus, the CT→PO was determined from the T-phase remaining in the annealing process (CT,crystn–CT→M). The kinetically limited fraction of the PO-phase transformed from the T-phase (CJMAT→PO) during cooling was calculated based on the JMA equation shown in eqn (8).
 | (8) |
Eqn (8) is similar to eqn (4), but a cooling time (tcooling) of 0.5 s (according to the moderate cooling rate of 2 K s−1)40 was used instead of tannealing, meaning that CJMAT→PO was calculated for Hf0.5Zr0.5O2 annealed at each T for 0.5 s.
Fig. 5(b) shows the CBoltzmannT→PO and CJMAT→PO of Hf0.5Zr0.5O2 at ε{111} = 0.00 when annealed at 700 K and then cooled to room temperature. Tequil,PO was determined to be 570 K, and, hence, the thermal equilibrium is achieved above 570 K and the PO-phase forms with a fraction of CBoltzmannT→PO. Below 570 K, however, the PO-phase is no longer formed due to insufficient thermal energy to overcome the kinetic energy barrier. Therefore, the CT→PO in the cooling process converges to CBoltzmannT→PO(Tequil,PO). Fig. S10† shows the ε{111}-dependent Tequil,M and Tequil,PO in Hf0.5Zr0.5O2 and ZrO2, respectively. Overall, Tequil,M exceeds the normal Tannealing of polycrystalline films (= 700–800 K), but Tequil,PO is much lower than Tannealing regardless of ε{111}. These facts indicate that the M-phase formation is kinetically suppressed. At the same time, the thermodynamic driving force and facile kinetic route at the normal crystallization, annealing, and cooling temperatures support the PO-phase formation.
Fig. 6 shows the overall calculation procedure for the sequential crystallization, annealing, and cooling processes. The total fractions of the M-, PO-, and T-phases were calculated as CM = CM,crystn + CT→M, CPO = CT→PO, and CT = 1 − CM − CPO, respectively.
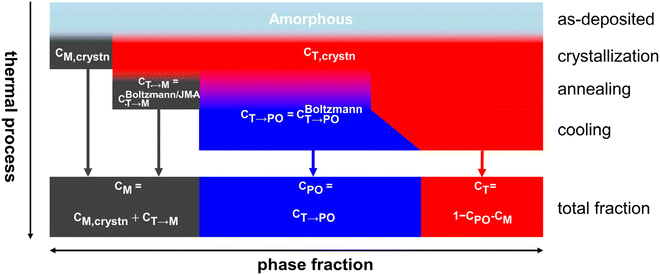 | ||
| Fig. 6 Calculation procedure of the phase transition and phase fractions in the whole thermal processes in HZO. | ||
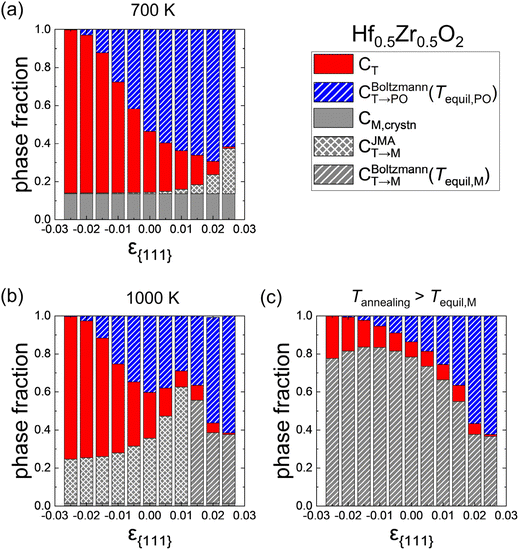
Fig. 7(a) and (b) show the effects of ε{111} on the phase fractions formed after the cooling when the Hf0.5Zr0.5O2 film was crystallized at Tannealing of 700 K and 1000 K with a dT of 10 nm. The red, blue, and gray colors represent the fractions of the T-(111), PO-(111), and M-{111} grains, respectively. The hatch and cross patterns in the PO- and M-phases indicate that the formation of the corresponding phases is governed by thermodynamic factors (i.e., controlled by the Boltzmann distribution) and kinetic factors (i.e., controlled by the JMA equation), respectively. As discussed above, CT→PO is solely determined by the thermodynamic factors; all the CT→PO regions have the hatch pattern. In contrast, CT→M is determined by either thermodynamic or kinetic factors, so it has a hatch or cross pattern, depending on the detailed formation conditions.
At Tannealing = 700 K shown in Fig. 7(a), the CT→PO has a maximum value at ε{111} = 0.02 and diminishes with decreasing ε{111} due to the increase of FPO,grain. Meanwhile, the PO-(111) is thermodynamically stable at ε{111} = 0.025 and T = 700 K in Fig. 3(a), but the CT→PO at ε{111} = 0.025 is lower than those at ε{111} = 0.01 and 0.015 where the PO-phase is not the ground state. This behavior is due to the abrupt increase of CT→M along with ε{111}, caused by a significant decrease in Ea,nuc(T → M) shown in Fig. 4(b).
At Tannealing = 1000 K shown in Fig. 7(b), on the other hand, the CM,crystn is negligibly low irrespective of ε{111}. However, over the entire ε{111} range, the CT→M significantly increases compared to that shown in Fig. 7(a), indicating that a very high annealing temperature is undesirable. Interestingly, CT→M increases with increasing ε{111} as long as the kinetic factor governs the M-phase formation. In contrast, it diminishes with increasing ε{111} once the M-phase formation is dominated by the thermodynamic factor, as represented by the hatch pattern. The optimal ε{111} to increase the CT→PO depends on Tannealing. As the Tannealing increases, the CT→PO decreases due to the overall increment of CT→M. Therefore, to maximize CPO while suppressing CM, annealing at moderate temperatures (∼700 K) and tensile ε{111} is suitable, which is consistent with the experimental results of polycrystalline Hf0.5Zr0.5O2 annealed at different temperatures and under different in-plane strain conditions.7,8,32,35
Fig. 7(c) shows the phase fractions in the extreme case when sufficient thermal energy is supplied by annealing at elevated temperatures (i.e., Tannealing is higher than Tequil,M in all ε{111}), where all the CT→M is saturated to CBoltzmannT→M(Tequil, M), represented by the hatch pattern across the entire gray bars. The CT→PO increases with increasing ε{111}, indicating that the tensile strain state is favored over the compressive one even under these extreme temperature conditions. Also, CT→PO at ε{111} of 0.02–0.025 is higher than CT→M because the difference between FPO,grain and FM,grain decreases in this ε{111} range. These calculation results explain the enhanced ferroelectricity in epitaxial Hf0.5Zr0.5O2 films under in-plane tensile strain and the reduction of ferroelectricity due to the increase in the M-phase under in-plane compressive strain in thin films deposited at temperatures above 1000 K.9,12,41
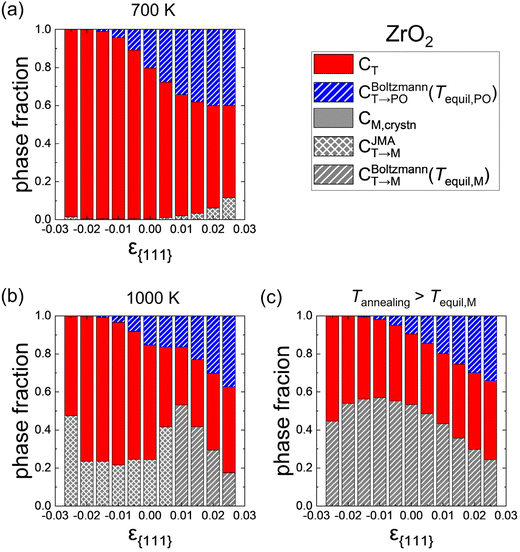
Fig. 8 shows similar calculation results for ZrO2 as Fig. 7. The tendency of the phase fractions depending on ε{111} is similar to that of Hf0.5Zr0.5O2. In ZrO2, however, the M-phase formation is more suppressed, and the T-phase is the primary phase rather than the PO-phase. These results are due to lower CM,crystn (= ∼0), lower FT,grain, and higher Ea,nuc(T → M) in ZrO2 compared to Hf0.5Zr0.5O2. Nevertheless, CT→PO increases with tensile ε{111}, suggesting an increase of (field-induced) ferroelectricity through tensile ε{111} engineering.
In-plane strain effects on the ferroelectric polarization
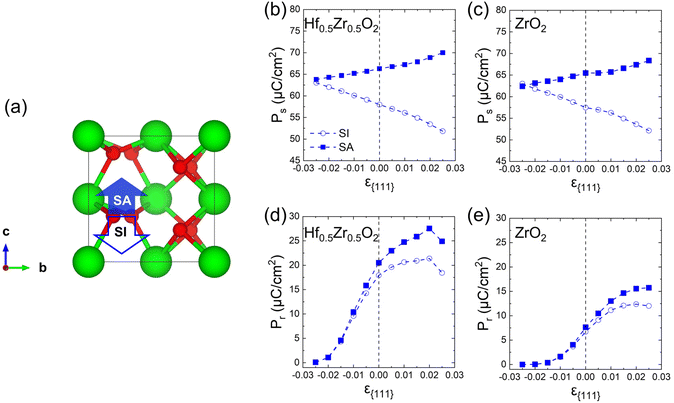
Finally, the effects of ε{111} on the theoretical polarizations of Hf0.5Zr0.5O2 and ZrO2 were calculated. Fig. 9(a) depicts the two polarization switching pathways of the shift-inside (SI) and the shift across (SA) in the PO-phase. Due to the presence of the two switching paths, Hf0.5Zr0.5O2 exhibits two Ps of 58 and 66 μC cm−2 in the [001] orientation at ε{111} = 0.00 for the SI and SA pathways, respectively. Early studies often reported a lower ferroelectric switching barrier for the SI pathway when calculating the switching barriers in the 1 × 1 × 1 PO-phase unit cell.42,43 However, recent studies demonstrated that the SA pathway is more adjustable when computing in the N × 1 × 1 PO-phase supercell.44,45 Thus, this study examines both switching pathways. Fig. 9(b) and (c) show the ε{111}-dependent Ps along the [001] orientation in Hf0.5Zr0.5O2 and ZrO2. The Ps of the SI pathway increases with compressive ε{111}, while the Ps of the SA pathway increases with tensile ε{111}.For Pr calculation, the [111] orientation is assumed as an out-of-plane direction. Hence, the polarization along the [111] direction was considered as  . In addition, the CPO was also considered for calculating the theoretical Pr because only the PO-phase contributes to the ferroelectric polarization. As a result, theoretical Pr was calculated as
  . Fig. 9(d) shows the Pr of Hf0.5Zr0.5O2 depending on ε{111} when the Tannealing is 700 K. The Pr of Hf0.5Zr0.5O2 at ε{111} = 0.00–0.025 ranges from 18–21 μC cm−2 by the SI pathway, while 20–28 μC cm−2 by the SA pathway, consistent with the experimental Pr values (10–30 μC cm−2) in Hf0.5Zr0.5O2.2,3 Compared to ε{111} = 0.00, the Pr of Hf0.5Zr0.5O2 increases via tensile ε{111} by 19% and 34% by the SI and SA pathways, respectively. The more pronounced increase of Pr in the SA pathway is attributed to the increase of Ps in the SA pathway under tensile ε{111}. On the other hand, Pr in ZrO2 was lower than that in Hf0.5Zr0.5O2 for all the ε{111} ranges in Fig. 9(e). However, its increase ratios were 84% (SI pathway) and 106% (SA pathway), much higher than those in Hf0.5Zr0.5O2. Therefore, in-plane tensile strain engineering is suitable for applications requiring high Pr in Hf0.5Zr0.5O2 and ZrO2, irrespective of the switching pathways. The in-plane tensile strain can be experimentally realized by various ways, such as the thermal expansion coefficient mismatch between the film and electrode,8 lattice parameter mismatch between the film and substrate,9 and the growth mode control,29 which will increase the PO-phase fraction.
Conclusion
The in-plane strain-dependent phase fractions were predicted using density functional theory calculations to understand the enhanced ferroelectricity in tensile-strained Hf0.5Zr0.5O2 and ZrO2 thin films in the experiment. The thermodynamic free energy and kinetic activation barrier for the phase transition from the tetragonal (T-) phase to monoclinic (M-) or polar orthorhombic (PO-) phases were calculated as a function of in-plane strain. They were employed for the Boltzmann distribution and the Johnson–Mehl–Avrami (JMA) equation for the phase fraction calculations. This methodology enabled the computation of quantitative phase fractions as a function of in-plane strain with the 〈111〉 orientation (ε{111}) and annealing temperature. The JMA equation (kinetic factors) primarily determined the M-phase fraction at low temperatures due to the high activation barrier for the transition from the T- to M-phases. The kinetically formed M-phase fraction increases as temperature increases due to the increment of thermal energy. If temperatures are sufficiently high to overcome this activation barrier, the M-phase fraction converges to the value obtained from the Boltzmann distribution (thermodynamic factors).On the other hand, the activation barrier from the T- to PO-phases is relatively low, making the thermodynamic factors mainly control the PO-phase formation. The PO-phase fraction increases in the tensile ε{111} region, where the PO-phase has relatively low free energy. Conversely, the T-phase is preferred in the compressive ε{111} region, where the PO-phase has high free energy. Therefore, heat treatment at moderate temperatures at 700–800 K and applying in-plane tensile ε{111} are appropriate for suppressing the M-phase formation and enhancing the PO-phase formation. These calculation results are consistent with general experimental observations on the enhanced ferroelectricity of polycrystalline Hf0.5Zr0.5O2 films under in-plane tensile strain annealed at approximately 700–800 K. In addition, the abundant PO-phase fraction under a tensile ε{111} of 0.02–0.025 in the higher temperature region (>1000 K) is consistent with the enhanced ferroelectricity in the epitaxial Hf0.5Zr0.5O2 film when deposited at high temperatures. The polarization values were quantitatively calculated by taking into account the PO-phase fraction. The remanent polarization increases by 34% in Hf0.5Zr0.5O2 and 106% in ZrO2 under tensile strain. This study overcomes the gap between theoretical predictions and experimental results by elucidating that in-plane tensile ε{111} is suitable for increasing the PO-phase fraction and enhancing ferroelectricity. Furthermore, the strain engineering proposed in this study is expected to also contribute to optimizing other electrical properties, such as high-k applications.
Author contributions
Kun Hee Ye: formal analysis, investigation, methodology, and writing – original draft; Taeyoung Jeong: formal analysis and writing – review & editing; Seungjae Yoon: formal analysis and writing – review & editing; Dohyun Kim: formal analysis and writing – review & editing; Cheol Seong Hwang: supervision and writing – review & editing; and Jung-Hae Choi: conceptualization, funding acquisition, project administration, supervision, and writing – review & editing.Data availability
The data that support the findings of this study are available within this article and its ESI.†Conflicts of interest
The authors declare that they have no known competing financial interests or personal relationships that could have appeared to influence the work reported in this paper.Acknowledgements
J.-H.C. was supported by the National Research Foundation of Korea (NRF) grant funded by MSIT [Next Generation Intelligence Semiconductor Foundation 2022M3F3A2A01076569] and by the Institutional Research Program of Korea Institute of Science and Technology (KIST) [2E33223]. C.S.H. was supported by the Technology Innovation Program [20017224, Development of a new ALD system for the next-generation mass-production memory devices] funded by the Ministry of Trade Industry & Energy [MOTIE, Korea]. The authors would also like to acknowledge the support from the KISTI Supercomputing Center through a Strategic Support Program for Supercomputing Application Research [KSC-2022-CRE-0378 and KSC-2023-CRE-0410].References
- J. P. B. Silva, R. Alcala, U. E. Avci, N. Barrett, L. Bégon-Lours, M. Borg, S. Byun, S. C. Chang, S. W. Cheong, D. H. Choe, J. Coignus, V. Deshpande, A. Dimoulas, C. Dubourdieu, I. Fina, H. Funakubo, L. Grenouillet, A. Gruverman, J. Heo, M. Hoffmann, H. A. Hsain, F. T. Huang, C. S. Hwang, J. Íñiguez, J. L. Jones, I. V. Karpov, A. Kersch, T. Kwon, S. Lancaster, M. Lederer, Y. Lee, P. D. Lomenzo, L. W. Martin, S. Martin, S. Migita, T. Mikolajick, B. Noheda, M. H. Park, K. M. Rabe, S. Salahuddin, F. Sánchez, K. Seidel, T. Shimizu, T. Shiraishi, S. Slesazeck, A. Toriumi, H. Uchida, B. Vilquin, X. Xu, K. H. Ye and U. Schroeder, APL Mater., 2023, 11, 089201 CrossRef CAS.
- U. Schroeder, M. H. Park, T. Mikolajick and C. S. Hwang, Nat. Rev. Mater., 2022, 7, 653–669 CrossRef.
- M. H. Park, Y. H. Lee, H. J. Kim, Y. J. Kim, T. Moon, K. D. Kim, J. Müller, A. Kersch, U. Schroeder, T. Mikolajick and C. S. Hwang, Adv. Mater., 2015, 27, 1811–1831 CrossRef CAS PubMed.
- J. Müller, T. S. Böscke, U. Schröder, S. Mueller, D. Bräuhaus, U. Böttger, L. Frey and T. Mikolajick, Nano Lett., 2012, 12, 4318–4323 CrossRef.
- S. D. Hyun, H. W. Park, M. H. Park, Y. H. Lee, Y. B. Lee, B. Y. Kim, H. H. Kim, B. S. Kim and C. S. Hwang, Adv. Electron. Mater., 2020, 6, 2000631 CrossRef CAS.
- M. Jung, V. Gaddam and S. Jeon, Nano Converg., 2022, 9, 44 CrossRef CAS PubMed.
- S. J. Kim, D. Narayan, J. G. Lee, J. Mohan, J. S. Lee, J. Lee, H. S. Kim, Y. C. Byun, A. T. Lucero, C. D. Young, S. R. Summerfelt, T. San, L. Colombo and J. Kim, Appl. Phys. Lett., 2017, 111, 242901 CrossRef.
- Y. Goh, J. Hwang, Y. Lee, M. Kim and S. Jeon, Appl. Phys. Lett., 2020, 117, 242901 CrossRef CAS.
- S. Estandía, N. Dix, J. Gazquez, I. Fina, J. Lyu, M. F. Chisholm, J. Fontcuberta and F. Sánchez, ACS Appl. Electron. Mater., 2019, 1, 1449 CrossRef.
- R. Batra, H. D. Tran and R. Ramprasad, Appl. Phys. Lett., 2016, 108, 172902 CrossRef.
- R. Materlik, C. Kunneth and A. Kersch, J. Appl. Phys., 2015, 117, 134109 CrossRef.
- K. Liu, F. Jin, X. Zhang, K. Liu, Z. Zhang, E. Hua, J. Zhang, H. Ye, G. Gao, C. Ma, L. Wang and W. Wu, Adv. Funct. Mater., 2023, 33, 2209925 CrossRef CAS.
- J. F. Ihlefeld, T. Peters, S. T. Jaszewski, T. Mimura, B. L. Aronson and S. Trolier-McKinstry, Appl. Phys. Lett., 2023, 123, 082901 CrossRef CAS.
- Y. Zhang, Q. Yang, L. Tao, E. Y. Tsymbal and V. Alexandrov, Phys. Rev. Appl., 2020, 14, 014068 CrossRef CAS.
- S. Liu and B. M. Hanrahan, Phys. Rev. Mater., 2019, 3, 054404 CrossRef CAS.
- K. Chae, J. Hwang, E. Chagarov, A. Kummel and K. Cho, J. Appl. Phys., 2020, 128, 054101 CrossRef CAS.
- K. H. Ye, I. W. Yeu, G. Han, T. Jeong, S. Yoon, D. Kim, C. S. Hwang and J. H. Choi, Appl. Phys. Rev., 2023, 10, 031419 CAS.
- G. Kresse and J. Furthmüller, Phys. Rev. B: Condens. Matter Mater. Phys., 1996, 54, 11169 CrossRef CAS PubMed.
- G. Kresse and J. Furthmüller, Comput. Mater. Sci., 1996, 6, 15–50 CrossRef CAS.
- D. M. Ceperley and B. J. Alder, Phys. Rev. Lett., 1980, 45, 566 CrossRef CAS.
- J. P. Perdew and A. Zunger, Phys. Rev. B: Condens. Matter Mater. Phys., 1981, 23, 5048 CrossRef CAS.
- G. Kresse and D. Joubert, Phys. Rev. B: Condens. Matter Mater. Phys., 1999, 59, 1758 CrossRef CAS.
- P. E. Blöchl, Phys. Rev. B: Condens. Matter Mater. Phys., 1994, 50, 17953 CrossRef PubMed.
- A. Togo and I. Tanaka, Scr. Mater., 2015, 108, 1 CrossRef CAS.
- R. D. King-Smith and D. Vanderbilt, Phys. Rev. B: Condens. Matter Mater. Phys., 1993, 47, 1651 CrossRef CAS PubMed.
- N. A. Spaldin, J. Solid State Chem., 2012, 195, 2–10 CrossRef CAS.
- A. Christensen and E. A. Carter, Phys. Rev. B: Condens. Matter Mater. Phys., 1998, 58, 8050 Search PubMed.
- M. H. Park, Y. H. Lee, H. J. Kim, Y. J. Kim, T. Moon, K. Do Kim, S. D. Hyun, T. Mikolajick, U. Schroeder and C. S. Hwang, Nanoscale, 2018, 10, 716–725 Search PubMed.
- M. H. Park, H. J. Kim, Y. J. Kim, T. Moon and C. S. Hwang, Appl. Phys. Lett., 2014, 104, 072901 Search PubMed.
- C. Verdi, F. Karsai, P. Liu, R. Jinnouchi and G. Kresse, npj Comput. Mater., 2021, 7, 156 CrossRef CAS.
- M. H. Park, Y. H. Lee, H. J. Kim, T. Schenk, W. Lee, K. Do Kim, F. P. G. Fengler, T. Mikolajick, U. Schroeder and C. S. Hwang, Nanoscale, 2017, 9, 9973–9986 RSC.
- J. Wu, F. Mo, T. Saraya, T. Hiramoto and M. Kobayashi, Appl. Phys. Lett., 2020, 117, 252904 CrossRef CAS.
- M. H. Park, Y. H. Lee and C. S. Hwang, Nanoscale, 2019, 11, 19477–19487 RSC.
- D. A. Porter, K. E. Easterling and M. Y. Sherif, Phase Transformations in Metals and Alloys, CRC Press, USA, 3rd edn, 2009 Search PubMed.
- M. H. Park, H. J. Kim, Y. J. Kim, W. Lee, T. Moon and C. S. Hwang, Appl. Phys. Lett., 2013, 102, 242905 CrossRef.
- S. Dutta, P. Buragohain, S. Glinsek, C. Richter, H. Aramberri, H. Lu, U. Schroeder, E. Defay, A. Gruverman and J. Íñiguez, Nat. Commun., 2021, 12, 7301 CrossRef CAS PubMed.
- R. M. P. Pereira, M. C. Istrate, F. G. Figueiras, V. Lenzi, B. M. Silva, M. Benamara, K. N. Romanyuk, C. Ghica, B. G. Almeida, L. Marques, M. Pereira and J. P. B. Silva, Mater. Sci. Semicond. Process., 2024, 172, 108102 CrossRef CAS.
- R. Ganser, S. Bongarz, A. Von Mach, L. Azevedo Antunes and A. Kersch, Phys. Rev. Appl., 2022, 18, 054066 CrossRef CAS.
- Y. H. Lee, S. D. Hyun, H. J. Kim, J. S. Kim, C. Yoo, T. Moon, K. Do Kim, H. W. Park, Y. Bin Lee, B. S. Kim, J. Roh, M. H. Park and C. S. Hwang, Adv. Electron. Mater., 2019, 5, 1800436 CrossRef.
- S. S. Fields, T. Cai, S. T. Jaszewski, A. Salanova, T. Mimura, H. H. Heinrich, M. D. Henry, K. P. Kelley, B. W. Sheldon and J. F. Ihlefeld, Adv. Electron. Mater., 2022, 8, 2200601 CrossRef CAS.
- T. Song, V. Lenzi, J. P. B. Silva, L. Marques, I. Fina and F. Sánchez, Appl. Phys. Rev., 2023, 10, 041415 CAS.
- W. Wei, G. Zhao, X. Zhan, W. Zhang, P. Sang, Q. Wang, L. Tai, Q. Luo, Y. Li, C. Li and J. Chen, J. Appl. Phys., 2022, 131, 154101 CrossRef CAS.
- T. Maeda, B. Magyari-Köpe and Y. Nishi, 2017 IEEE International Memory Workshop (IMW), 2017, 1–4.
- Y. Wu, Y. Zhang, J. Jiang, L. Jiang, M. Tang, Y. Zhou, M. Liao, Q. Yang and E. Y. Tsymbal, Phys. Rev. Lett., 2023, 131, 226802 CrossRef CAS.
- A. Silva, I. Fina, F. Sánchez, J. P. B. Silva, L. Marques and V. Lenzi, Mater. Today Phys., 2023, 34, 101064 CrossRef CAS.
Footnote |
| † Electronic supplementary information (ESI) available. See DOI: https://doi.org/10.1039/d4nr03333g |
| This journal is © The Royal Society of Chemistry 2025 |

