 Open Access Article
Highly sensitive and precise optical temperature sensors based on new luminescent Tb3+/Eu3+ tetrakis complexes with imidazolic counterions†
Lucca B.
Guimarães
 a,
Alexandre M. P.
Botas
 b,
Maria C. F. C.
Felinto
 c,
Rute A. S.
Ferreira
 b,
Luis D.
Carlos
 b,
Oscar L.
Malta
 d and
Hermi F.
Brito
 *a
*a
aDepartment of Fundamental Chemistry, Institute of Chemistry, University of São Paulo, Avenida Professor Lineu Prestes 748, 05508-008, São Paulo, Brazil. E-mail: hefbrito@iq.usp.br
bPhantom-g, CICECO – Aveiro Institute of Materials, Department of Physics, Universidade de Aveiro, 3810-193 Aveiro, Portugal
cInstitute of Energy and Nuclear Research, Avenida Professor Almeida Prado 2242, 05508-000, São Paulo, Brazil
dDepartament of Fundamental Chemistry, Federal University of Pernambuco, Cidade Universitária, 50740-540, Recife, Brazil
First published on 7th August 2020
Abstract
In the present work, new Tb3+/Eu3+ tetrakis(benzoyltrifluoroacetone) complexes containing imidazolic counterions were successfully prepared and characterized via elemental analysis, infrared spectroscopy, thermogravimetry, and X-ray powder diffraction. Photophysical features of the Eu3+ ion, such as the intrinsic emission quantum yields, radiative and non-radiative decay rates, and emission lifetimes were dramatically improved when compared with the data from the hydrated tris complex reported in the literature. The values found for the absolute emission quantum yields are up to 0.79 and ratiometric luminescent thermometers were built-up based on the ratio between the spectral areas of the 5D0 → 7F2 (Eu3+) and 5D4 → 7F5 (Tb3+) transitions. The best contactless temperature sensor operates in a wide temperature range (20–225 K) with a relative thermal sensitivity higher than 4% K−1 (maximum value of ∼7.6% K−1 at 20 K) and a temperature uncertainty lower than 0.1 K with a minimal lower than 0.01 K by combining excitation at the ligand (360 nm) and the Tb3+ ion (489 nm), illustrating the potential of lanthanide-based tetrakis complexes in the design of efficient luminescent thermometers.
1. Introduction
Temperature is a fundamental thermodynamic parameter for a vast majority of systems and holds great importance in science and technology.1 In the most common temperature sensors, direct contact with the sample is required and, therefore, measurements at the sub-micron scale (as intracellular measurements) are almost impossible.2,3 This limitation increased the research for accurate thermometers with nanometric resolution such as luminescent thermometers, a topic that has been increasingly explored.4–12 The first luminescent thermometers developed used mainly non-ratiometric thermometric parameters, such as the integrated area of a single transition. This thermometric feature has enormous disadvantages as the thermometric parameter is compromised by (i) variations in the sensor concentration, (ii) optoelectronic drifts in the excitation source and detecting system, and (iii) material homogeneity effects.13–15 Such disadvantages were overcome with the use of ratiometric probes, which use the ratio between two transitions or two spectral regions and, consequently, are self-calibrating.16,17 It is worth mentioning that several other emission parameters were used as the thermometric parameter (e.g., bandwidth and lifetimes).10 Nowadays, several Eu3+/Tb3+ co-doped complexes have been reported as ratiometric luminescent thermometers based on the 5D4 → 7F5 (Tb3+) and 5D0 → 7F2 (Eu3+) transitions, undoubtedly inspired by the pivotal works of Sato et al. and Brites et al.6,8,10,18–23 Lanthanide complexes are usually used due to their spectroscopic features such as narrow absorption and emission bands, relatively long excited-state lifetimes, and high color purity.24–30 The 4f–4f transitions have an atomic-like character owing to the chemical environment shielding by the 5s and 5p filled sub-shells and, thus, the ligand field effect on the 4f levels is small.31,32 These intraconfigurational transitions are forbidden in the first order by the electric dipole mechanism (Laporte's rule). To overwhelm the low oscillator strengths, chromophores are used as sensitizers to absorb and transfer energy non-radiatively to the Ln3+ ions. This effect is known as the antenna effect and is an essential feature in the molecular design of lanthanide emitting materials.33 It is noteworthy that Weissman first elucidated the antenna effect in 1942.34 β-diketonate compounds and their derivatives are reported to be one of the best groups of ligands for the luminescence of Eu3+ and Tb3+ complexes, due to their first excited triplet state energies (T1) (and, in some examples, their first excited singlet states S1).35 Furthermore, the Ln3+ β-diketonate complexes have been studied both in the tris and tetrakis forms. Usually, in the tris complexes, the water molecules can be replaced by neutral ancillary ligands, showing a general formula [Ln(β-diketonate)3(L)n], where L is a neutral ligand, for example, pyridine, bipyridine, triphenylphosphine oxide, etc. However, in the tetrakis complexes, [cation][Ln(β-diketonate)4], there is an additional β-diketonate ligand, which can increase the chance of an intramolecular energy transfer process.36,37 Besides, the advantage of Ln3+ tetrakis complexes is the possibility of energy transfer from organic cations, apart from the diketonate ligands. Also, these compounds are usually anhydrous and the absence of water molecules in the first coordination sphere is known to lead to an increase in the emission quantum efficiency of the Ln3+ ions.38,39 It was also reported that organic counterions could improve the stability of the complex and solubility in organic solvents.40 Usually, the ligand T1 energy is determined by using the Gd3+ (4f7) ion, due to the large energy gap (∼32 000 cm−1) between the ground state (8S7/2) and the first excited state (6P7/2) and the Gd3+ contribution to intersystem crossing (ISC) rates by the paramagnetic and heavy-ion effects. The observation of the ligand phosphorescence broadband in the Gd3+ complexes at low temperature is assigned to the T1 → S0 transition.31,41–43In this work, the synthesis, characterization and optical-thermal properties of the [C4mim][Tb1−xEux(btfa)4] complexes (x = 0.01, 0.05, 0.10, 1.00) are reported, where btfa stands for benzoyltrifluoroacetone and [C4mim] stands for 1-butyl-3-methyilmidazolium. These luminescent materials were synthesized in a one-pot reaction and characterized via elemental analysis (CHN), Fourier Transform infrared spectroscopy (FTIR), thermogravimetry (TG/DTG), and X-ray powder diffraction (XRD). The photoluminescence properties were investigated based on the excitation and emission spectra, absolute emission quantum yield (QLLn), luminescence decay curve of the Eu3+ 5D0 level, radiative and non-radiative decay rates, and intrinsic 5D0 quantum yield (QEuEu). The thermometric parameters were determined based on the ratio between the integrated intensities of the Tb3+ 5D4 → 7F5 and Eu3+ 5D0 → 7F2 transitions and the relative thermal sensitivity (Sr), as well as the temperature uncertainty (δT), were discussed.8,10 These optical thermometers operate by combining excitations by blue and UV light with minimal temperature uncertainty lower than 0.01 K, indicating that these Tb3+/Eu3+ tetrakis systems can be used as precise optical temperature sensors.
2. Experimental section
The lanthanide chlorides LnCl3·6H2O (Ln3+: Eu and Tb) were prepared by using an aqueous suspension of the respective oxide Eu2O3 and Tb4O7 (Cstarm, 99.99%) with concentrated HCl acid until the solution reached a pH ∼ 6.0. It is worth mentioning that for the terbium chloride synthesis, hydrogen peroxide (Synth – 30%) was added for the reduction of TbIV to Tb3+. The ligand used was benzoyltrifluoroacetone (4,4,4-trifluoro-1-phenyl-1,3-butanedione – btfa) from Sigma-Aldrich (99%). The counterion source, [C4mim]Br (1-butyl-3-methylimidazolium bromide) was synthesized from the reaction of 1-methylimidazole (Sigma-Aldrich, 99%) and 1-bromobutane (Sigma-Aldrich, 99%), using the microwave method described in the literature.44Elemental analysis was performed in a PerkinElmer CHN 2400 analyzer. The FTIR measurements were registered in KBr pellets in a PerkinElmer Frontier FTIR from 500 to 4000 cm−1. The thermogravimetric curves were recorded in a TA Q500 thermoanalyzer from 25 to 900 °C. The X-ray powder diffraction (XPD) patterns were obtained in Miniflex Rigaku equipment (Cu Kα1) from 5 to 65° (2θ).
The photoluminescence study was based on the excitation and emission spectra recorded at room temperature (300 K) and in a temperature interval from 15 to 350 K. These optical data were recorded using a Fluorolog-3® Horiba Scientific (Model FL3-22) fluorometer equipped with a 450 W Xe lamp as an excitation source, a modular double grating excitation spectrometer, and an iHR 320 single emission monochromator. The temperature was varied using a helium-closed cycle cryostat, a vacuum system (4 × 10⁻⁴ Pa), and an autotuning temperature controller (Lakeshore 330, Lakeshore) with a resistance heater. All the measurements began at least 300 s after the temperature indicated in the temperature controller remained constant, thus ensuring the thermalization of the samples and a constant temperature during the measurement. The time-resolved experiments were carried out using a Xe–Hg flash lamp (6 μs pulse half-width and 20–30 μs tail) as the excitation source. The conversion from wavelength to energy units and the Jacobian transformation of the intensity values were performed.45 The emission lifetimes were determined by modeling the emission decay curves with a single exponential function.
The absolute emission quantum yields were measured using a quantum yield measurement system C13534 from Hamamatsu with a 150 W xenon lamp coupled to a monochromator for wavelength discrimination, an integrating sphere as the sample chamber and a multichannel analyzer. An empty quartz Petri plate sample holder was used as a reference, and the samples were placed inside another quartz Petri plate, in the form of a pellet of about 1 cm in diameter. Three measurements were made for each sample and the average is reported. The method is accurate within 10%.
2.1. Synthesis of the [C4mim][Tb1−xEux(btfa)4] (x = 0.01, 0.05, 0.10, 1.00)
First, in the preparation of the complexes, an aqueous solution of NaOH (20 mmol in 10 mL of water) was added to an isopropanol solution of benzoyltrifluoroacetone (20 mmol in 40 mL of isopropanol) with stirring at 60 °C to deprotonate the Hbtfa ligand (pKa = 7). After that, an isopropanol solution of [C4mim]Br (6 mmol in 10 mL of isopropanol) was added to the mixture. Lastly, an aqueous solution of europium chloride (4 mmol in 10 mL of water) was added to the solution and a precipitate of the [C4mim][Eu(btfa)4] complex was formed.40,46 After stirring at around 70 °C for 2 h, the mixture was cooled down to room temperature and then the complex was filtered, washed with water and dried under reduced pressure for 5 h. The same procedure was used to synthesize [C4mim][Tb1−xEux(btfa)4] (x = 0.01, 0.05, 0.10), the only difference is the addition of terbium chloride to the same solution of EuCl3. All prepared Ln3+ complexes are soluble in the most common organic solvents (acetone, chloroform, dichloromethane, acetonitrile) however, they are insoluble in ethanol and hexane. The experimental and calculated elemental analysis data, CHN (%), of the complexes are very close:[C4mim][Eu(btfa)4] (pale yellow solid): anal. calcd for C48H39EuF12N2O8: C 50.05, H 3.41, N 2.43; found: C 50.21, H 3.44, N 2.34.
[C4mim][Tb0.99Eu0.01(btfa)4] (pale yellow solid): anal. calcd for C48H39Tb0.99Eu0.01F12N2O8: C 49.71, H 3.37, N 2.42; found: C 49.51, H 3.25, N 2.42.
[C4mim][Tb0.95Eu0.05(btfa)4] (pale yellow solid): anal. calcd for C48H39Tb0.95Eu0.05F12N2O8: C 49.72, H 3.37, N 2.42; found: C 49.74, H 3.32, N 2.41.
[C4mim][Tb0.90Eu0.10(btfa)4] (pale yellow solid): anal. calcd for C48H39Tb0.90Eu0.10F12N2O8: C 49.74, H 3.37, N 2.42; found: C 49.96, H 3.39, N 2.42.
3. Results and discussion
The elemental analysis results of the complexes indicate a formula with four benzoyltrifluoroacetone ligands and one 1-butyl-3-methylimidazolium counterion [C4mim][Tb1−xEux(btfa)4] (x = 0.01, 0.05, 0.10, 1.00) for all the synthesized complexes. The thermogravimetric curves of these complexes were registered in a dynamic synthetic air atmosphere at 10 °C min−1 rate and showed no mass loss in the 80–200 °C temperature interval (Fig. 1), indicating the anhydrous character of the system. The DTG curve profiles (Fig. S1, ESI†) are the same for all complexes, with the second mass loss event being shifted to lower temperatures as the Tb3+ concentration increases. Moreover, the residue from the decomposition of the [C4mim][Eu(btfa)4] is indicated to be europium oxyfluoride and the experimental mass found is very close to the theoretical EuOF residue (calcd: 16.1%, found: 16.2%).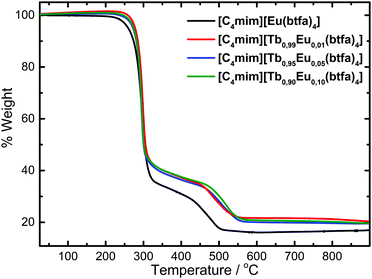 | ||
| Fig. 1 TGA curves of the [C4mim][Tb1−xEux(btfa)4] (x = 0.01, 0.05, 0.10, 1.00) complexes recorded under a synthetic air atmosphere at 10 °C min−1. | ||
The XRD patterns of the Ln3+ coordination compounds (Fig. 2) show that the crystalline structure of the materials is very similar, indicating an isomorph character. Since the ionic radius of the Tb3+ (1.040 Å) and Eu3+(1.066 Å) ions are very close for a coordination number 8, the [Ln(btfa)4]− anionic unities of Eu3+ and Tb3+ are isostructural.
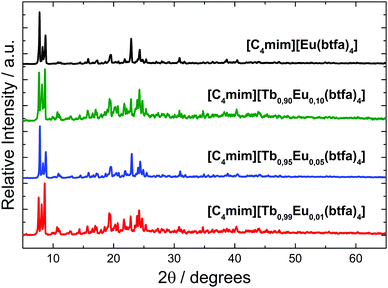 | ||
| Fig. 2 Powder X-ray diffractograms for the [C4mim][Tb1−xEux(btfa)4] (x = 0.01, 0.05, 0.10, 1.00) complexes. | ||
FTIR spectra of the [C4mim][Tb1−xEux(btfa)4] (x = 0.01, 0.05, 0.10, 1.00) complexes and Hbtfa ligand are reported in Fig. S2 (ESI†). These spectra display a shift and split of the carbonyl stretching absorption from 1603 cm−1 (Hbtfa) to 1574 and 1615 cm−1 for all compounds; there is also a significant change in the 1000–1200 cm−1 range related to C![[double bond, length as m-dash]](https://www.rsc.org/images/entities/char_e001.gif) C and C–O bonds of the enolate anion.40,46 In addition, it is possible to observe the absorptions of the counterion moiety at around 2960 cm−1 and 2860 cm−1.47 A weak absorption band observed at ∼3500 cm−1 is assigned to water absorbed by the KBr pellets once both elemental and thermogravimetric analyses have confirmed the absence of water molecules.
C and C–O bonds of the enolate anion.40,46 In addition, it is possible to observe the absorptions of the counterion moiety at around 2960 cm−1 and 2860 cm−1.47 A weak absorption band observed at ∼3500 cm−1 is assigned to water absorbed by the KBr pellets once both elemental and thermogravimetric analyses have confirmed the absence of water molecules.
3.1. Photoluminescence
The excitation spectra of the [C4mim][Eu(btfa)4] and [C4mim][Tb1−xEux(btfa)4] (x = 0.01, 0.05, 0.10) complexes were recorded in a solid-state from 250 up to 600 nm range monitoring the emission at 610 nm (5D0 → 7F2 from Eu3+) at 300 K (Fig. 3). These spectra display absorption broadbands between 250 and 450 nm assigned to singlet–singlet transitions (S0 → Sn) from the organic moiety (btfa ligands and [C4mim] cation). The presence of the ligand absorption band when monitoring at the Eu3+ emission indicates an intramolecular ligand-to-metal energy transfer process.34,35 Furthermore, some narrow absorption bands related to the Eu3+ (7F0 → 5D2) and Tb3+ (7F6 → 5D4) intraconfigurational transitions are also observed.40,48 Given that a Tb3+ absorption transition is present in the excitation spectra while monitoring the Eu3+ emission, a metal-to-metal energy transfer may also be present, though the most probable mechanism is ligand-assisted.35,49 Notably, the excitation spectrum monitoring at the very weak Tb3+ emission has no difference from the Eu3+ excitation spectrum, aside from the absence of the Eu3+ 4f–4f transitions (not shown).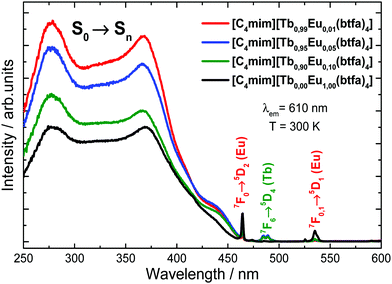 | ||
| Fig. 3 Excitation spectra for the [C4mim][Tb1−xEux(btfa)4] (x = 0.01, 0.05, 0.10 and 1.00) complexes recorded at room temperature (300 K) monitoring the Eu3+ 5D0 → 7F2 emission (610 nm). | ||
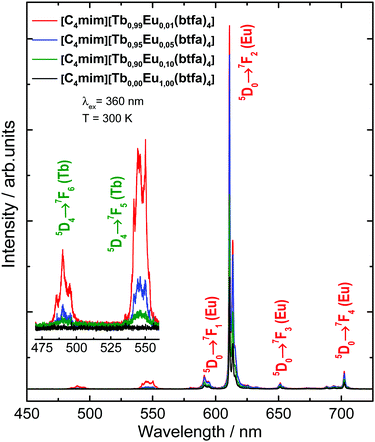
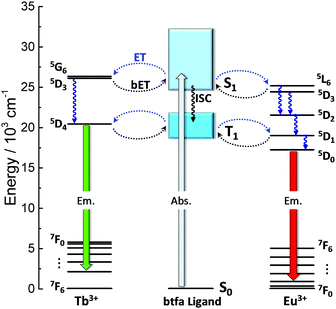
The emission spectra of the [C4mim][Tb1−xEux(btfa)4] (x = 0.01, 0.05, 0.10 and 1.00) compounds were recorded in the solid-state at 300 K from 450 to 800 nm (Fig. 4) under excitation on the ligand absorption band at 360 nm (S0 → S1). These spectra show the low intensity Tb3+ 5D4 → 7F6 (490 nm) and 5D4 → 7F5 (545 nm) transitions. At room temperature, the Eu3+ 5D0 → 7F1 (590 nm), 5D0 → 7F2 (610 nm), 5D0 → 7F3 (650 nm), and 5D0 → 7F4 (700 nm) transitions are predominant.48 The low emission intensity of the Tb3+ peaks is caused most probably due to back-energy transfer to the btfa ligand, since T1 (∼20![[thin space (1/6-em)]](https://www.rsc.org/images/entities/char_2009.gif) 350 cm−1, see Fig. S3, ESI†) is practically resonant with the Tb3+ 5D4 level (20
350 cm−1, see Fig. S3, ESI†) is practically resonant with the Tb3+ 5D4 level (20![[thin space (1/6-em)]](https://www.rsc.org/images/entities/char_2009.gif) 450 cm−1).41 Besides, all the Eu3+ transitions have the same emission spectral profiles for all the complexes, indicating the same chemical environment around the Eu3+ ion, which is in agreement with the X-ray and FTIR results for the structural similarity.
450 cm−1).41 Besides, all the Eu3+ transitions have the same emission spectral profiles for all the complexes, indicating the same chemical environment around the Eu3+ ion, which is in agreement with the X-ray and FTIR results for the structural similarity.
The radiative and non-radiative decay rate values (Table 1) of the Eu3+ 5D0 level for the tetrakis complexes were also compared to those reported in the literature for the tris hydrated complex.31,42,43 The Arad coefficient values were determined by Arad = ∑A0→J, where A0→J are the spontaneous emission coefficients of 5D0 → FJ transitions (J = 1, 2 and 4) of the Eu3+ ion and S0→J are the integrated areas under the emission curves (eqn (1)). The spontaneous emission coefficient A0→1 of the 5D0 → F1 transition is mostly governed by the magnetic dipole mechanism and depends only on the refractive index of the material. Therefore, this transition is taken as a reference.31,35
 | (1) |
 | (2) |
 | (3) |
| Complex | A rad (s−1) | A nrad (s−1) | A tot (s−1) | τ obs (ms) | Q EuEu | Q LLn (360) | Q EuLn (465) |
|---|---|---|---|---|---|---|---|
| a Ref. 31, 42, 43. | |||||||
| [Eu(btfa)3(H2O)2]a | 650 | 1982 | 2632 | 0.38 | 0.25 | ||
| [C4mim][Eu(btfa)4] | 839 | 411 | 1250 | 0.80 | 0.67 | ||
| [C4mim][Tb0.99Eu0.01(btfa)4] | 775 | 415 | 1190 | 0.84 | 0.65 | 0.35 | 0.12 |
| [C4mim][Tb0.95Eu0.05(btfa)4] | 775 | 507 | 1282 | 0.78 | 0.60 | 0.79 | 0.19 |
| [C4mim][Tb0.90Eu0.10(btfa)4] | 814 | 376 | 1190 | 0.84 | 0.68 | 0.72 | 0.28 |
This is (at least partially) because emitted power was used in the calculations.31,35 The absolute quantum yield values measured for the [C4mim][Tb1−xEux(btfa)4] compounds with excitation within the ligands (360 nm) and within the 5D2 level (465 nm) are displayed in Table 1. The larger QLLn values were found under ligand excitation being 0.35, 0.79 and 0.72, for x = 0.01, 0.05 and 0.10, respectively. The fact that the more concentrated samples (x = 0.05 and 0.10) display larger values may be related to the fact that more Eu3+ ions are located near the ligands favoring, therefore, the ligand-to-metal energy transfer. We also note that these optical data suggest no significant Eu3+/Tb3+ luminescence concentration quenching. Besides, both the emissions from the 5D0 (Eu3+) and 5D4 (Tb3+) energy levels are contributing to the absolute quantum yield values (Fig. S5, ESI†). To compare the measured QLLn values with the QEuEu ones, a selective intra-4f6 excitation is used (465 nm, Fig. S5, ESI†). Consistently, we observe that the intrinsic emission quantum yield values (QEuEu) are higher than the absolute quantum yield (QLLn), as expected.35,51
4. Thermometric characterization
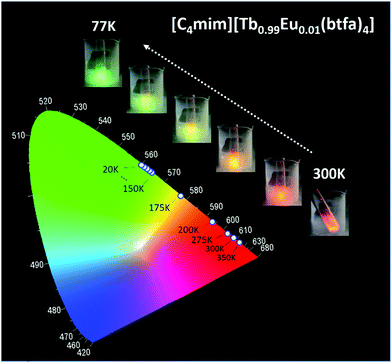
The thermometric behavior of the [C4mim][Tb1−xEux(btfa)4] complexes (x = 0.01, 0.05, 0.10) was checked recording their emission spectra from 15 to 300 K. Fig. 5 shows the corresponding CIE (Commission International de l’Éclairage) chromaticity diagram of the [C4mim][Tb0.99Eu0.01(btfa)4] compound (Table S1, ESI†). The emission color presents a shift from monochromatic red (room temperature ∼300 K) to green (liquid N2 temperature ∼77 K). Besides from being excited at the ligand absorption (360 nm), the emission spectra for the [C4mim][Tb1−xEux(btfa)4] (x = 0.01, 0.05, 0.10) complexes (Fig. 6 and Fig. S6, ESI†) were also recorded by exciting selectively at the Tb3+ ion (489 nm, 7F6 → 5D4). Based on these spectra and the integrated emission intensities from 16![[thin space (1/6-em)]](https://www.rsc.org/images/entities/char_2009.gif) 259 to 16
259 to 16![[thin space (1/6-em)]](https://www.rsc.org/images/entities/char_2009.gif) 499 cm−1 corresponding to the Eu3+ 5D0 → 7F2 (IEu) and from 17
499 cm−1 corresponding to the Eu3+ 5D0 → 7F2 (IEu) and from 17![[thin space (1/6-em)]](https://www.rsc.org/images/entities/char_2009.gif) 553 to 18
553 to 18![[thin space (1/6-em)]](https://www.rsc.org/images/entities/char_2009.gif) 640 cm−1 for the Tb3+ 5D4 → 7F5 (ITb) transitions, the ratiometric thermometric parameter Δ = ITb/IEu was calculated (Fig. 6a–d).8,10
640 cm−1 for the Tb3+ 5D4 → 7F5 (ITb) transitions, the ratiometric thermometric parameter Δ = ITb/IEu was calculated (Fig. 6a–d).8,10
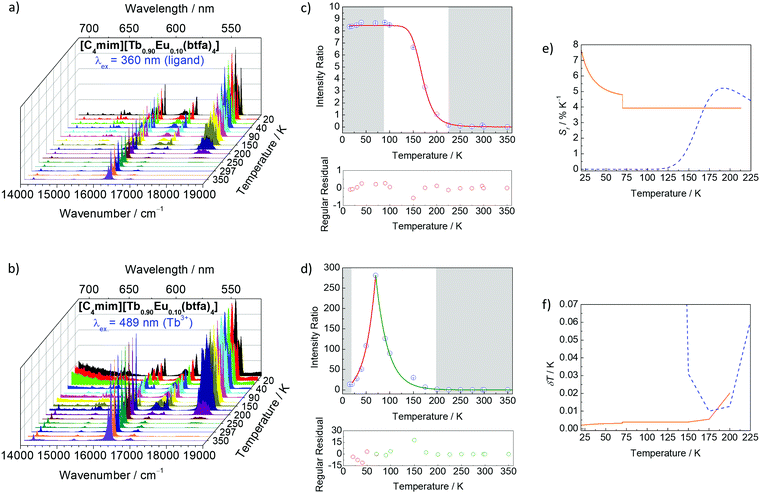 | ||
| Fig. 6 Emission spectra of the [C4mim][Tb0.90Eu0.10(btfa)4] complex recorded as a function of temperature with excitation at 360 nm (a) and 489 nm (b). In (a) the emission spectra are normalized by the intensity at 611 nm (5D0 → 7F2), while in (b) they are normalized by the maximum intensity in each individual spectrum. The 5D4 → 7F5/5D0 → 7F2 ratios measured with 360 and 489 nm are shown in (c and d), respectively. The lines represent the fits using eqn (5) and (6), respectively. The residual plot is shown on the bottom for a judgment of the fit quality. The shadowed areas mark the regions in which the thermometric parameters change within its uncertainty meaning that for these temperatures the thermometer is out of the so-called operating range. Relative thermal sensitivity (e) and temperature uncertainty (f) obtained at 360 nm (dashed line) and 489 nm (solid line). In (f), the temperature range is limited to δT < 0.07 K. | ||
As in the operating range of the [C4mim][Tb0.90Eu0.10(btfa)4] luminescent thermometer under excitation at 360 nm ITb > IEu (Fig. S7, ESI†), the temperature dependence of the ratiometric parameter Δ can be approximately described by the classical Mott–Seitz model with one non-radiative channel (eqn (4)):52
 | (4) |
![[thin space (1/6-em)]](https://www.rsc.org/images/entities/char_2009.gif) 450 cm−1) to the barycenter position (∼21
450 cm−1) to the barycenter position (∼21![[thin space (1/6-em)]](https://www.rsc.org/images/entities/char_2009.gif) 500 cm−1) of the T1 state for the btfa ligand via the 7F5 excited state.31,42,43,55,56
500 cm−1) of the T1 state for the btfa ligand via the 7F5 excited state.31,42,43,55,56
A different (ΔT) temperature dependence is observed when the [C4mim][Tb0.90Eu0.10(btfa)4] complex is selectively excited at the Tb3+ ion (Fig. 6b). The Δ values increase as the temperature increases from 15 to 70 K, decreasing, then, as the temperature increases up to 200 K, and keeping approximately constant for higher temperatures (Fig. 6d). The physical origin of this thermometric behavior is not yet clarified from a theoretical point of view and is not detailed in this work. To allow the characterization of the thermometric performance under excitation at 489 nm, the (ΔT) dependence can be empirically described by:
 | (5) |
The performance of the luminescent thermometers is made based on the relative thermal sensitivity (Sr), which is an important parameter to compare a thermometer with others, regardless of their origin, and the minimum temperature uncertainty (δT).8,10 The relative thermal sensitivity and minimum temperature uncertainty are defined as:
 | (6) |
 | (7) |
The temperature dependence of Sr and δT for the [C4mim][Tb0.90Eu0.10(btfa)4] luminescent thermometer operating under excitation at 360 and 489 nm are shown in Fig. 6e and f. Under excitation at 360 nm, the thermometer operates in the 150–225 K interval with Sr > 1% K−1 (with a maximum value Sm ∼ 5% K−1 at 200 K) and δT < 1 K. Similar results were found for [C4mim][Tb0.99Eu0.01(btfa)4] and [C4mim][Tb0.95Eu0.05(btfa)4] (Fig. S6a and b, ESI†). Furthermore, under 489 nm [C4mim][Tb0.90Eu0.10(btfa)4] can operate in the 20–200 K interval with Sr > 1% K−1 (Sm ∼ 7.6% K−1 at 20 K) and δT < 0.03 K (Fig. 6f). Previous studies on Eu3+/Tb3+-based luminescent thermometers reported higher Sm values although in narrower operating ranges (Table 1 of ref. 10, 44 and 45, as illustrative examples).10,57,58 Examples are the thermometers with Sm = 31% K−1 based on an Ln–HL MOF (Ln = Eu and Tb and HL = 5-hydroxy-1,2,4-benzenetricarboxylic acid) operating between 4 and 50 K,57 and Sm = 11% K−1 based on a complex–polymer composite of ethyl-diphenylphosphine oxide functionalized poly(dimethylsiloxane) and [Ln(bzac)3] where bzac stands for benzoylacetone (PDMS-eddpo-Ln(bzac)3; Ln = Eu and Tb) operating between 158 and 248 K.58
An insight into the mechanism for the temperature dependence of the Tb3+ and Eu3+ emissions can be provided by a simplified energy level diagram of the system (Fig. 7). The first excited triplet state (T1) barycenter of the btfa ligand is above the Tb3+ 5D4 excited state when considering the 7F5 energy level, therefore a back-transfer from the Tb3+ ion to the ligand is expected to occur at room temperature and only Eu3+ emission is observed.56 On the other hand, at lower temperatures, the back-transfer rate to the ligand should be lower and the Tb3+ emission will be predominant.35
5. Conclusions
A series of new temperature sensors based on trivalent lanthanide tetrakis complexes were synthesized successfuly by a one-pot procedure. The formula [C4mim][Tb1−xEux(btfa)4] was confirmed via CHN and TG analyses. Besides, the XPD and FTIR data alongside the photoluminescence study indicate structural similarity between the Eu3+ and Tb3+ doped complexes. The compounds exhibited relatively high absolute and intrinsic emission quantum yields (up to 0.79 and 0.68, respectively), indicating that they can also act as efficient light-converting molecular devices. The temperature dependence of the intensity ratio between the 5D4 → 7F5 (Tb3+) and 5D0 → 7F2 (Eu3+) transitions for excitation at the ligand (360 nm) in the [C4mim][Tb0.9Eu0.1(btfa)4] complex was fitted according to the Mott–Seitz model, suggesting that the depopulation of the 5D4 emitting state of the Tb3+ ion could be through thermal activation. The mechanism of this energy transfer process is still unclear, principally when the complex is selectively excited at the 5D4 state (489 nm) with this investigation being a current project in our research group. The [C4mim][Tb0.90Eu0.10(btfa)4] luminescent thermometer presented a maximum value for the relative thermal sensitivity around 7.6% at 20 K and a minimum temperature uncertainty below 0.03 K. Moreover, by using excitation at the ligand (360 nm) or the Tb3+ ion (489 nm), it is possible to shift the operating range of the thermometer with Sm > 1% in the 20–200 K and 150–225 K intervals, respectively. By combining both excitations, the luminescent thermometers can operate in an extended temperature range with a low-temperature uncertainty. These spectroscopic results show that the optical thermometers can operate under excitations at blue and UV spectral regions with very low minimal temperature uncertainty (below 0.01 K) with high emission quantum yields (∼0.70). Therefore, the [C4mim][Tb1−xEux(btfa)4] luminescent materials can be applied as precise photonic temperature sensors.Conflicts of interest
There are no conflicts to declare.Acknowledgements
The authors are grateful the Brazilian funding agencies: Conselho Nacional do Desenvolvimento Científico e Tecnológico – CNPq (Grant no. 103151/2018-4, Project no. 427733/2016-2), Fundação de Amparo à Pesquisa do Estado de São Paulo (FAPESP). This work was developed within the scope of the project CICECO-Aveiro Institute of Materials, UIDB/50011/2020 & UIDP/50011/2020, financed by national funds through the Portuguese Foundation for Science and Technology/MCTES. A. M. P. Botas acknowledges the grant financed by SusPhotoSolutions project CENTRO-01-0145-FEDER-000005.Notes and references
- P. R. N. Childs, J. R. Greenwood and C. A. Long, Rev. Sci. Instrum., 2000, 71, 2959–2978 CrossRef.
- L. Shi, C. Dames, J. R. Lukes, P. Reddy, J. Duda, D. G. Cahill, J. Lee, A. Marconnet, K. E. Goodson, J. H. Bahk, A. Shakouri, R. S. Prasher, J. Felts, W. P. King, B. Han and J. C. Bischof, Nanoscale Microscale Thermophys. Eng., 2015, 19, 127–165 CrossRef.
- D. Jaque, E. Martín, L. Martínez and P. Haro, Nanomedicine, 2014, 9, 1047–1062 CrossRef PubMed.
- A. S. Souza, L. A. O. Nunes, I. G. N. Silva, F. A. M. Oliveira, L. L. Da Luz, H. F. Brito, M. C. F. C. Felinto, R. A. S. Ferreira, S. A. Júnior, L. D. Carlos and O. L. Malta, Nanoscale, 2016, 8, 5327–5333 RSC.
- Y. Cui, H. Xu, Y. Yue, Z. Guo, J. Yu, Z. Chen, J. Gao, Y. Yang, G. Qian and B. Chen, J. Am. Chem. Soc., 2012, 134, 3979–3982 CrossRef CAS PubMed.
- R. Piñol, C. D. S. Brites, R. Bustamante, A. Martínez, N. J. O. Silva, J. L. Murillo, R. Cases, J. Carrey, C. Estepa, C. Sosa, F. Palacio, L. D. Carlos and A. Millán, ACS Nano, 2015, 9, 3134–3142 CrossRef PubMed.
- Z. Wang, D. Ananias, A. Carné-Sánchez, C. D. S. Brites, I. Imaz, D. Maspoch, J. Rocha and L. D. Carlos, Adv. Funct. Mater., 2015, 25, 2824–2830 CrossRef CAS.
- C. D. S. Brites, P. P. Lima, N. J. O. Silva, A. Millán, V. S. Amaral, F. Palacio and L. D. Carlos, Nanoscale, 2012, 4, 4799–4829 RSC.
- D. Jaque and F. Vetrone, Nanoscale, 2012, 4, 4301–4326 RSC.
- C. D. S. Brites, S. Balabhadra and L. D. Carlos, Adv. Opt. Mater., 2018, 7, 1801239 CrossRef.
- X. D. Wang, O. S. Wolfbeis and R. J. Meier, Chem. Soc. Rev., 2013, 42, 7834–7869 RSC.
- S. W. Allison, Meas. Sci. Technol., 2019, 30, 072001 CrossRef CAS.
- M. I. J. Stich, L. H. Fischer and O. S. Wolfbeis, Chem. Soc. Rev., 2010, 39, 3102–3114 RSC.
- D. Yang, Z. Li, L. He, Y. Deng and Y. Wang, RSC Adv., 2017, 7, 14314–14320 RSC.
- Z. Li, Z. Hou, D. Ha and H. Li, Chem. – Asian J., 2015, 10, 2720–2724 CrossRef CAS PubMed.
- T. Wang, P. Li and H. Li, ACS Appl. Mater. Interfaces, 2014, 6, 12915–12921 CrossRef CAS.
- X. Y. Xu and B. Yan, J. Mater. Chem. C, 2016, 4, 1543–1549 RSC.
- D. Ananias, F. A. A. Paz, D. S. Yufit, L. D. Carlos and J. Rocha, J. Am. Chem. Soc., 2015, 137, 3051–3058 CrossRef CAS.
- C. D. S. Brites, P. P. Lima, N. J. O. Silva, A. Millán, V. S. Amaral, F. Palacio and L. D. Carlos, Adv. Mater., 2010, 22, 4499–4504 CrossRef CAS.
- S. Sato, R. Yamaguchi and T. Nose, J. Inst. Electron., Inf. Commun. Eng., 1989, J72-C2, 906 Search PubMed.
- D. Mara, F. Artizzu, B. Laforce, L. Vincze, K. Van Hecke, R. Van Deun and A. M. Kaczmarek, J. Lumin., 2019, 213, 343–355 CrossRef CAS.
- R. Boddula, K. Singh, S. Giri and S. Vaidyanathan, Inorg. Chem., 2017, 56, 10127–10130 CrossRef CAS.
- P. K. Shahi, A. K. Singh, S. K. Singh, S. B. Rai and B. Ullrich, ACS Appl. Mater. Interfaces, 2015, 7, 18231–18239 CrossRef CAS PubMed.
- S. V. Eliseeva and J. C. G. Bünzli, Chem. Soc. Rev., 2010, 39, 189–227 RSC.
- A. De Bettencourt-Dias, P. S. Barber and S. Viswanathan, Coord. Chem. Rev., 2014, 273–274, 165–200 CrossRef CAS.
- M. H. V. Werts, R. T. F. Jukes and J. W. Verhoeven, Phys. Chem. Chem. Phys., 2002, 4, 1542–1548 RSC.
- W. M. Faustino, L. A. Nunes, I. A. A. Terra, M. C. F. C. Felinto, H. F. Brito and O. L. Malta, J. Lumin., 2013, 137, 269–273 CrossRef CAS.
- D. Parker, Coord. Chem. Rev., 2000, 205, 109–130 CrossRef CAS.
- N. Shrivastava, L. U. Khan, Z. U. Khan, J. M. Vargas, O. Moscoso-Londoño, C. Ospina, H. F. Brito, Y. Javed, M. C. F. C. Felinto, A. S. Menezes, M. Knobel and S. K. Sharma, J. Mater. Chem. C, 2017, 5, 2282–2290 RSC.
- L. C. V. Rodrigues, J. Hölsä, M. Lastusaari, M. C. F. C. Felinto and H. F. Brito, J. Mater. Chem. C, 2014, 2, 1612–1618 RSC.
- G. F. De Sá, O. L. Malta, C. De Mello Donegá, A. M. Simas, R. L. Longo, P. A. Santa-Cruz and E. F. da Silva, Coord. Chem. Rev., 2000, 196, 165 CrossRef.
- O. L. Malta and L. D. Carlos, Quim. Nova, 2003, 26, 889–895 CrossRef CAS.
- N. Sabbatini, M. Guardigli and J. M. Lehn, Coord. Chem. Rev., 1993, 123, 201–228 CrossRef CAS.
- S. I. Weissman, J. Chem. Phys., 1942, 10, 214–217 CrossRef CAS.
- A. N. Carneiro Neto, E. E. S. Teotonio, G. F. de Sá, H. F. Brito, J. Legendziewicz, L. D. Carlos, M. C. F. C. Felinto, P. Gawryszewska, R. T. Moura, R. L. Longo, W. M. Faustino and O. L. Malta, in Handbook on the Physics and Chemistry of Rare Earths, ed. J. C. G. Bünzli and V. K. Pecharsky, Elsevier, Amsterdan, Netherlands, 2019, ch. 310, vol. 56 Search PubMed.
- S. Biju, D. B. Ambili Raj, M. L. P. Reddy and B. M. Kariuki, Inorg. Chem., 2006, 45, 10651–10660 CrossRef CAS.
- A. Mech, M. Karbowiak, C. Görller-Walrand and R. Van Deun, J. Alloys Compd., 2008, 451, 215–219 CrossRef CAS.
- T. R. Faulkner and F. S. Richardson, Mol. Phys., 1978, 35, 1141–1161 CrossRef CAS.
- S. Salama and F. S. Richardson, J. Phys. Chem., 1980, 84, 512–517 CrossRef CAS.
- S. M. Bruno, R. A. S. Ferreira, F. A. A. Paz, L. D. Carlos, M. Pillinger, P. Ribeiro-Claro and I. S. Gonçalves, Inorg. Chem., 2009, 48, 4882–4895 CrossRef CAS PubMed.
- M. Ren, C. D. S. Brites, S. S. Bao, R. A. S. Ferreira, L. M. Zheng and L. D. Carlos, J. Mater. Chem. C, 2015, 3, 8480–8484 RSC.
- C. De Mello Donegá, S. Alves, O. L. Malta and G. F. De Sá, Mater. Sci. Forum, 1999, 315–317, 204–210 Search PubMed.
- C. De Mello Donegá, S. Alves and G. F. De Sá, J. Alloys Compd., 1997, 250, 422–426 CrossRef.
- R. S. Varma and V. V. Namboodiri, Chem. Commun., 2001, 643–644 RSC.
- J. Mooney and P. Kambhampati, J. Phys. Chem. Lett., 2013, 4, 3316–3318 CrossRef CAS.
- S. Biju, R. O. Freire, Y. K. Eom, R. Scopelliti, J. C. G. Bünzli and H. K. Kim, Inorg. Chem., 2014, 53, 8407–8417 CrossRef CAS.
- T. Rajkumar and G. Ranga Rao, Mater. Chem. Phys., 2008, 112, 853–857 CrossRef CAS.
- W. T. Carnall, G. L. Goodman, K. Rajnak and R. S. Rana, J. Chem. Phys., 1989, 90, 3443–3457 CrossRef CAS.
- A. N. Carneiro Neto, R. T. Moura, A. Shyichuk, V. Paterlini, F. Piccinelli, M. Bettinelli and O. L. Malta, J. Phys. Chem. C, 2020, 124, 10105–10116 CrossRef CAS.
- F. S. Richardson, Chem. Rev., 1982, 82, 541–552 CrossRef CAS.
- L. D. Carlos, R. A. S. Ferreira, V. de, Z. Bermudez and S. J. L. Ribeiro, Adv. Mater., 2009, 21, 509–534 CrossRef CAS PubMed.
- C. D. S. Brites, A. Millán and L. D. Carlos, in Handbook on the Physics and Chemistry of Rare Earths, ed. J. C. G. Bünzli and V. K. Pecharsky, Elsevier, Amsterdam, Netherlands, 2019, ch. 310, vol. 49 Search PubMed.
- N. F. Mott, Proc. R. Soc. London, Ser. A, 1938, 167, 384–391 Search PubMed.
- F. Seitz, Trans. Faraday Soc., 1939, 35, 74–85 RSC.
- S. Sato and M. Wada, Bull. Chem. Soc. Jpn., 1970, 43, 1955–1962 CrossRef CAS.
- A. S. Souza, L. A. Nunes, M. C. F. C. Felinto, H. F. Brito and O. L. Malta, J. Lumin., 2015, 167, 167–171 CrossRef CAS.
- X. Liu, S. Akerboom, M. De Jong, I. Mutikainen, S. Tanase, A. Meijerink and E. Bouwman, Inorg. Chem., 2015, 54, 11323–11329 CrossRef CAS PubMed.
- D. A. Gálico, Í. O. Mazali and F. A. Sigoli, New J. Chem., 2018, 42, 18541–18549 RSC.
Footnote |
| † Electronic supplementary information (ESI) available. See DOI: 10.1039/d0ma00201a |
| This journal is © The Royal Society of Chemistry 2020 |

