 Open Access Article
Optimizing geographic locations for electric vehicle battery recycling preprocessing facilities in California
Megan W.
Haynes
a,
Rodrigo Cáceres
González
*a and
Marta C.
Hatzell
 *ab
*ab
aGeorge W. Woodruff School of Mechanical Engineering, Georgia Institute of Technology, USA. E-mail: Marta.hatzell@me.gatech.edu
bSchool of Chemical and Biomolecular Engineering, Georgia Institute of Technology, USA
First published on 20th December 2023
Abstract
Spent lithium-ion batteries (LIBs) at end of life pose several safety risks. Specifically, LIBs have the potential to self-ignite during transport, release toxic compounds during incineration, and can leach contaminants into landfills. Spent LIBs, which are classified as hazardous waste, are also subject to numerous policies and require disposal by certified personnel and companies. These requirements result in an increase in transport costs and volume compared to other waste. Efforts to improve LIB recycling focus primarily on reducing costs to make recycling economically profitable. The greatest emphasis is placed on improving recycling technologies; however, transport costs significantly impact the total cost of LIB recycling. Here, we provide a procedure for choosing an unsupervised machine learning clustering heuristic to identify optimal locations for LIB recycling preprocessing facilities in California. The identified decentralized facility locations minimize the transportation distance and the cost of shipping spent electric vehicle batteries between end-use sector facilities and potential second-use locations.
Sustainability spotlightThe extraction of raw materials has significant environmental impacts because most extraction processes produce large amounts of harmful pollutants. Although electric vehicles have a lower carbon footprint than traditional combustion engines, over their lifetime, due to these extraction processes, lithium-ion battery manufacturing can produce up to 68% more emissions. There are also significant social impacts associated with mining minerals for batteries and numerous human rights abuses reported. Thus, to ensure sustainable consumption and production of materials (UN Development Goal 12) for electric vehicles, new processes are needed to allow for effective recycling. Here we examine what a lithium-ion battery recycling infrastructure may look like in the state of California. |
1 Introduction
The life cycle of a lithium ion battery (LIB) begins with the extraction of raw materials, followed by material processing, refining, and component manufacturing. As LIBs reach the end-use sector, LIBs are often disposed of as waste. Intact LIBs are considered hazardous materials, and therefore transporting end-of-life (EoL) spent LIBs to waste or recycling facilities must comply with strict regulations and can be expensive.1–3 Once the LIB is transported to recycling facilities, the LIBs are sorted, disassembled, and preprocessed prior to material recovery. Mechanical preprocessing separation processes can include crushing, sieving, and magnetic or gravimetric separation.4Preprocessing separates the majority of battery casing materials, plastics, iron, and current collectors within the lithium-ion battery from the active electrode materials, or black mass, which is a powder containing the cathode materials including lithium. The former materials can go to traditional recycling methods.5 The black mass can comprise approximately 50% of the total mass of an intact LIB.6 The black mass that is still considered hazardous contains the active materials of the LIB, and this is the basis for further processes using material recovery technologies. Material recovery is often achieved using hydrometallurgy, which separates the active LIB material.7
Therefore, the development of facilities that separate preprocessing from material recovery could allow for a more rapid collection of batteries because the preprocessing facilities could be placed near the end-use sector of LIBs and consequently reduce the amount of hazardous material in transit. This could help reduce the transportation costs associated with LIB recycling.8,9 The black mass is also inert, so there is no risk of thermal runaway, fires, and/or explosions during transport of the black mass. Furthermore, because the material is no longer volatile, black mass can be packed more densely without the additional dunnage required to transport an intact LIB. This reduces costs and improves the safety of personnel.1 As the LIB lifecycle moves towards a circular economy, a second use can be added to reallocate the end-of-life (EoL) LIBs used to a lower-capacity application before being transported to a recycling facility (Fig. 1).
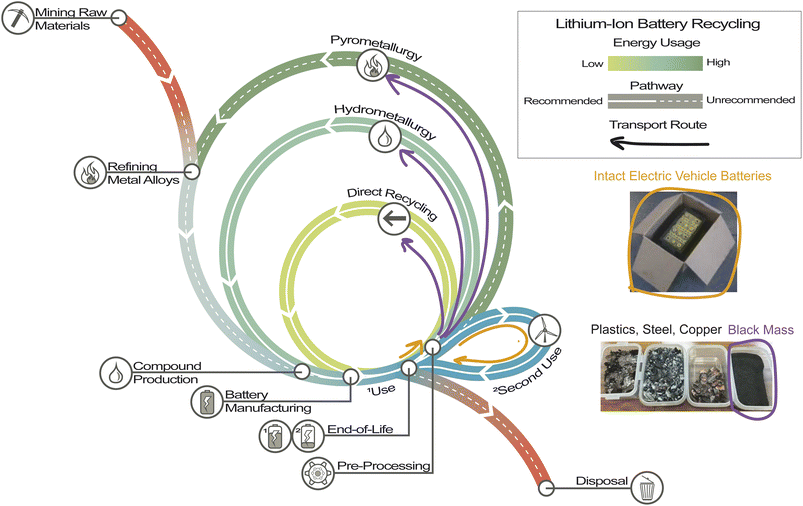 | ||
| Fig. 1 The circular economy of the LIB lifecycle. Photo of separated materials after mechanical preprocessing from an announcement for the Recyclus group.12 Photo of an intact EVB being shipped from an eBook that contains comprehensive packing and shipping strategies.13 Inspired by the ReCell Center diagram from an article on the recycling of critical materials in the LIB supply chain.14 | ||
Currently, commercial recycling facilities tend to focus on large centralized material recovery, as these tend to be batch processes that have significantly lower operational and material costs as they increase in scale. Unlike material recovery, mechanical preprocessing does not necessarily follow the economy of scale and can be applied to smaller facilities in urban environments.10 Decentralized dismantling and preprocessing facilities in Europe were found to reduce transportation costs by half and were more economical even when calculating the amortization costs of the new facilities.9 The locations of these preprocessing facilities will also be affected by the second use of the LIB and the establishment of localized facilities would be advantageous to the EoL LIB industry.7,11
When examining the cost associated with battery (LIB) recycling, transport of spent LIBs to recycling facilities is the most significant contributor to the total cost.11,15 Estimates of transportation costs vary widely, but on average represent 41% of the total cost of recycling.11 However, research efforts focused on LIB recycling focus primarily on reducing the cost associated with an individual recycling technology. For example, in a recent review of LIB recycling, 155 unique sources focused on technologies and processes.4 In contrast, the most recent review of peer-reviewed literature on end-of-life transport (EoL) of LIBs reports only 36 articles that examined the economic or environmental impacts associated with LIB transport.11,16,17 There are even fewer investigations that discuss geographic considerations for recycling LIBs.18,19
Unsupervised machine learning (ML) clustering methods coupled with location analysis can provide valuable information when considering the logistics and optimization of transportation networks.20 The benefits of unsupervised ML are the ability to handle complex, high-dimensional unstructured data sets with more efficiency and adaptability than hardcoded statistical models.21 Clustering is an unsupervised ML method that segments a collection of n objects into subsets or clusters p or k and is often used for geospatial analysis. In general, there is no calculable solution and there is usually a lack of data to validate the results of the model.22 In supervised clustering, an external validation technique, called testing, can be implemented, which compares the solutions with the data with known labels. However, the validation test a poor indicator of success when using spatial data.23 Furthermore, no single clustering method is capable of consistently outperforming all others under every circumstance, as each heuristic can be more suitable depending on the data and the application.24,25 Spatially constrained multivariate clustering analysis (SCMCA) heuristics, a subset of unsupervised clustering with contiguity constraints, have also been established to be highly sensitive to input parameters, data, and application.23 In general, a single clustering heuristic is used in network applications to generate solutions unless a new ML algorithm is introduced and a comparison between heuristics is provided.26–29
These concerns demonstrate the importance of using various clustering methods to methodically determine the effects of input criteria on solutions.24 In addition, the challenge of confirming and validating the results makes back-end verification of the results crucial for unsupervised ML. Due to these considerations, it could be beneficial to establish a standard practice to generate and verify solutions from various algorithms when applying unsupervised clustering ML heuristics to network optimization applications. Here, we perform various clustering methods to methodically identify the best location for lithium-ion battery preprocessing facilities. We aim to minimize the distance for collection and transport for second use.
2 Methods
The projected volumes of EoL and available for second use (AF2) EVB are obtained from the Circular Energy Storage (CES) online database and distributed among counties in the United States using EV registrations and population data to approximate the end use sectors.30–32 Current EV registration is used as EVBs typically have a useful life of 8 to 10 years.30,31 Furthermore, auto dealers and battery collection centers have previously been shown to correlate with population size, which could correspond to end-use sectors.16 Additionally, it is likely that most EVBs will reach EoL in the same region as originally purchased by the consumer.9 While it would be informative to examine the entire United States, we restrict this analysis to California. California is chosen for the case study because according to current EV registration data from the Alternative Fuels Data Center, approximately 43% of all EVBs in the United States will reside in California.31The potential second use of LIBs can include a variety of energy requirements and use in mobile or stationary applications. However, stationary energy storage has received greater attention in industry due to the growing demand for electrical energy storage.33 The second-use application considered in the location analysis is stationary back-up energy storage for communities at high risk for losing power during natural disasters and inclement weather. The National Risk Index (NRI) of the United States Federal Emergency Management Agency (FEMA) has determined a quantitative score for these at-risk populations. The NRI was designed and built in close collaboration with the local, state, and federal governments, as well as private industry. This index was intended, among other reasons, to support decisions that prioritize and allocate resources, update emergency operations plans, and improve hazard mitigation plans.34 The potential distribution of the available second-use EVBs to smaller local communities may be sufficient to provide the necessary resilience for short-term backup energy storage. Alternative applications of second-use in grid-scale energy storage were not considered because the total capacity of EoL EVBs is likely to not be able to support the large energy requirements necessary.33 Furthermore, renewable energy applications that are not residential in scale could also require too much capacity, and many renewable energy facilities will be inoperable during inclement weather scenarios.
Following data preparation, the main methodology consists of two main parts, choosing an SCMCA heuristic for the clustering process and implementing a staged development scenario to determine preprocessing facility locations in California through 2030. Choosing a particular SCMCA heuristic is composed of five steps: clustering analysis, location analysis, performance evaluation, sensitivity analysis, and verification. The staged development scenario is composed of four steps, which are similar to choosing an SCMCA: clustering analysis, location analysis, performance evaluation, and verification.
2.1 Spatially constrained multivariate clustering analysis
The first step in choosing an SCMCA is to group the counties, called spatial units n, based on the distribution of EoL EVB. Each cluster p formed will represent the counties served by a single pre-processing facility. The main goal of the clustering analysis is to generate clusters which reduce the distance that an intact EVB would need to travel from the end-use sector to the preprocessing facility.Due to the nature of the np-hard problem, using unlabeled multivariate data with inflexible contiguity constraints, only SCMCA methodologies were considered for this study. The heuristics used in this study are Spatial C (K) Cluster Analysis by Tree Edge Removal (SKATER), Spatially Constrained Hierarchical Clustering (SCHC), Regionalization with Dynamically Constrained Agglomerative Clustering and Partitioning (REDCAP), Automatic Zoning Procedure (AZP), and Maximum-P Regionalization (Max-P). These algorithms represent a mix of partitioning and hierarchical unsupervised ML deterministic clustering methods that differ in the method of cluster generation. Additionally, each heuristic is initially compared with the Total within-cluster Sum-of-Squares (TWSS), also known as the Sum-of-Squares (SS), which is the most common approach to define similarity through minimization of intracluster distance. All of these algorithms are implemented based on the PyGeoDa documentation of open source Geographic Data Analysis (GeoDa) spatial analysis software.35,36
Unsupervised clustering is generally considered a more difficult process than supervised ML methods and every algorithm operates differently with differing data types.24 Due to this, it is imperative to compare multiple heuristics when generating clustering solutions. Additionally, there is typically no calculable solution for these types of problem, making sensitivity analyzes and back-end verification crucial for analyzing the solutions obtained through clustering. Furthermore, the solutions of the ML algorithm can vary greatly depending on the input parameters used. Therefore, sound reasoning and methodical investigation of how the unique input parameters of each heuristic affect the solution sets are imperative to appropriately determine the optimal solution sets. To verify the results of this analysis, the various heuristics will be compared using two criteria, TWSS and freight capacity, to determine the optimal clustering results among the different solution sets, and the results will be compared to determine the sensitivity of the heuristic type based on initial guess locations.
The heuristics can generate a range of solutions from 1–57 clusters corresponding to the number of counties. Suboptimal solutions are solutions that do not most minimize the TWSS for the same number of clusters. Optimal solution sets are retained from each heuristic by removing the dominated solutions, similar to a Pareto front in multi-objective optimization. The optimal solution sets are then compared in an elbow graph, which is a common way to compare clustering solutions. An elbow graph displays the relationship between the number of clusters and the TWSS for each solution.
The elbow region of the graph can then be determined which represents the appropriate range of cluster sizes for the data. The elbow region is a range over the highest point of inflection where the decrease in TWSS becomes less rapid as the number of clusters increases. In this application, a lower TWSS correlates to a shorter distance between the EoL CA counties and the preprocessing facility, a lower number of clusters correlates to fewer facilities and therefore less capital costs, and the elbow region represents where the TWSS is most minimized with a smaller number of facilities.
 | (1) |
 | (2) |
The calculation of freight capacity for each heuristic solution is as follows:
 | (3) |
 | (4) |
Additionally, a probabilistic location analysis is then implemented to visually investigate the relationship between the potential deterministic facility locations generated by the heuristics. Probabilistic location analysis uses kernel density estimation (KDE). KDE is an empirical approximation of the probabilistic density function (PDF), which represents the probability that a given random variable will occur within a certain space. The KDE algorithm is implemented through Seaborn in Python, which utilizes a Gaussian kernel to determine the theoretical probability distribution.
2.2 Staged development
A staged development scenario can be used for industry applications to determine at what time facilities should be constructed or expanded to efficiently manage the facility economics and implement increased capacity to scale proportionally as the industry grows. To simulate a staged development scenario, the CES EoL EVB and AF2 EVB year-over-year (YOY) data are distributed every two years representing the amount of new capacity required to process the volume of EVB entering the recycling market.The first step of the staged development scenario includes a cluster analysis. A similar methodology to choosing an SCMCA is implemented including a robust parameter tuning process and obtaining optimal solution sets. The difference in methodology here is that the process is repeated for each stage using only the chosen SCMCA heuristic. Second, location analysis is used to generate deterministic facility locations for each solution once again using the Center-of-Gravity method for both transportation scenarios.
For performance evaluation, all possible permutations within the chosen cluster range for each stage will be considered (eqn (5)):
 | (5) |
In this case, s represents the possible number of facilities constructed or expanded at each stage, equivalent to the cluster range, with four defined stages: years 2024, 2026, 2028, and 2030. For each staged development scenario, a cumulative freight capacity for both transportation scenarios will be calculated (eqn (6)):
| FT = 7FT1 + 5FT2 + 3FT3 + FT4 | (6) |
The cumulative freight capacity is representative of the total transportation costs in the scenario accumulated by each facility over the time period the facility is operating. Cumulative freight capacity is used as the primary criterion for determining the scenarios that minimize the transportation costs the most in the lowest number of new facilities built. Following the selection of viable staged development scenarios, the verification step is performed in the same way as choosing an SCMCA.
3 Results and discussion
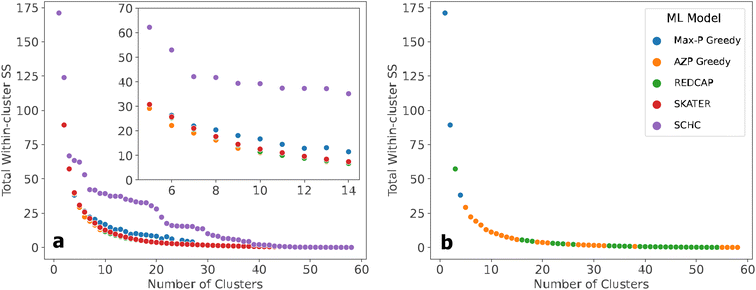
The elbow graph of the optimal solution sets from each SCMCA resemble decay functions. The elbow graph begins with a high positive TWSS and decreases at a decreasing rate as the number of clusters increased (Fig. 2). Varying the four linkage methods for SCHC was found to have no effect on the results, as each method produced the same solutions. Additionally, when comparing the elbow graph to the other hierarchical clustering methods used in this analysis, SKATER and REDCAP, the elbow graph appeared to resemble a stepwise decay with a much greater TWSS. The difference in the appearance of the optimal SCHC solution set compared to the other heuristics is evident (Fig. 2).Additionally, varying the five available linkage methods in the REDCAP heuristic produced very similar solutions for all results, suggesting that the optimal solution set has a low sensitivity to the linkage method. Although full-order complete linkage had the highest number of optimal solutions, full-order single linkage found nine of the ten optimal solutions within the elbow region; seven of these solutions were unique to that particular linkage method, suggesting that full-order single linkage was the most appropriate method when utilizing REDCAP.
When tuning the parameters while utilizing the AZP heuristic, the number of construction re-runs was found to have a large affect on the TWSS of the generated solutions. There was no ostensible correlation between the TWSS, the number of clusters, and the number of construction reruns, but the solution that minimized the TWSS was found within 500 reruns. Similarly to AZP, the Max-P algorithm did not seem to have a predictable number of iterations to find the optimal solution, but the optimal solution was generally found within 900 iterations.
Tuning the parameters used for each heuristic is crucial, as the tuning process was found to generate highly varied solutions when utilizing the majority of these heuristics in this analysis. Although varying linkage methods in the hierarchical clustering techniques typically affected the outcome of these heuristics, the impact on the optimal solution sets was much less than the influence of construction reruns and iterations when using the partitioning algorithms, AZP and Max-P. This is most likely due to the hierarchical methods constructing the dendrograms based on the contiguity, determined by the linkage method, but the partitioning algorithms used the iterations and reruns to adjust the initial guess locations, which ML algorithms are typically very sensitive to. The ability to adjust this parameter is a significant advantage over using the AZP and Max-P algorithms.
At a lower number of clusters, a combination of the Max-P Greedy algorithm, AZP, and REDCAP generated solutions that are retained in the overall optimal solution set when comparing TWSS (Fig. 2). At a higher number of clusters, AZP and REDCAP generated all optimal solutions. When analyzing all of the modeling results as a whole, the approximate elbow region contains 5–14 clusters or 5–14 possible facilities. A closer look at the elbow region of the results reveals a general trend in greatest to worst performance, beginning with the AZP Greedy algorithm, followed by REDCAP and SKATER, which had similar performance, the Max-P Greedy algorithm, and finally SCHC, which had much poorer performance relative to the other heuristics (Fig. 2). As a result of the clustering analyses which compare the solutions of the SCMCA heuristics, the AZP Greedy algorithm was found to be the method which generated solutions that most minimized the intracluster distance criterion (TWSS).
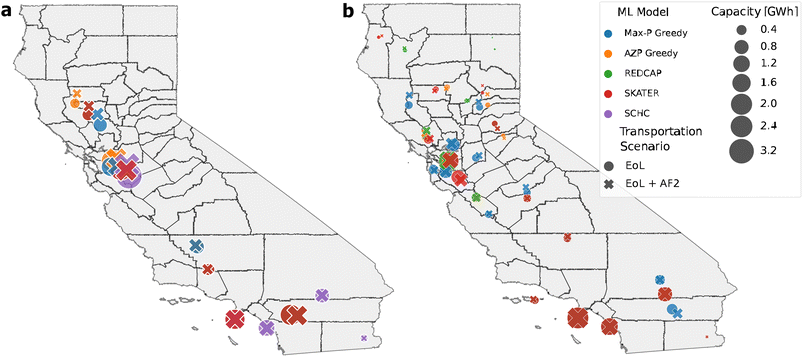
The deterministic location results of the SCMCA heuristics are displayed for the 5-cluster and 14-cluster solutions for both transportation scenarios (Fig. 3). The second transportation scenario, which includes the second use, does not greatly affect the location of the facility. However, a larger change in the second use location is apparent in the northern region of CA, suggesting a higher sensitivity to second use in those locations.
When considering only five facilities, there seems to be relatively consistent agreement between all heuristics, as the locations are within a similar vicinity, especially in the northern region of CA. SCHC again provides clustering results that are more dissimilar from the other SCMCA heuristics. When considering 14 total facilities, the locations appear to be less coordinated than the results for five clusters. However, all heuristics provided solutions that required most of the facilities in the lower northern region of CA, indicating a greater need for multiple facilities concentrated in that area.
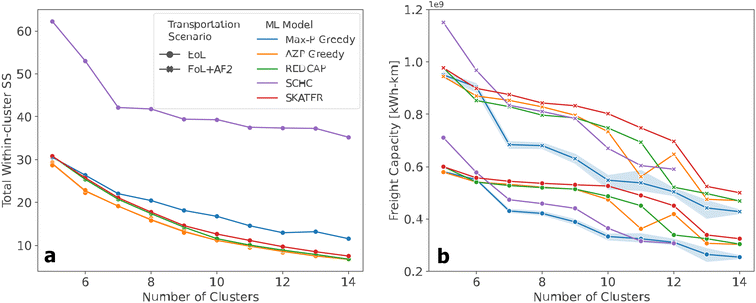
When considering only TWSS, there is a clear consistency between SCMCA performance (Fig. 4). However, after applying the freight capacity, the relative ability of each heuristic to minimize the overall freight capacity in the elbow region becomes less consistent. As expected, freight capacity generally decreases as the number of clusters, or facilities, increases as an increase in smaller, more decentralized facilities decreases the distance that intact EVBs would need to transport to the facilities (Fig. 4). Furthermore, the freight capacity corresponding to the first transportation scenario is always lower than the freight capacity representing the second transportation scenario.
Interestingly, although AZP provided the most optimal solutions when considering TWSS, the generated solutions had a relatively high freight capacity at a higher number of clusters, similar to SKATER and REDCAP, despite all three heuristics providing relatively good solutions at a low number of clusters. An unexpected transition also occurs with the AZP algorithm in 12 clusters, where the added facility increases the freight capacity rather than decreasing it. Another unanticipated finding when applying the second criterion is the overall trend by the Max-P algorithm, which shows that the solutions of the Max-P model are preferable to the other heuristics, as they most minimize the combined freight capacity of the facilities.
Then a sensitivity analysis was performed on the heuristics that generated the best solutions relative to the criteria, AZP which minimized the most the distance between the clusters (TWSS) and Max-P, which minimized the maximum freight capacity (Fig. 4). The new solutions generated by AZP are similar to the original model, indicating that adjusting the initial guess of AZP has very little effect on the outcome of TWSS for optimal solutions. In contrast, the sensitivity of the Max-P with respect to the freight capacity criterion is much greater and is visible among the other heuristics used in the analysis. Furthermore, as the second use location is implemented, there is a higher variation in the optimal solutions presented by the Max-P algorithm. It is important to note that although the sensitivity is higher for Max-P than for AZP for the respective criteria, the variation in the Max-P solutions are still generally the solutions that most minimize the freight capacity when compared against the other heuristics.
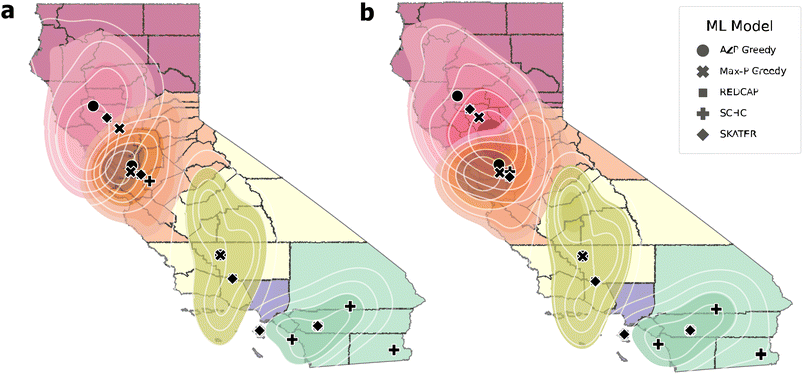
To further verify the results of the AZP and Max-P solutions, a probabilistic location analysis based on the heuristic criteria most minimized was performed to compare the facility locations determined for the 5-group solutions (Fig. 5). KDE probability contours for the location of the facilities represent the probability intervals of 20% within each clustered region. The KDE contours and the deterministic locations are weighted based on the two transportation scenarios. The clusters generated by the heuristics are very similar and change only in the northern half of CA, where there is also greater overlap between probability contours.
With the exception of the yellow cluster, AZP is more centered within the highest density probability contour, verifying its ability to minimize the transportation distance of the first scenario (Fig. 5a). Including second use shifts the probability contours, centering Max-P more than the other heuristics, confirming its ability to minimize transportation costs of the second scenario (Fig. 5b).
The deterministic locations shift only slightly when introducing the second-use distribution, but the probability contours display a greater shift in the northern region where there is considerable overlap among the contours between clusters. This suggests that facility locations are more sensitive to second use in northern CA and there are more possible locations in this region. Additionally, all of the SCMCA heuristics generate clustering solutions which coordinate facility locations close together in each region and typically within the more dense probability contours, further confirming the ability for the heuristics to cluster the CA counties based on multiple criteria.
The comparison between the various SCMCA heuristics confirmed that the partitioning algorithms, AZP and Max-P, were highly sensitive to the parameters which correlated to initial guess locations, which in this case corresponded to construction reruns and the number of iterations, while the hierarchical methods had a very low sensitivity to the linkage method. The ability to easily adjust the initial guess location is a significant advantage to utilizing AZP and Max-P and in this particular scenario these two partitioning methods were found to outperform the other heuristics which used hierarchical methods with regard to the chosen criteria for this analysis.
As suggested in the PyGeoDa documentation, utilizing REDCAP with the first-order single linkage approach generated the same results as utilizing the SKATER heuristic, suggesting that as long as parameter tuning is executed, it is unnecessary to include SKATER in the heuristic comparison as the same methodology and results will be performed by REDCAP.35 Furthermore, because the full-order link is more robust and representative of the clusters as a whole, it was confirmed to outperform the first-order link methods in this analysis.37
Based on minimization of freight capacity from both EoL EVB sectors, the potential second-use location, the sensitivity analysis of the criteria, and the verification of facility locations considering both transportation scenarios, the Max-P Greedy heuristic appears to be the preferred SCMCA method for these data and application and is therefore used for the staged development case study. It is important to note that although two criteria were used to determine relative performance in the SCMCA, subsequent analyzes can contain far more criteria for that determination, including land cost data, socio-economic impacts, greenhouse gas emissions, and transport time, among others, which are relevant to the application of that subject.
Because the EoL EVB data for each year have the same distribution, the Max-P model generated the same clustering for each year, each solution achieved through a unique set of input parameters. Due to the clustering results for the same number of clusters being the same for each time period, the deterministic and probabilistic location analysis also revealed that the facility locations within these clusters are the same for each year when considering only the first transportation scenario. However, the location of the facilities between years is slightly affected when considering the second transportation scenario.
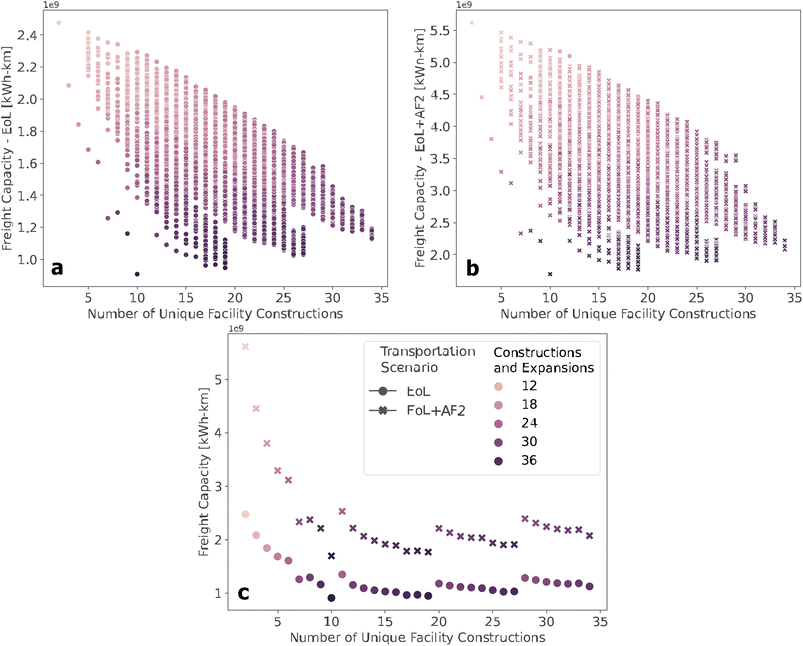
The cumulative freight capacity of every possible permutation for the construction or expansion of 2–10 facilities every two years from 2024 to 2030 is compared according to the transportation scenario (Fig. 6). The graph compares the cumulative freight capacity with the number of unique facilities constructed between 2024 and 2030. The color corresponds to the total number of unique facilities combined with the number of expansions completed. For results lower than approximately 15 unique constructed facilities, there are staged development scenarios which have a clear benefit over all other scenarios, while above 15 unique facilities there appear to be multiple solutions which yield approximately the same overall freight capacity and, therefore, would have roughly the same total transportation costs over the time frame of this analysis. Additionally, as the unique number of facilities increases, the number of new constructions and expansions also increases while lowering the freight capacity, suggesting that the most appropriate staged development scenario likely involves all of the preprocessing facilities being constructed at once with a lower capacity and expanding with time to manage the increase of EoL EVBs.
The optimal set of stages of development scenarios based on the total number of new facilities by 2030 is determined by removing the solutions that do not minimize the freight capacity (Fig. 6c). Choosing solutions based on the freight capacity is similar to the methodology for choosing an SCMCA heuristic. If there are scenarios that have similar freight capacity, the lowest possible number of unique facilities should have preference due to lower capital and operational costs. The scenario that minimizes cumulative freight capacity is 10 facilities. Due to this, any scenarios that exceed 10 total facilities by 2030 should be removed from consideration.
Additionally, it is apparent that there are no other scenarios which minimize the freight capacity close to the optimal solutions, suggesting that scenarios with 10 unique facilities or less are the best solutions in this analysis; these solutions also indicate that all of the facilities should be constructed in 2024 and expanded to manage the increase in EoL EVBs without any new constructions at subsequent stages. Furthermore, the scenarios that most minimize the freight capacity correspond to 3–7 or 10 facilities constructed in 2024.
The distribution in facility sizes throughout all stages is compared with potential scenarios of the current decentralized preprocessing facilities in Europe (Fig. 7). Generally, in the scenarios presented in Fig. 6, as the number of facilities increases, the range of facilities sizes decreases, and the number of outliers with high capacity increases. The scenarios of 3–5 unique facilities have a much wider distribution, and 7 or 10 facilities have a lower average facility size compared to the European network. The scenario with six unique facilities has the most similar range and distribution of facility sizes to Europe and fewer outliers than the more decentralized scenarios. Therefore, six unique facilities constructed in 2024 and undergoing expansion at each stage were the chosen staged development scenario.
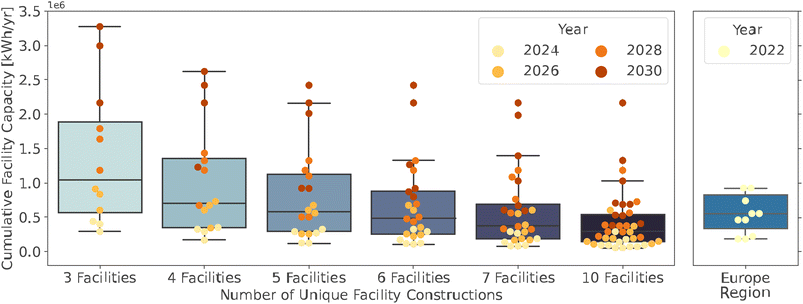 | ||
| Fig. 7 Comparison of facility sizes from the potential staged development scenarios with current mechanical pre-processing facilities in Europe, which is the region best resembling a decentralized industry. Data retrieved from ref. 30. | ||
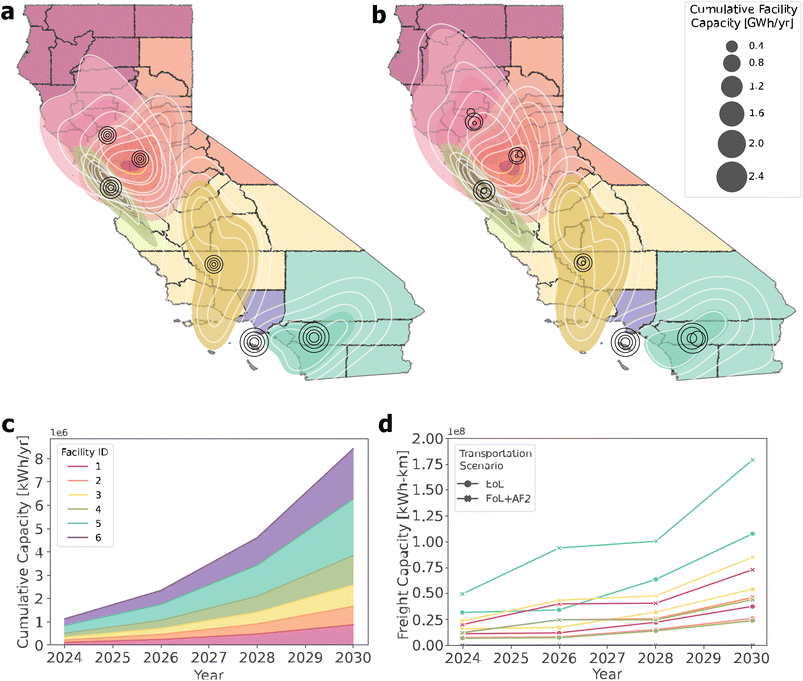
As before, the location of the facility at each stage is consistent for the first transportation scenario (Fig. 8a and b). Unlikely, the second transportation scenario causes variation among facility locations at each stage, especially in 2024 and in the northern region of CA. However, all locations are within the highest density probability interval with the exception of the northernmost facility in 2024. The overlap in probability intervals in northern CA suggests that there is a wider range of possible locations than in southern CA. The capacities of each facility are approximately double at each stage and there are one medium facility and two large facilities and three small facilities of similar capacity (Fig. 8c).
Transportation costs, which are proportional to freight capacity, are lowest for facility 4 and highest for facility 5 (Fig. 8d). Generally, smaller facilities have lower transportation costs. Furthermore, the freight capacity for both transportation scenarios is consistent for facilities 1 and 3 as well as facilities 2 and 4. The regions associated with facilities 1 and 3 and the annual capacities of those facilities are similar, causing the similarity in the freight capacity. In contrast, the region associated with facility 2 spans 17 counties and is much larger than facility 4 which encompasses only seven counties. However, facility 2 also has a lower capacity, likely causing a similarity in the freight capacity. Facility 5 has the largest freight capacity for both transportation scenarios and is almost twice the second highest freight capacity associated with facility 3. The region assigned to facility 5 is relatively large and the facility has the largest processing capacity, which causes higher transportation costs.
Through each solution, it was found that the second transportation scenario, which includes the second-use distribution, does not greatly affect the facility locations. However, the northern CA region shows slightly higher sensitivity to second-use criteria compared to the southern CA region. This suggests that it could be more imperative to consider second-use impacts when placing preprocessing facility locations in northern CA. Additionally, compared to the southern region, all heuristics generated more smaller facilities in the northern region of CA with large regions of overlap between the probabilistic location analyses. This indicates that there is a considerable variety of locations that could benefit from decentralized facilities in CA. In contrast, the results suggest that fewer, larger facilities should be constructed in southern CA, and there are smaller, more defined regions in which these facilities should be located.
4 Conclusions
The purpose of this paper is to provide a methodology for the application of SCMCA heuristics that generate solutions to the np-hard problem. This methodology has the potential to be utilized in a variety of industries for network optimization and provides a basis for procedures that could be adapted to other ML algorithms in alternative applications. The proposed methodology incorporates how to identify important tuning parameters from a variety of SCMCA heuristics, impose multiple criteria for determining the relatively optimal solutions from the overall set of solutions, and design an SCMCA based on the chosen criteria. A sensitivity analysis is also incorporated to verify the relative advantageous nature of the heuristic and investigate proposed solutions through deterministic-probabilistic coupled location analysis. Furthermore, this methodology is implemented through a case study of the projected EoL EVB CA industry through 2030 that incorporates back-end verification of the final results through comparison of existing decentralized facilities.Compared to Europe and China, the LIB recycling industry in North America is in its infancy and has a unique opportunity to design an integrated EoL LIB network. This network could consist of optimized decentralized preprocessing facilities and centralized material recovery locations. Through the case study, this analysis designates an SCMCA with a relative advantage over other heuristics and provides a method to incorporate the impact of a potential second-use location on the locations of the proposed decentralized preprocessing facilities. A staged development scenario for 2024–2030 in CA is presented as a guideline for scaling up EVB preprocessing facilities. The scenario is determined through the chosen SCMCA heuristic which most minimizes transportation costs for EVB transport in the EoL network.
Conflicts of interest
There are no conflicts to declare.Acknowledgements
The authors acknowledge the National Science Foundation Future Manufacturing Research Grant (Award No. 2037898) for supporting this work.References
- G. Harper, R. Sommerville, E. Kendrick, L. Driscoll, P. Slater, R. Stolkin, A. Walton, P. Christensen, O. Heidrich, S. Lambert, A. Abbott, K. Ryder, L. Gaines and P. Anderson, Recycling Lithium-Ion Batteries from Electric Vehicles, Nature, 2019, 575(7781), 75–86, DOI:10.1038/s41586-019-1682-5 , http://www.nature.com/articles/s41586-019-1682-5.
- D. L. Thompson, J. M. Hartley, S. M. Lambert, M. Shiref, D. Gavin, J. Harper, E. Kendrick, P. Anderson, K. S. Ryder, L. Gaines and A. P. Abbott, The Importance of Design in Lithium Ion Battery Recycling – a Critical Review, Green Chem., 2020, 22(22), 7585–7603, 10.1039/D0GC02745F , http://xlink.rsc.org/?DOI=D0GC02745F.
- J. Ahuja, L. Dawson and R. Lee, A Circular Economy for Electric Vehicle Batteries: Driving the Change, J. Prop. Plan. Environ. Law, 2020, 12(3), 235–250, DOI:10.1108/JPPEL-02-2020-0011 , https://www.emerald.com/insight/content/doi/10.1108/JPPEL-02-2020-0011/full/html.
- C. M. Costa, J. C. Barbosa, R. Gonçalves, H. Castro, F. J. Del Campo and S. Lanceros-Méndez, Recycling and Environmental Issues of Lithium-Ion Batteries: Advances, Challenges and Opportunities, Energy Storage Mater., 2021, 37, 433–465, DOI:10.1016/j.ensm.2021.02.032 , https://www.sciencedirect.com/science/article/pii/S2405829721000829.
- O. Tyler, S. Gourley, K. Kaliyappan, A. Yu and Z. Chen, Recycling of Mixed Cathode Lithium-ion Batteries for Electric Vehicles: Current Status and Future Outlook, Carbon Energy, 2020, 2(1), 6–43, DOI:10.1002/cey2.29.
- K. Richa, Sustainable Management of Lithium-Ion Batteries after Use in Electric Vehicles, Rochester Institute of Technology, 2016 Search PubMed.
- M. Chen, X. Ma, B. Chen, R. Arsenault, P. Karlson, N. Simon and Y. Wang, Recycling End-of-Life Electric Vehicle Lithium-Ion Batteries, Joule, 2019, 3(11), 2622–2646, DOI:10.1016/j.joule.2019.09.014 , https://www.sciencedirect.com/science/article/pii/S254243511930474X.
- V. Nguyen-Tien, Q. Dai, D. Gavin, J. Harper, P. A. Anderson and R. J. R. Elliott, Optimising the Geospatial Configuration of a Future Lithium Ion Battery Recycling Industry in the Transition to Electric Vehicles and a Circular Economy, Appl. Energy, 2022, 321, 119230, DOI:10.1016/j.apenergy.2022.119230 , https://www.sciencedirect.com/science/article/pii/S0306261922005943.
- H. Rallo, A. Sanchez, L. Canals and B. Amanta, Battery Dismantling Centre in Europe: A Centralized vs. Decentralized Analysis — Elsevier Enhanced Reader, 2022, https://reader.elsevier.com/reader/sd/pii/S2667378922000256?token=11558BB6F417AED2324DEDE72163CAA97F99F873E05760DA1C9AFA258F4DF1EDA6CC1258DA3C0E4A0F934D85168FC70F%26originRegion=us-east-1%26originCreation=20220629140212 Search PubMed.
- D. Kushnir, Lithium Ion Battery Recycling Technology 2015: Current State and Future Prospects, ESA Report 2015:18, Chalmers Institute of Technology, Goteborg, Sweden, 2015, p. 56 Search PubMed.
- M. Slattery, J. Dunn and A. Kendall, Transportation of Electric Vehicle Lithium-Ion Batteries at End-of-Life: A Literature Review, Resour., Conserv. Recycl., 2021, 174, 105755, DOI:10.1016/j.resconrec.2021.105755 , https://linkinghub.elsevier.com/retrieve/pii/S0921344921003645.
- Recyclus Group Production of Black Mass Will Contribute towards the 100% of Li-Ion Batteries Being Recycled by 2022, 2021, https://finance.yahoo.com/news/recyclus-group-production-black-mass-042600434.html Search PubMed.
- M. Ottaviani, Lithium Batteries Transport and Packaging Instructions Multimodal Approach 2022, 2022, https://lithium.batteriestransport.org/ Search PubMed.
- Recycled Critical Materials Put Battery Supply Chains in US Hands - ReCell Center, 2020, https://recellcenter.org/2020/05/26/recycled-critical-materials-put-battery-supply-chains-in-us-hands/ Search PubMed.
- R. E. Ciez and J. F. Whitacre, Examining different recycling processes for lithium-ion batteries, Nat Sustainability, 2019, 2(2), 148–156 CrossRef.
- T. P. Hendrickson, O. Kavvada, N. Shah, R. Sathre and C. D. Scown, Life-Cycle Implications and Supply Chain Logistics of Electric Vehicle Battery Recycling in California, Environ. Res. Lett., 2015, 10(1), 014011, DOI:10.1088/1748-9326/10/1/014011 , https://iopscience.iop.org/article/10.1088/1748-9326/10/1/014011.
- L. Wang, X. Wang and W. Yang, Optimal Design of Electric Vehicle Battery Recycling Network – From the Perspective of Electric Vehicle Manufacturers, Appl. Energy, 2020, 275, 115328, DOI:10.1016/j.apenergy.2020.115328 , https://linkinghub.elsevier.com/retrieve/pii/S0306261920308400.
- A. Beaudet, F. Larouche, K. Amouzegar, P. Bouchard and K. Zaghib, Key Challenges and Opportunities for Recycling Electric Vehicle Battery Materials, Sustainability, 2020, 12, 5837, DOI:10.3390/su12145837.
- W. Kevin, S. Laux and T. Townsend, A Review on the Growing Concern and Potential Management Strategies of Waste Lithium-Ion Batteries — Elsevier Enhanced Reader, 2017, https://reader.elsevier.com/reader/sd/pii/S0921344917303774?token=E98551279F7975F4C9C7485C9E8BAF7ED7CE19E0BF66738F347669ABD2B58594015184ED6BF89D8E6456261F777A7B7B%26originRegion=us-east-1%26originCreation=20220706225009 Search PubMed.
- T. G. Bosona and G. Gebresenbet, Cluster Building and Logistics Network Integration of Local Food Supply Chain, Biosyst. Eng., 2011, 108(4), 293–302, DOI:10.1016/j.biosystemseng.2011.01.001 , https://linkinghub.elsevier.com/retrieve/pii/S1537511011000134.
- M. Usama, J. Qadir, A. Raza, H. Arif, K.-lim A. Yau, Y. Elkhatib, A. Hussain and A. Al-Fuqaha, Unsupervised Machine Learning for Networking: Techniques, Applications and Research Challenges, IEEE Access, 2019, 7, 65579–65615, DOI:10.1109/ACCESS.2019.2916648.
- T. Hastie, R. Tibshirani and J. Friedman, Unsupervised Learning, in The Elements of Statistical Learning, Springer New York, New York, NY, 2009, pp. 485–585, http://link.springer.com/10.1007/978-0-387-84858-7_14 Search PubMed.
- M. J. Cracknell and A. M. Reading, Geological Mapping Using Remote Sensing Data: A Comparison of Five Machine Learning Algorithms, Their Response to Variations in the Spatial Distribution of Training Data and the Use of Explicit Spatial Information, Comput. Geosci., 2014, 63, 22–33, DOI:10.1016/j.cageo.2013.10.008 , https://linkinghub.elsevier.com/retrieve/pii/S0098300413002720.
- S. Amit, M. Prasad, A. Gupta, N. Bharill, Om P. Patel, A. Tiwari, M. J. Er, W. Ding and C.-T. Lin, A Review of Clustering Techniques and Developments, Neurocomputing, 2017, 267, 664–681, DOI:10.1016/j.neucom.2017.06.053 , https://www.sciencedirect.com/science/article/pii/S0925231217311815.
- Babcock University, F. Y. Osisanwo, J. E. T. Akinsola, O. Awodele, J. O. Hinmikaiye, O. Olakanmi and J. Akinjobi, Supervised Machine Learning Algorithms: Classification and Comparison, Int. J. Comput. Trends Technol., 2017, 48(3), 128–138, DOI:10.14445/22312803/IJCTT-V48P126 , http://www.ijcttjournal.org/archives/ijctt-v48p126.
- S. Sisman and A. C. Aydinoglu, Improving Performance of Mass Real Estate Valuation through Application of the Dataset Optimization and Spatially Constrained Multivariate Clustering Analysis, Land Use Pol., 2022, 119, 106167, DOI:10.1016/j.landusepol.2022.106167 , https://linkinghub.elsevier.com/retrieve/pii/S0264837722001946.
- Y. Wang, X. Ma, Y. Lao and Y. Wang, A Fuzzy-Based Customer Clustering Approach with Hierarchical Structure for Logistics Network Optimization, Expert Syst. Appl., 2014, 41(2), 521–534, DOI:10.1016/j.eswa.2013.07.078 , https://linkinghub.elsevier.com/retrieve/pii/S0957417413005654.
- Y. Wang, S. Peng and M. Xu, Emergency Logistics Network Design Based on Space–Time Resource Configuration, Knowl. Base Syst., 2021, 223, 107041, DOI:10.1016/j.knosys.2021.107041 , https://linkinghub.elsevier.com/retrieve/pii/S095070512100304X.
- Y. Li, T. Fei and F. Zhang, A Regionalization Method for Clustering and Partitioning Based on Trajectories from NLP Perspective, Int. J. Geogr. Inf. Sci., 2019, 33(12), 2385–2405, DOI:10.1080/13658816.2019.1643025 , https://www.tandfonline.com/doi/full/10.1080/13658816.2019.1643025.
- H. Eric Melin, CES Online Database. Circular Energy Storage Consultants, 2022, https://circularenergystorage.com/ces-online Search PubMed.
- Alternative Fuels Data Center: Maps and Data - Electric Vehicle Registrations by State, Alternative Fuels Data Center, 2022, https://afdc.energy.gov/data/10962 Search PubMed.
- Cartographic Boundary Files, US Census Bureau, 2020, https://www.census.gov/geographies/mapping-files/time-series/geo/cartographic-boundary.html Search PubMed.
- Y. Zhao, O. Pohl, A. I. Bhatt, G. E. Collis, P. J. Mahon, T. Rüther and F. Anthony, Hollenkamp. “A Review on Battery Market Trends, Second-Life Reuse, and Recycling”, Sustainable Chem., 2021, 2(1), 167–205, DOI:10.3390/suschem2010011 , https://www.mdpi.com/2673-4079/2/1/11.
- Federal Emergency Management Agency, Fema_national-Risk-Index_technical-Documentation.Pdf, 2021, https://www.fema.gov/sites/default/files/documents/fema_national-risk-index_technical-documentation.pdf Search PubMed.
- X. Li and L. Anselin, Pygeoda 0.0.8 — Pygeoda 0.0.8 Documentation, 2019, https://geodacenter.github.io/pygeoda/ Search PubMed.
- L. Anselin, Documentation — GeoDa on Github, 2020, https://geodacenter.github.io/documentation.html Search PubMed.
- D. Guo, Regionalization with Dynamically Constrained Agglomerative Clustering and Partitioning (REDCAP), Int. J. Geogr. Inf. Sci., 2008, 22(7), 801–823, DOI:10.1080/13658810701674970 , http://www.tandfonline.com/doi/abs/10.1080/13658810701674970.
| This journal is © The Royal Society of Chemistry 2024 |

