 Open Access Article
Creative Commons Attribution 3.0 Unported Licence
Comparing the greenness and sustainability of three routes to an HIV protease inhibitor intermediate†
Stephanie Gina
Akakios
 a,
Moira Leanne
Bode
 b and
Roger Arthur
Sheldon
 *bc
*bc
aSchool of Chemical and Metallurgical Engineering, University of the Witwatersrand, P.O. Wits 2050, Johannesburg, South Africa
bMolecular Sciences Institute, School of Chemistry, University of the Witwatersrand, P.O. Wits 2050, Johannesburg, South Africa. E-mail: roger.sheldon@wits.ac.za
cDepartment of Biotechnology, Section BOC, Delft University of Technology, van der Maasweg 9, 2629 HZ Delft, Netherlands
First published on 13th April 2021
Abstract
The greenness and sustainability of three different routes for the synthesis of (3R,3aS,6aR)-hexahydrofuro [2,3-b] furan-3-ol (bis-furan alcohol), an advanced intermediate for a group of HIV protease inhibitors, including the FDA approved darunavir, used in antiretroviral (ARV) therapy, were compared. The method involved a comparison of (i) waste generated using the E-factor and relative to industrial benchmarks using the innovative Green Aspiration Level (iGAL™) method, (ii) solvent usage on the basis of solvent intensity (SI) and properties according to the GSK solvent guide, and (iii) Green Motion™ scores according to the MANE methodology.
1. Introduction
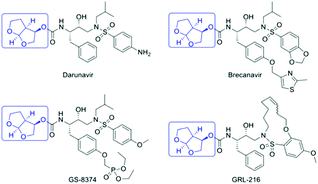
Since the onset of the HIV-AIDS epidemic in 1981, 76.10 million people have been infected globally by the human immunodeficiency virus (HIV), with sub-Saharan Africa accounting for two-thirds of this total.1 Antiretroviral (ARV) drugs, such as the HIV protease inhibitors, have the primary objective of keeping HIV patients alive and preventing viral transmission. According to the WHO, 36.70 million people worldwide were living with HIV in 2016 with approximately 21.70 million people receiving effective ARV therapy. However, 60% of HIV positive individuals in Southern and Eastern Africa have no access to ARVs, emphasizing the need for cost-effective, sustainable manufacture of ARVs. The structures of a group of 2nd generation HIV PIs, including the FDA approved darunavir, are shown in Fig. 1. These compounds, designed to overcome multi-drug resistance to 1st generation HIV PIs, all contain the (3R,3aS,6aR)-hexahydrofuro [2,3-b] furan-3-ol moiety, also known as the bis-THF alcohol.2,3A cost analysis of various synthetic pathways to darunavir showed that the bis-THF alcohol moiety contributed to roughly half the cost of synthesizing the active ingredient.4 This explains why numerous routes for its synthesis have been described.2,3,4–13 In this study we have assessed the greenness and sustainability of the three most recent and innovative routes.3,4,13
Publication in 1992 of the amounts of waste generated per kg of product (The (E)nvironmental Factor), in various sectors of the chemical industry (Table 1),14 served to focus attention on the high E-factors observed in pharmaceuticals manufacture. Furthermore, in 2012 it was estimated that branded and generic pharmaceutical industries produce ≥100 million kilograms of Active Pharmaceutical Ingredient (API) and more than 15 billion kilograms of co-produced waste per annum.15 The envisaged costs of disposal of this enormous detritus burden provide a significant incentive for the pharmaceutical industry to reduce waste generation and increase resource efficiency to enable more affordable medication and minimise its environmental footprint.
| Industry segment (examples) | Yearly production (tons) | E-Factor (kg waste per kg product) | No. synthetic steps |
|---|---|---|---|
| Pharmaceuticals (antibiotics, drugs, vaccines) | 10–1000 | 25–>100 | 6+ |
| Fine chemicals (coatings, electronic parts) | 100–10![[thin space (1/6-em)]](https://www.rsc.org/images/entities/char_2009.gif) 000 000 |
5–>50 | 3–4 |
| Bulk chemicals (plastics, polymers) | 10![[thin space (1/6-em)]](https://www.rsc.org/images/entities/char_2009.gif) 000–1 000–1![[thin space (1/6-em)]](https://www.rsc.org/images/entities/char_2009.gif) 000 000![[thin space (1/6-em)]](https://www.rsc.org/images/entities/char_2009.gif) 000 000 |
<1–5 | 1–2 |
| Petrochemical (solvents, detergents) | 1![[thin space (1/6-em)]](https://www.rsc.org/images/entities/char_2009.gif) 000 000![[thin space (1/6-em)]](https://www.rsc.org/images/entities/char_2009.gif) 000–100 000–100![[thin space (1/6-em)]](https://www.rsc.org/images/entities/char_2009.gif) 000 000![[thin space (1/6-em)]](https://www.rsc.org/images/entities/char_2009.gif) 000 000 |
∼0.1 | Separations |
The twelve principles of green chemistry, as defined and promulgated by Anastas and Warner in 1998,16 provide a basis for assessing greenness:
1. Waste prevention instead of remediation
2. Atom efficiency
3. Less hazardous materials
4. Safer products by design
5. Innocuous solvents and auxiliaries
6. Energy efficient by design
7. Preferably renewable raw materials
8. Shorter synthesis (avoid derivatisation)
9. Catalytic rather than stoichiometric reagents
10. Design products for degradation
11. Analytical methodologies for pollution prevention
12. Inherently safer processes
Jiménez-González and Constable17 classified the twelve principles into 5 metric categories to aid assessment of greenness. Thus, principles 1, 2, 5, 8 and 9 are concerned with mass efficiency, 3, 11 and 12 with health and safety, 6 with energy efficiency, 4 and 10 with waste generation and 7 with renewability of raw materials.
Our strategy entailed determining, for each synthetic pathway, (i) waste generation (E-factor),14,18 (ii) greenness relative to industrial benchmarks following the innovative Green Aspiration Level (iGAL™) methodology,19,20 (iii) solvent intensity and nature according to the GSK solvent guide,21 and (iv) score according to the Green Motion™ methodology of MANE.22
Notwithstanding the importance of process greenness, in order to be sustainable a process must also be cost-effective and this is determined by, inter alia, the cost of raw materials and solvents and the number of unit operations. Hence, we have also assessed the effect of such parameters on the process economics.
It is also important to recognise that the bis-THF alcohol molecule contains three stereogenic centres and the desired product, the 3R,3aS,6aR isomer, is only one of the eight possible stereoisomers. The method used to obtain the required stereochemistry, i.e. the chirotechnology,23 will directly influence the yield of product, the waste generated and, hence the greenness and economic viability of a synthetic route. The three routes which we have selected involve three different approaches to obtaining the required stereochemistry.
Green chemistry principles, metrics and assessment tools provide chemists and chemical engineers with guidelines and measures that aid in developing safer and less impactful products and processes. Full environmental assessments using Life Cycle Assessment (LCA) are only conducted at ‘implementation and marketing’ stages where there is greater availability of process data and lower risk of change in process design. Environmental assessments using green metrics and metric based tools are used during the conceptual design stage, where there are less process details, a high degree of process uncertainty and numerous potential synthetic procedures are compared.
Examples of web-based tools and guides that are used in a conceptual design stage to assess process greenness are the iGAL™ and associated green scorecards, Green Motion™, and the GSK solvent sustainability guide.
2. Results and discussion
2.1 Selected routes to bis-THF alcohol
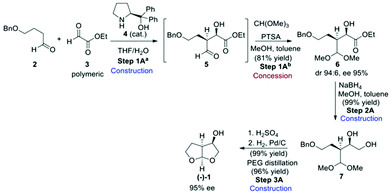
Three synthetic routes to the bis-THF alcohol (1) were assessed, each of which installed the key stereogenic centres using a different approach. Route A (Scheme 1)13 made use of an enantio- and diastereoselective crossed aldol reaction between 4-butyloxy-1-butanal (2) and polymeric ethyl glyoxylate (3) in the presence of 3 mol% (S)-diphenylprolinol (4) to give aldol product 5, which was protected as the acetal derivative 6 before isolation.The required 2R,3S-stereochemistry was obtained, with product 6 being isolated in a diastereomeric ratio of 96![[thin space (1/6-em)]](https://www.rsc.org/images/entities/char_2009.gif) :
:![[thin space (1/6-em)]](https://www.rsc.org/images/entities/char_2009.gif) 4 and with 95% ee. Quantitative ester reduction gave diol 7 which then underwent acetal exchange under acidic conditions and on benzyl deprotection to give the desired bis-THF product (−)-(1). Although the authors went on to improve the product ee through crystallisation to produce a carbonate-derived product salt, our assessment ended at the point of the bis-THF synthesis with the dr and ee obtained from the original aldol reaction.
4 and with 95% ee. Quantitative ester reduction gave diol 7 which then underwent acetal exchange under acidic conditions and on benzyl deprotection to give the desired bis-THF product (−)-(1). Although the authors went on to improve the product ee through crystallisation to produce a carbonate-derived product salt, our assessment ended at the point of the bis-THF synthesis with the dr and ee obtained from the original aldol reaction.
From an assessment perspective, the polymeric ethyl glyoxylate (3) qualifies as a commodity chemical and can be used as the starting point for the green metric determinations, however, 4-butyloxy-1-butanal (2) has to be considered as an advanced synthetic intermediate (ASM). Thus, a simple synthetic sequence to 2 (Scheme 2) based on a combination of established procedures24–26 was devised for assessing the contribution of 2 to the overall metrics of route A. Benzyl protection of butane-1,4-diol (8) gives compound 9 which can be oxidised to the desired aldehyde derivative 2 using TEMPO.
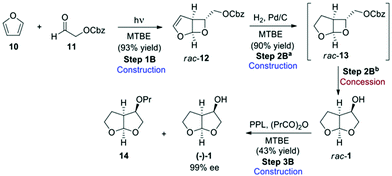
In route B (Scheme 3),3 the bis-THF was initially obtained in racemic form, and an enzymatic kinetic resolution using lipase was the key step in obtaining the desired enantiomer. Reaction of furan (10) with Cbz-protected aldehyde 11 under photocatalytic conditions gave rise to bicyclic rac-12, which was hydrogenated in the presence of palladium to give rac-13. This compound immediately undergoes rearrangement to give the desired bis-THF alcohol (1) in racemic form. The final resolution step was performed using porcine pancreatic lipase (PPL) in the presence of propionic anhydride in methyl tert-butyl ether (MTBE) to give propionate 14 and the desired bis-THF alcohol (−)-1 in 99% ee. The authors describe both a step-by-step (Scheme 3), as well as a one-pot procedure (Scheme 4) for the preparation of 1, and both methods were evaluated for “greenness”.
The telescoping of the process was made possible by the judicious choice of MTBE as solvent for all of the reactions in the step-by-step procedure, and gave an overall final product yield of 35%.
While furan is a cheap commodity chemical, aldehyde 11 must be considered an ASM, and therefore a synthetic route for its preparation was included in the evaluation (Scheme 5). Reaction of glycerol (15) with benzyl chloroformate gives Cbz-protected glycerol (16) which can undergo oxidative cleavage with sodium periodate to give the formaldehyde 17 and the desired Cbz-protected glycol aldehyde 11.3
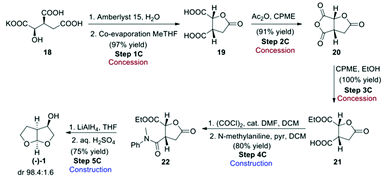
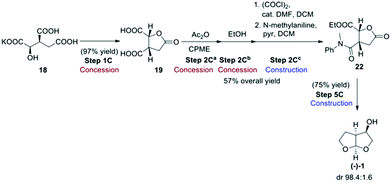
Route C, the final route evaluated (Scheme 6),4 used the chiral pool approach for obtaining the desired stereochemistry by starting from enantiopure 2R,3S-potassium isocitrate (18). This starting material has the advantage of not being considered an ASM, as its cost of production should be as low as 50 USD per kg.4 Potassium isocitrate (18) was neutralised with Amberlyst 15 ion-exchange resin in water, followed by water removal in the presence of methyl-tetrahydrofuran (Me-THF) as co-solvent. Subsequent heating of the resulting oil gave rise to lactone 19. Treatment of the lactone with acetic anhydride in cyclopentyl methyl ether (CPME) gave cyclic anhydride 20 that was ring-opened with EtOH to give hemi-ester 21. The free carboxylic acid group of 21 was amidated with N-methylaniline to give amide 22. Conversion of 22 to the desired bis-THF alcohol (1) by reduction with LiAlH4 formally involves a number of reactions, including reduction of the ester, lactone and amide functional groups to give an intermediate that then cyclises twice under acidic conditions to give the final acetal product (−)-(1).
This reaction proceeds with excellent diastereoselectivity, giving the desired (−)-(1) in 98.4![[thin space (1/6-em)]](https://www.rsc.org/images/entities/char_2009.gif) :
:![[thin space (1/6-em)]](https://www.rsc.org/images/entities/char_2009.gif) 1.6 dr. The authors also reported a one-pot procedure for the conversion of 19 to 22, in 57% yield (Scheme 7). Both the original step-by-step procedure and the condensed synthesis were evaluated.
1.6 dr. The authors also reported a one-pot procedure for the conversion of 19 to 22, in 57% yield (Scheme 7). Both the original step-by-step procedure and the condensed synthesis were evaluated.
2.2 The E-factor
The original E-factor14 considered all reagents used and solvent losses (assuming 90% solvent recovery if not known) in the process and work-up steps. Water was not included since it was thought that inclusion would lead to skewed E-factors. However, process water is generally contaminated with reactants, products and solvents and cannot be re-used without purification. Similarly, solvents are not always (efficiently) recycled. Hence, in the pharmaceutical industry there is an increasing tendency to include water and solvents in the E-factor. In order to go with the flow the use of simple (sE) and complete E-factors (cE) were introduced. The latter includes water and solvents and the former includes neither. The traditional E-factor, which can be calculated when all the data is available lies somewhere in between sE and cE. Waste generated by energy use, which could be expressed in kg CO2 per kg product, was not included because multiple processes were conducted in the same multi-purpose equipment, generally without assigning energy use to specific products. If the data is available, waste generated from energy use could be included27 but we note that for pharmaceuticals manufacture it is less important than for large volume bulk chemicals.
Table 2 summarises the E-factor values obtained for each complete route, including ASM preparation where applicable. The E-factor values shown in parentheses are the contribution of the ASM synthesis to the total value.
| sE (kg kg−1) | E (kg kg−1) | cE (kg kg−1) | |
|---|---|---|---|
| Route A | 10 (3) | 15 (6) | 101 (58) |
| Route Bstep-by-step | 56 (44) | 129 (65) | 784 (262) |
| Route Bone-pot | 58 (45) | 90 (67) | 371 (270) |
| Route Cstep-by-step | 73 | 128 | 1174 |
| Route Cone-pot | 218 | 288 | 1713 |
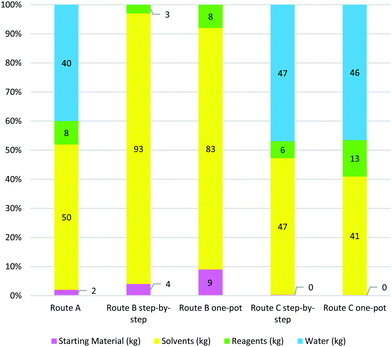
It is clear that route A gave the lowest E-factor, irrespective of whether sE, E or cE calculations were used. One of the factors contributing to this is the route's high atom economy and good overall yield of product, calculated at 51% from butane-1,4-diol (8). Additionally, the high-yielding key crossed aldol reaction required only 3 mol% of chiral catalyst and gave good enantio- and diastereoselectivity. Advantages of this route include the fact that reactions were highly concentrated, and work-up procedures did not require large solvent volumes. In many instances, crude product was used without purification between steps, leading to a low total of 50 kg solvent and 41 kg of water being used per kg of bis-THF alcohol prepared, far less than for the other two routes.
The second best performing route in terms of E-factor was route B, with the one-pot procedure giving the best cE and E values. A major drawback of this method is the low overall yield of 23%, driven by the late-stage enzymatic kinetic resolution where more than half the material is lost in the final step. However, this step gave (−)-1 in excellent enantioselectivity of 99%. The large amount of solvent used in the step-by-step procedure (727 kg kg−1 product), a result of column chromatography for product purification after each step, was significantly reduced in the optimised one-pot procedure to 307 kg by avoiding column chromatography until the final step. No water was used in route B, either during reaction or work-up. What is particularly striking for route B is the significant contribution of ASM synthesis to the total E-factor for the route. This emphasises the importance of choosing an appropriate and standardised starting point for E-factor calculations in order to make route comparisons meaningful.
Route C performed very poorly in terms of E-factor assessment, with large solvent and water volumes used in neutralisations and extractions contributing to the high E-factor values. In addition, the one-pot route performed even worse than the step-by-step procedure, most likely because no route optimisation was done. Thus the step-by-step route used 548 kg of solvent and 553 kg of water per kg product produced and the one-pot route 697 kg solvent and 797 kg water per kg product. Overall reaction yield for the step-by-step procedure was good at 53%, but high solvent volumes and stoichiometric reagent use contributed to the route's poor performance in the E-factor metric.
A rough costing was completed for each route so that a comparison could be made between costing and E-factor. For reagents, the price was estimated based on the best price listed by reputable commercial suppliers and the cost was then divided by ten to make allowance for bulk discount. The cost of all process materials, including solvents and water was included, with no recycling being factored in. The estimated “total cost” for the preparation of 1 kg of bis-THF (1) by means of each route is shown in Table 3.
| Cost (USD per kg) | |
|---|---|
| Route A | 1323 |
| Route Bstep-by-step | 1650 |
| Route Bone-pot | 717 |
| Route Cstep-by-step | 3197 |
| Route Cone-pot | 5281 |
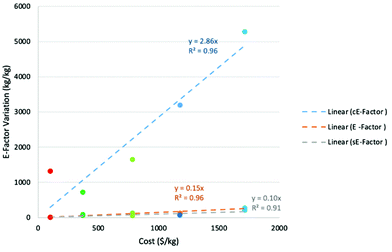
Clearly the one-pot preparation using route B was the most cost-effective at $717, followed by route A at almost double the cost. The most expensive of all the assessed routes at $5281 was the one-pot preparation using route C. In order to test the correlation between route cost and E-factor, each of the calculated cE-factors was plotted against the “total cost”. Results of the plot are shown in Fig. 2 and it is clear that there is generally a clear linear relationship (R2 = 0.96) between cost and cE-factor, with rising costs being associated with rising cE-factor. Route A is an outlier, with the estimated cost being much higher than expected in comparison to the cE-factor.
A possible reason for this is that the individual cost for one of the required materials is particularly high, which drives the price much higher than expected based on cE-factor alone. Interestingly, a plot of original E-factor against total cost also proved to be linear (R2 = 0.96) while the correlation of sE-factor against cost proved to be poorer but still mostly linear (R2 = 0.91). These plots clearly illustrate the cost benefit associated with “greener” routes.
2.3 Innovative green aspiration level (iGAL™)
In 2018 a further refinement, the innovative Green Aspiration Level (iGAL™), was introduced.20 iGAL is based on a statistical analysis of 64 drug manufacturing processes, involving 703 process steps across 12 companies. It is normalised by taking the salt free molecular weight (FMW) of the API rather than process complexity into account, based on the premise that process complexity is largely determined by molecular weight. The iGAL benchmark is the average cE divided by the average FMW of the 64 APIs assessed and was calculated to be 0.344. Hence, the goal for process innovation in drugs manufacture is to achieve a substantial reduction in waste compared to the iGAL of 0.344 × FMW of the API. The relative process greenness (RPG) for an individual process is the iGAL divided by the actual cE and is expressed as a percentage. As would be expected, the average cE decreases through the three development phases – early, late and commercial – of the drug manufacturing process. Table 4 presents the mean cE values collected for processes from three different development stages: early (23), late (21) and commercial (20).
| Development phase | FMW (g mol−1) | iGAL™ | cE-factor (kg kg−1) |
|---|---|---|---|
| Early | 451 | 155 | 709 |
| Late | 464 | 160 | 352 |
| Commercial | 449 | 155 | 155 |
Roschangar and coworkers used The Green Chemistry Innovation Scorecard, a web-based calculator,30 to highlight the impact of innovation in waste reduction on drugs manufacture.20 It compares Key Process Performance Indicators (KPPIs) – E-factor, CP, process ideality and RPG – of synthetic routes at three manufacturing stages: early development (before clinical testing), late development and commercial stage.
Future refinements of the iGAL™ and Green Scorecard are expected to incorporate the correlation between waste reduction and process economics in order to motivate a strong business case for using green chemistry to reduce the environmental footprint and render API manufacture more cost-effective.31
The results of a comparison between Routes A to C and this benchmark value are shown in Table 6.
The highest RPG of 294% (i.e., 45/15.25 × 100% = 294%), 8 times better than the industry benchmark (i.e., 294%/35% = 8.33), was observed for Route Astep-by-step. According to the RPG matrix grid this places the route within the top 10% of green industrial performance and is rated ‘excellent’ in terms of mass-efficiency performance.
Route Bone-pot was the next best performer in terms of this metric, with a 1.43 times less wasteful process than the industry average. Route Bstep-by-step and Cstep-by-step performed in line with the industry average benchmark while the unoptimised Route Cone-pot performed worse than average. It should be noted, however, that the iGAL™ methodology does not determine which material category makes the greatest mass contribution to waste generated nor which contributes most to synthesis cost. Both of these are important considerations when determining and comparing green and sustainable drug manufacturing processes.
Although the iGAL™ metric was designed to assess complete API structures we believe that its use in assessing the synthesis of the bis-THF alcohol is justified as it is the most complex and costly intermediate in the synthesis of ARVs such as darunavir (DRV).4
2.4 Solvent selection
Various drug companies have developed in-house solvent selection guides (SSGs) to stimulate replacement of environmentally undesirable solvents such as chlorinated hydrocarbons. Some of these are publicly available and are in reasonable agreement, with minor differences being attributable to varying company cultures. The first GSK SSG was published in 199935 and was later expanded to incorporate Life Cycle Assessment (LCA).29,36 Pfizer was the first to use traffic light inspired colour coding – green, amber and red – to signify ‘preferred’, ‘usable’ and ‘undesirable’,37 and Sanofi used a similar scoring system.38
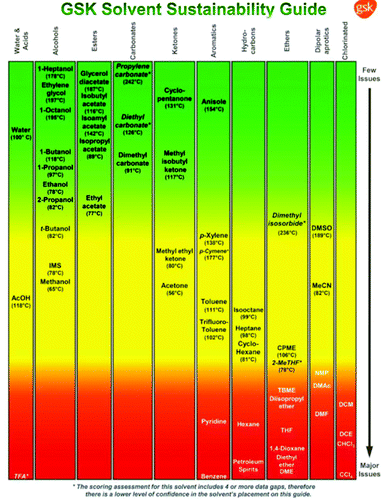
The GSK guide was further refined and expanded from 47 to 110 and 154 solvents in 201139 and 2016,40 respectively. Solvents are assigned a score of 1–10 in four sustainability categories – waste disposal, environmental impact, health and safety (EHS) – which in turn consist of multiple sub-categories. For example, waste consists of incineration, recycling, biotreatment and volatile organic chemical (VOC) emissions. A composite score that is the geometric mean of the four scores −<3.5 is red, 3.5–<7.5 is amber and >7.5 is green – is assigned to each solvent. The ACS Green Chemistry Institute's Pharmaceutical Round Table Consortium (ACS-GCPR) and the European CHEM21 collaborative research project adopted the concept of basing solvent evaluations on EHS statements. The latter consortium divides 51 solvents into four categories – recommended, problematic, hazardous and highly hazardous – and, in contrast with the GSK methodology, the lower the score the greener the solvent.41
We have followed the GSK methodology that is a freely available web-based tool. The equations for calculating the scores in the four categories and the composite score are shown in eqn (1)–(5).
 | (1) |
 | (2) |
 | (3) |
 | (4) |
 | (5) |
In Fig. 3 a variety of common solvents are divided into structural classes, e.g. alcohols, esters, etc., and ranked according to their sustainability in order to facilitate selection of greener and more sustainable solvents.
| Synthesis route | cE-factor (kg kg−1) | SI (kg solvent per kg product) | Contribution of solvents to total material mass (%) | Contribution of solvents to total material cost (%) |
|---|---|---|---|---|
| A | 101 | 50 | 50% | 39 |
| Bstep-by-step | 784 | 727 | 93% | 81 |
| Bone-pot | 371 | 307 | 83% | 30 |
| Cstep-by-step | 1174 | 548 | 47% | 41 |
| Cone-pot | 1713 | 697 | 41% | 39 |
The solvent intensities (kgs solvent per kg product) for each synthetic pathway are shown in Table 7. Notably, Bstep-by-step and both C routes have enormous SIs and one-pot processes are generally less solvent and energy intensive than the corresponding step by step procedures, indicating the importance of process optimisation. Thus, use of route Bone-pot results in a 57.70% reduction in SI compared with route Bstep-by-step. In contrast, route Cstep-by-step used less solvent than the one-pot alternative, which is attributed to the reaction conditions not being optimised in the latter process.
In addition to being major contributors to waste, solvents represent a significant cost item (see Table 7) and potential health hazard in industrial organic syntheses. We adopted the GSK solvent guide, which employs a traffic light inspired colour code, based on multiple sustainability factors, for assessing the relative greenness of solvents used in each synthetic pathways.
Table 8 illustrates the solvent masses and profiles per synthetic pathway, as classified according to the GSK solvent guide. The boiling point is shown owing to its significant role in determining the solvent's colour profile. The quantity of each solvent is illustrated underneath the boiling (or melting) point. The total number of solvents used for the entire synthetic route (including ASM synthesis where relevant) are provided in the last row of the table. Since water was assigned its own material category (in calculating E-factors) and has negligible environmental impact, it was eliminated from Table 8 and the solvent analysis.
Two important solvent properties are flammability and CMR (carcinogenicity, mutagenicity and reprotoxicity) status. Orange to red colour rankings and high penalty points are assigned to solvents with boiling points lower than 80 °C. For example, ethyl acetate (EtOAc) (b.p. 77 °C) scores lower than isopropyl acetate (iPrOAc) (b.p. 89 °C) but this difference is minimal compared with the enormous problems associated with diethyl ether (Et2O, b.p. 35 °C).
Route Astep-by-step has an SI of 50 and the main solvents used are iPrOAc and toluene (PhMe) with minor amounts of 2-propanol, methanol (MeOH), acetic acid, tetrahydrofuran (THF) and polyethylene glycol (PEG400). Unfortunately, this route also uses 3 kg of “highly hazardous” Et2O per kg product which essentially disqualifies it with regard to use on an industrial scale. Alternatives for Et2O as an extraction solvent, with fewer environmental and health hazards, include Me-THF, ethyl tert-butyl ether (ETBE), CPME and iPrOAc.
The SI of route Bstep-by-step is 727 and the cost contribution of solvents is 81%. An advantage of the step-by-step route is that the same solvent, MTBE, is used in three successive steps which facilitates combining them into a one-pot process. However, large quantities of MTBE and relatively large amounts of mixtures of cyclohexane (c-hexane) and EtOAc were used, the latter in flash chromatographic purification of both intermediates and product. EtOAc (62 kg) was also used together with MeOH in the synthesis of the ASM. Much smaller amounts of MTBE were used in the one-pot procedure and flash chromatography was only used to purify the product.
In route C both the step-by-step and one-pot procedures use 6 different solvents. The SI of the step-by-step procedure is 548 with the main contributors being PhMe (255 kg) and dichloromethane (DCM; 175 kg) together with smaller amounts of EtOAc (24 kg), THF (28 kg), Me-THF (32 kg) and CPME (34 kg). DCM is a highly problematic (red colour) solvent with major environmental, health and safety (EHS) issues and constitutes a serious disadvantage with regard to greenness and sustainability. In the one-pot procedure even larger amounts of solvents are used (SI = 697) comprising mainly PhMe (242 kg) and DCM (289 kg). Dimethylformamide (DMF), a suspect reprotoxic agent, was used, albeit in catalytic quantities (2 drops). A merit of both route C procedures is that they use bio-based ethers (CPME and Me-THF) that have lower water solubility and less hazardous properties.
In short, solvents play an important role in determining the greenness and sustainability of organic syntheses based on their major contributions to E-factors, overall process costs and environmental hazards. Based on our analysis, despite its high SI, route Bone-pot is the greenest process from the point of view of solvent use. It is also worth noting, in the context of replacement of undesirable solvents, that it is generally speaking easier to replace solvents used for extraction purposes than those used as a reaction medium.
2.5 Green Motion
1: Raw materials: Raw materials of natural origin and processes involving only natural materials or catalysts are rewarded.
2: Solvent selection: Solvents are classified into 5 categories based on health, safety and environmental impacts. The severest penalties are assigned to the carcinogenic, mutagenic and reprotoxic (CMR) solvents, and no penalty points to solvent-free processes.
3 and 6: Hazard and toxicity of solvents, reagents and products: Penalty points are assigned by applying the INERIS classification43 to the Globally Harmonized System of Classification and Labeling of Chemicals (GHS) pictograms.
4: Reaction efficiency: Includes the number of synthesis steps, reaction yield, catalysis, reaction selectivity (using protection and deprotection steps) as well as atom and carbon economy.
5: Process efficiency: Focuses on the most energy consuming and conserving operations in a process. For example, steam heating is assigned fewer penalty points than gas heating over the same operating time. Processes operating at ambient conditions in under 12 hours are assigned zero penalty points.
7: Waste reduction: The traditional E-factor metric is preferred over the process mass intensity (PMI) metric as it is additive and fits the Green Motion scoring method of zero penalty points being assigned to zero waste generation and both are “gate-to-gate” assessments.
The Green Motion concepts, criteria and penalty points are illustrated in Table 9. In our assessment we have used only concepts 3, 4, 5, 6 and 7 from Green Motion. Price and health and safety rather than natural origin are the important requirements for drug manufacture. In assessing the relative greenness of solvents used in each route, for consistency we used the GSK methodology to assign penalty points. Furthermore, The Green Motion™ tool focuses on processes at pilot scale rather than bench scale at which the bis-THF alcohol experimental procedures were assessed. The necessary adjustments made to the Green Motion™ methodology are explained in the ESI (ESI section 1, Table 1†).
2.5.2.1 Reaction category. Reactions with short reaction times, high yields, using (bio)catalysts, and a minimum number of solvents, without requiring protection and deprotection steps score well in the ‘reaction’ category. Reaction times and yields are shown in Table 10.
| Synthesis route | Overall yield (%) | Reaction time (hours) |
|---|---|---|
| Route A | 51 | 69 |
| Route Bstep-by-step | 24 | 96 |
| Route Bone-pot | 23 | 174 |
| Route Cstep-by-step | 53 | 51 |
| Route Cone-pot | 41 | 46 |
Both C routes have relatively low reaction times, high overall reaction yields and make use of potassium isocitrate, a non-hazardous starting material that is not an ASM, affording high ‘reaction’ scores. The main drawback of Route C procedures is the use of excessive amounts of six solvents, including DCM, together with stoichiometric amounts of reagents, reducing reaction scores.
Both B routes have the disadvantage of low overall reaction yield, lengthy reaction time and addition of the Cbz protection group to the ASM, affording low ‘reaction’ scores. Conversely, the use of 100% atom efficient catalytic hydrogenation and three relatively benign solvents (EtOAc, MTBE and c-hexane) in the B routes contributes to the ‘reaction’ score. The higher ‘reaction’ score of the one-pot procedure is attributed to the large reduction in solvent quantity. Additionally, the efficient one-pot procedure and optimised reaction conditions contributed to route Bone-pot having a better reaction score of 20.
In contrast, route Astep-by-step uses eight different solvents, including highly hazardous Et2O. Route A has a relatively good reaction score owing to its relatively high overall reaction yield of 51%.
2.5.2.2 Process category. For the process category various laboratory scale techniques had to be translated to process concepts from Green Motion as shown in ESI Table 1 in the ESI.† Both B routes operate at ambient temperatures and pressures thus receiving no penalty points for heating, cooling, or reaction steps under pressure. Despite receiving penalty points for using energy intensive flash column chromatography and rotary evaporation, both B routes returned the highest ‘process’ score of 55.
In contrast, route A makes use of cooling to 0 °C, reactions under pressure, liquid–liquid extraction and distillation under reduced pressure, affording an average ‘process’ score of 40. Similarly, both C routes involve heating and cooling (to −5 °C and −8 °C), reactions take place under pressure, rotary evaporation and atmospheric distillations are performed, and other energy intensive methods including crystallization and continuous extraction are used. Consequently, both C routes afforded the lowest ‘process’ scores of 30.
2.5.2.3 Waste category. For the ‘waste’ category we used the sE-Factor to measure waste generation as scores of zero were returned for all synthetic pathways when using E-factor or cE-Factor values. In contrast, use of the sE-factor returned a numerical score for all routes except for route Cstep-by-step.
Route A generated the least waste and had the best ‘waste’ score of 80. Route Bstep-by-step, route Bone-pot and route Cstep-by-step all returned ‘waste’ scores of 53 since they all had close sE-Factor values that fall within a certain Green Motion score range. For both B routes, the ASM accounted for more than 75% of the low ‘waste’ score, owing to its significant sE-factor contribution. If the ASM is disregarded favourable ‘waste’ scores of 85 are returned for both B routes owing to their use of photochemical reactions, which require a limited number and quantity of chemical reagents to perform successfully.
The lowest ‘waste’ score of 0 was returned for Route Cone-pot, attributed to the use of higher material quantities, e.g. an additional reagent (oxalyl chloride) as well as an increase in DMF catalyst and DCM and CPME solvent quantities, resulting in more than double the amount of waste compared with the route Cstep-by-step procedure. Additionally, the one-pot procedure did not replace the entire route Cstep-by-step synthetic pathway but rather a part thereof (Scheme 7) and reaction conditions were not optimised. Mainly owing to the high sE-Factor, route Cone-pot was assigned the maximum penalty points affording a ‘waste’ score of 0.
2.5.2.4 Total score. A comparison of routes A, B and C was performed in accordance with the Green Motion™ concept – reaction, process and waste – and the total scores are shown in Table 11. The original output graphs from the Green Motion™ tool are illustrated in the ESI (ESI section 1.1, Fig. 1–5†). The ‘hazards and toxicity of solvents and reagents’ category is not included as it returned a score of zero for all synthetic pathways which we attribute to all routes being multi-step reactions, requiring a large variety of chemical materials each with their own respective GHS pictograms, accumulating the maximum number of penalty points, returning a score of zero.
| Category | Route A | Route Bstep–by-step | Route Bone-pot | Route Cstep–by-step | Route Cone-pot |
|---|---|---|---|---|---|
| Reaction | 27 | 15 | 20 | 32 | 35 |
| Process | 40 | 55 | 55 | 30 | 30 |
| Waste | 80 | 53 | 53 | 0 | 53 |
| Total Green Motion score | 19 | 14 | 16 | 11 | 4 |
Route A was overall the best performing route with the highest ‘total’ score of 19. This was mainly attributed to route A having the best ‘waste’ score, being a minimum of 27 points higher than the other routes.
Route Bone pot and Bstep-by-step returned ‘total’ scores of 16 and 14 respectively. The major drawback of the B routes was their extremely low overall yield and high ASM sE-factor. Nonetheless, both B routes received good ‘total’ scores for their unique combination of green chemistry techniques including bio-catalysis, ambient reaction temperatures and pressures and renewable raw materials.
Finally, the lower ‘total’ scores of route Cstep by step and Cone-pot of 11 and 4 respectively, are attributed to a variety of energy intensive process operations, stoichiometric amounts of reagents used and the large number and amounts of materials used, resulting in high waste generation.
2.6. The radial polygon
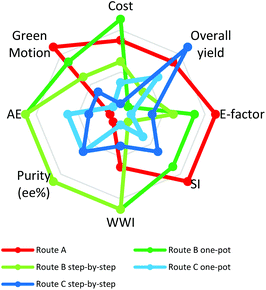
A radial polygon (in our case an octagon) provides a visual overview of multivariate performance indicators (Fig. 5).44 Each vertex represents an ideal metric value and the centre of the octagon the least ideal value. The ideal green synthesis corresponds to a regular polygon. The less “green” the synthesis, the greater the distortion towards the centre45 thus identifying weak points in a synthesis and providing guidance for optimisation.Fig. 5 shows radial octagons for routes A, B and C. The route Bone-pot procedure has the least distorted octagon, ranking highest in cost, AE, purity (% ee) and wastewater intensity (WWI) (total mass of process water per kg product). Route Bstep-by-step performed equally well to route Bone-pot in terms of AE, purity (%ee) and WWI. The weakness of both routes is their low overall yields at 23% and 24%, respectively, a reflection of the fact that route B has a late stage kinetic resolution. The ‘golden rule’ of chirotechnology is that the resolution step be as early as possible in the synthesis.23,46 A late resolution step has a negative effect on all waste materials including solvents, affording high E-Factors and SIs. Combination of an early resolution with a significant reduction in solvent would give B routes an ideal radial octagon.
Route A performed the best in E-factor, SI and Green Motion™ owing to the low material mass required. Further, both C routes afford the most distorted octagons but, on the other hand, they do start from an enantiomerically pure substrate, resulting in a favourable overall yield, with route Cstep-by-step having the best overall yield at 53%. The data used in plotting the octagons along with each synthetic pathway area coverage percentage are shown in the ESI (ESI section 2, Table 2†).
In summary, route Bone-pot showed the greatest correlation with the ideal process, with 82.5% polygon area coverage, followed by route A (70%), route Bstep-by-step (67.50%), route Cstep-by-step (50%) and route Cone-pot (40%). It is important to note that the percentages are merely representative of the ranking system used in generating the radial octagons.
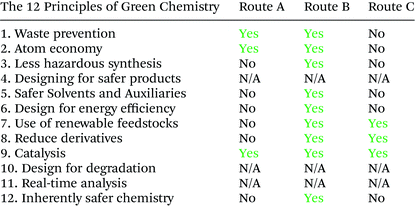
2.7 Comparing the greenness and sustainability of routes to the THF-alcohol
As shown in Table 12, route B performed best in most of the green chemistry principles and was the greenest synthetic pathway to the bis-THF alcohol (ESI, section 3, Tables 3 and 4†).Multiple factors contribute to process greenness and sustainability and defining the most eco-efficient process. Regarding resource efficiency and waste generation, it is important to include waste associated with synthesizing an ASM. Disregarding this would have meant that 40%, 51% and 74% of the waste associated with routes A, Bstep-by-step and Bone-pot procedures, respectively, would have been neglected.
Route A had ‘excellent’ mass-efficiency with a low E-factor of 15 followed by route Bone-pot with a ‘good’ mass-efficiency and moderate E-factor of 90 and route Cstep-by-step with an ‘average’ mass-efficiency and a high E-factor of 128.
Solvents were the greatest contributors to waste (see Table 7) and constitute the greatest environmental concern in all three routes. Solvent intensities ranged from 50 for route A to 697 for route Cone-pot. The total percentage of solvents in total material mass was 83% in route Bone-pot and 93% in route Bstep-by-step. However, it is not just a question of the amount of solvent but, perhaps more importantly, their EHS status. For example, 95% (>500 kgs per kg product) of the mass of solvents used in route C consists of hazardous and problematic solvents with significant health and safety issues. In contrast, 80% of the total solvent mass used in route Bone-pot consists of EtOAc and MeOH, characterised as green solvents in the GSK guide. Solvents also constitute a significant contribution to total process costs and route Bone-pot had the lowest solvent costs in manufacturing of 1 kg bis-THF alcohol. We conclude that solvent utilisation offers the greatest potential in reducing the environmental impact of bis-THF alcohol synthesis both qualitatively and quantitatively.
In the Green Motion™ study favourable scores were returned for reactions with short reaction times, high yields, using (bio)catalysts and low amounts of solvents under ambient conditions that generate less waste (low E-factors). Route Bone-pot, with a unique combination of green chemistry techniques including a one-pot procedure, bio-catalysis, ambient reaction temperatures and pressures, relatively green solvents and renewable raw materials originating from woody bio-mass, achieved a relatively high score of 16. In contrast, route Cone-pot used a variety of energy intensive unit operations (atmospheric distillation, crystallization, continuous extraction, reactions under reduced pressure, heating and cooling) in combination with a variety of stoichiometric reagents, generating the most waste. This translated to the lowest total Green Motion score of 4 consistent with Cone-pot being the least sustainable route.
Using a radial polygon visualisation tool to combine all the greenness variables assessed clearly showed that the route Bone-pot procedure covered the highest radial polygon area, at 82.50%, confirming that it is the greenest route.
2.8 Summary and conclusions
In conclusion, the route Bone-pot procedure was found to be the most efficient, scalable, inexpensive, environmentally friendly, and least health hazardous pathway for assembling the bis-THF alcohol. It adhered to several principles of green chemistry through the use of renewable, CO2 neutral, wood based materials (xylochemistry), environmentally acceptable solvents (for waste minimisation and safety), photochemical reactions and bio-catalytic reactions under ambient operating conditions. It was overall the most sustainable route, scoring the best over multiple assessment criteria and demonstrating the triple win of green chemistry:a. Cost effectiveness reflected in 77% and 43% cost reduction compared to routes Cstep-by-step and route A respectively,
b. Environmental friendliness with a reduced waste burden reflected in an acceptable E-factor of 90, below the API GCIPR benchmark of 130,
c. Safety as a result of 80% of the total solvents used having a green colour ranking and the use of less hazardous reagents and operating conditions.
Route Bone-pot is the method of choice but there is room for improvement. It uses relatively large amounts of solvents which can probably be further reduced by avoiding flash chromatographic product purification. From a purely chirotechnology viewpoint it is the worst process as it involves a late resolution step whereas routes A and C involve a catalytic asymmetric synthesis and a chiral pool starting material, respectively. This is directly reflected in the overall lower yield (24%) of route B which is less than half that of routes A (51%) and C (53%).
One general conclusion is that methodologies that were developed in industry may need to be modified to enable meaningful comparisons between laboratory-scale recipes that often generate off-scale readings, particularly with regard to amounts of solvents used. Finally, our analysis clearly shows the importance of using a number of different metrics to evaluate the relative greenness and sustainability of processes as some routes perform well when evaluated with one metric but poorly with other criteria.
2.9 Take home message
For those of us who are training the next generation of chemists: the best way to instil an awareness of green chemistry principles is to make sure they are applied in our research laboratories from day one. Such habits established at the beginning of a new chemist's career will be carried through to every future application. Students should be taught to always question the choice of reaction solvent rather than automatically use what has been previously reported in the literature. We should be deliberate about using green solvents for work-up – the more the precedent is set in the literature, the more others will follow. Moreover, we should strive to eliminate the use of “red” solvents from the research laboratory altogether. Catalytic reactions should be used, where feasible, to optimise atom economy and minimise waste formation.With a view to industrial applications, e.g. in pharmaceuticals manufacture, raw materials should be not more than one step removed from bulk, commodity chemicals. Multi-step reactions should be performed as one-pot processes, thus avoiding the isolation of intermediates, and the solvent should be optimised for the overall process rather than for individual steps. The use of reaction steps involving high pressures or heating and, especially cooling, as well as work-up techniques, such as chromatography, requiring large amounts of solvents and lengthy throughput times, should be avoided. Solvents and catalysts should be recycled to minimise waste production and optimise cost effectiveness. Finally, a take home message for industrial chemists: less waste translates to lower costs of goods. In the prophetic words of the eminent 19th century organic chemist, A. W. von Hofmann (1818–1892):
“In an ideal chemical factory there is, strictly speaking, no waste but only products. The better a real factory makes use of its waste, the closer it gets to its ideal, the bigger is the profit”.
Conflicts of interest
There are no conflicts to declare.Acknowledgements
SGA thanks Prof Kevin Harding, School of Chemical Engineering, University of the Witwatersrand, for his continued support and encouragement during the course of her studies and gratefully acknowledges the National Research Foundation (NRF) for financial support.References
- M. M. Mudgal, N. Birudukota and M. A. Doke, Int. J. Med. Chem., 2018, 2946730 Search PubMed.
- A. K. Ghosh, C. D. Martyr, M. Steffey, Y. F. Wang, J. Agniswamy, M. Amano, I. T. Weber and H. Mitsuya, ACS Med. Chem. Lett., 2011, 2, 298–302 CrossRef CAS.
- A. Sevenich, G.-Q. Liu, A. J. Arduengo, B. F. Gupton and T. Opatz, J. Org. Chem., 2017, 82, 1218–1223 CrossRef CAS PubMed.
- G. L. Moore, R. W. Stringham, D. S. Teager and T.-Y. Yue, Org. Process Res. Dev., 2017, 21, 98–106 CrossRef CAS PubMed.
- A. K. Ghosh, W. J. Thompson, P. M. D. Fitzgerald, J. C. Culbertson, M. G. Axel, S. P. McKee, J. R. Huff and P. S. Anderson, J. Med. Chem., 1994, 37, 2506–2508 CrossRef CAS PubMed.
- A. K. Ghosh and Y. Chen, Tetrahedron Lett., 1995, 36, 505–508 CrossRef CAS.
- M. Uchiyama, M. Hirai, M. Nagata, R. Katoh, R. Ogawa and A. Ohta, Tetrahedron Lett., 2001, 42, 4653–4656 CrossRef CAS.
- P. J. L. Quaedflieg, B. R. R. Kasteleyn, P. B. T. P. Wigerinck, N. M. F. Goyvaerts, R. J. Vijn, C. S. M. Liebregts, J. H. M. H. Kooistra and C. Cusan, Org. Lett., 2005, 7, 5917–5920 CrossRef CAS PubMed.
- R. H. Yu, R. P. Polniaszek, M. W. Becker, C. M. Cook and L. H. L. Yu, Org. Process Res. Dev., 2007, 11, 972–980 CrossRef CAS.
- W. L. Canoy, B. E. Cooley, J. A. Corona, T. C. Lovelace, A. Millar, A. M. Weber, S. Xie and Y. Zhang, Org. Lett., 2008, 10, 1103–1106 CrossRef CAS PubMed.
- D. M. Black, R. Davis, B. D. Doan, T. C. Lovelace, A. Millar, J. F. Toczko and S. Xie, Tetrahedron: Asymmetry, 2008, 19, 2015–2019 CrossRef CAS.
- M. G. Kulkarni, Y. B. Shaijk, A. S. Borhade, A. B. Dhondge, S. V. Chavhan, M. P. Desai, D. R. Birhade, N. R. Dhatrak and R. Gannimani, Tetrahedron: Asymmetry, 2010, 21, 2394–2398 CrossRef CAS.
- Y. Hayashi, T. Aikawa, Y. Shimasaki, H. Okamoto, Y. Tomioka, T. Miki, M. Takeda and T. Ikemoto, Org. Process Res. Dev., 2016, 20, 1615–1620 CrossRef CAS.
- R. A. Sheldon, Chem. Ind., 1992, 23, 903–906 Search PubMed.
- B. W. Cue, in Green Techniques for Organic Synthesis and Medicinal Chemistry, ed. W. Zhang and B. W. Cue, Wiley, Chichester (UK), 2012, pp. 553–569 Search PubMed.
- P. T. Anastas and J. C. Warrner., Green Chemistry: Theory and Practice, Oxford University Press, New York, 1998 Search PubMed.
- C. Jiménez-González and D. J. C. Constable, in Green Chemistry and Engineering: A Practical Design Approach, Wiley, New Jersey, 2011 Search PubMed.
- R. A. Sheldon, ACS Sustainable Chem. Eng., 2017, 6, 32–48 CrossRef CAS . See also: D. Prat, J. Hayler and A. Wells, Green Chem., 2014, 16, 4546–4551 RSC.
- F. Roschangar, R. A. Sheldon and C. H. Senanayake, Green Chem., 2015, 17, 752–768 RSC.
- F. Roschangar, Y. Zhou, D. J. C. Constable, J. Colberg, D. P. Dickson and P. Dunn, et al. , Green Chem., 2018, 20, 2206–2211 RSC.
- C. M. Alder, J. D. Hayler, R. K. Henderson, A. M. Redman, L. Shukla, L. E. Shuster and H. F. Sneddon, Green Chem., 2016, 18, 3879–3890 RSC.
- T. V. T. Phan, C. Gallardo and J. Mane, Green Chem., 2015, 17, 2846–2852 RSC.
- R. A. Sheldon, Chirotechnology: The Industrial Synthesis of Optically Active Compounds, Marcel Dekker, New York, 1993 Search PubMed.
- B. G. Szczepankiewicz and C. H. Heathcock, Tetrahedron, 1997, 53, 8853–8870 CrossRef CAS.
- M. H. A. Janssen, J. F. C. Castellana, H. Jackman, P. J. Dunn and R. A. Sheldon, Green Chem., 2011, 13, 905–912 RSC.
- G. Pandey, A. K. Sahoo, T. D. Bagul and S. R. Gadre, ARKIVOC, 2001, 8, 83–94 Search PubMed.
- F. Tieves, F. Tonin, E. Fernández-Fueyo, J. M. Robbins, B. Bommarius, A. S. Bommarius, M. Alcalde and F. Hollmann, Tetrahedron, 2019, 75, 1311–1314 CrossRef CAS.
- F. Roschangar, J. Colberg, P. J. Dunn, F. Gallou and J. D. Hayler, et al. , Green Chem., 2017, 19, 281–285 RSC.
- T. Gaich and P. S. Baran, J. Org. Chem., 2010, 75, 4657–4673 CrossRef CAS PubMed.
- https://www.acs.org/content/acs/en/greenchemistry/research-innovation/tools-for-green-chemistry/green-chemistry-innovation-scorecard-calculator .
- S. G. Koenig and B. Dillon, Curr. Opin. Green Sustain. Chem., 2017, 7, 56–59 CrossRef.
- C. Jimenez-Gonzalez, A. D. Curzons, D. J. C. Constable and V. L. Cunningham, Int J LCA, 2004, 2, 114–121 CrossRef.
- D. J. C. Constable, C. Jimenez-Gonzalez and R. K. Henderson, Org. Process Res. Dev., 2007, 11, 133–137 CrossRef CAS.
- R. A. Sheldon, Curr. Opin. Green Sustain. Chem., 2019, 18, 13–19 CrossRef.
- A. D. Curzons, D. J. C. Constable and V. L. Cunningham, Clean Technol. Environ. Policy, 1999, 1, 82–90 CrossRef.
- C. Jimenez-Gonzalez, A. D. Curzons, D. J. C. Constable and V. L. Cunningham, Clean Technol. Environ. Policy, 2005, 7, 42–50 CrossRef CAS.
- K. Alfonsi, J. Colberg, P. J. Dunn, T. Fevig and S. Jennings, et al. , Green Chem., 2008, 10, 31–36 RSC.
- D. Prat, O. Pardigon, H. W. Fleming, S. Letestu and V. Ducandas, et al. , Org. Process Res. Dev., 2013, 17, 1517–1525 CrossRef CAS.
- R. K. Henderson, C. Jimenez-Gonzalez, D. J. C. Constable, S. R. Alston and G. G. A. Inglis, et al. , Green Chem., 2011, 13, 854–862 RSC.
- C. M. Alder, J. D. Hayler, R. K. Henderson, A. M. Rodman and L. Shukla, et al. , Green Chem., 2016, 18, 3879–3890 RSC.
- D. Prat, J. Hayler and A. Wells, Green Chem., 2014, 16, 4546–4551 RSC.
- https://www.mane.com/innovation/green-motion .
- INERIS.
- J. Andrao and S. Murtuzaali, J. Chem. Educ., 2007, 84, 1004–1010 CrossRef.
- J. J. Vanden Eynden, Pharmaceuticals, 2016, 9, 1–16 CrossRef PubMed.
- R. A. Sheldon, J. Chem. Technol. Biotechnol., 1996, 67, 1–14 CrossRef CAS.
Footnote |
| † Electronic supplementary information (ESI) available. See DOI: 10.1039/d1gc00986a |
| This journal is © The Royal Society of Chemistry 2021 |

