 Open Access Article
Creative Commons Attribution 3.0 Unported Licence
Electrolyte-dependent deposition morphology on magnesium metal utilizing MeMgCl, Mg[B(hfip)4]2 and Mg(HMDS)2–2AlCl3 electrolytes†
Leon
Leuppert‡
a,
Adam
Reupert‡
 *a,
Thomas
Diemant
a,
Tom
Philipp
 b,
Christine
Kranz
 b,
Zhenyou
Li
 ac and
Maximilian
Fichtner
 *ad
*ad
aElectrochemical Energy Storage, Helmholtz Institute Ulm (HIU), Helmholtzstr. 11, D-89081 Ulm, Germany
bInstitute of Analytical and Bioanalytical Chemistry (IABC), Ulm University, Albert-Einstein-Allee 11, 89081 Ulm, Germany
cQingdao New Energy Shandong Laboratory, Qingdao Institute of Bioenergy and Bioprocess Technology, Chinese Academy of Sciences, No. 189 Songling Road, Laoshan District, Qingdao, 266101 China
dInstitute of Nanotechnology (INT), Karlsruhe Institute of Technology, P.O. Box 3640, D-76021 Karlsruhe, Germany. E-mail: m.fichtner@kit.edu
First published on 13th September 2024
Abstract
The deposition behavior of two state-of-the-art electrolytes, magnesium tetrakis(hexafluoroisopropyloxy)borate (Mg[B(hfip)4]2) in dimethoxyethane (DME) and magnesium bis(hexamethyldisilazide) with two equivalents of aluminum chloride (Mg(HMDS)2–2AlCl3) in tetrahydrofuran (THF) was investigated. Using symmetric flooded magnesium–magnesium cells with different electrolyte concentrations and current densities the deposition process was monitored optically in situ by a video microscope. The deposits were also investigated by scanning electron microscopy (SEM) and energy-dispersive X-ray (EDX) spectroscopy and compared to deposition from methylmagnesium chloride (MeMgCl) in THF, known for its dendritic growth. Furthermore, the chemical composition of the surfaces after deposition was tested by X-ray photoelectron spectroscopy (XPS). In this work, MeMgCl showed unidirectional growth and for the harshest applied conditions, mossy deposition, but no branching dendrites as previously reported in the literature. Mg[B(hfip)4]2 and Mg(HMDS)2–2AlCl3 did not show the formation of dendrites or a dendrite preform but also did not result in the desired smooth layer but in spherical deposits. For the Mg[B(hfip)4]2 electrolyte, the influence of magnesium borohydride (Mg(BH4)2) as an additive was additionally tested, resulting in a more planar growth.
Introduction
The current battery market is dominated by lithium-ion batteries, which consist of a transition metal oxide cathode and a graphite anode.1 The increasing demand for energy storage solutions and a growing demand for ecofriendly and more sustainable resources resulted in significant research efforts to find alternatives to lithium-ion based batteries. Magnesium is a promising candidate as it is nontoxic and has a higher earth crustal abundance and would therefore be a cheaper and more accessible option.2,3 The low redox potential of −2.37 V vs. SHE and the formation of bivalent cations, enabling two electron reactions on the electrodes, lead to high theoretical gravimetric (2205 mA h g−1) and volumetric (3833 mA h cm−3) capacities when utilizing a Mg metal anode.3–6There is a debate on whether Mg dendrites form on the metallic Mg anode.3 Most reports in the literature state a low tendency for dendrite formation or a completely dendrite-free deposition on the magnesium surface, thus enabling the use of metallic anodes.5–11 In contrast to lithium-ion batteries, which typically rely on intercalation-based anode materials like graphite to avoid dendrite formation, the dendrite-free nature and lower sensitivity to the atmospheric environment of magnesium allows the direct use of metallic Mg anodes, enabling potentially higher energy densities.6 On the other hand, due to its high reactivity, bare magnesium metal is known to easily oxidize and decompose a range of electrolytes and solvents forming a passivating surface which are, in contrast to solid electrolyte interfaces (SEI) on Li, Na or K, not ionically conducting. Therefore, Mg electrolytes are typically restricted to ethereal solvents like tetrahydrofuran (THF), dimethoxyethane (DME) or higher glymes (G2–G4). Classical polar solvents like carbonates (ethylene carbonate and propylene carbonate) or protic electrolyte salts like perchlorates (ClO4−) and hexafluorophosphates (PF6−) are known to passivate the magnesium surface.6,12,13 To enable the usage of these electrolytes and to reduce parasitic side reactions in general, alloying (with Bi and Sb) and surface coating of magnesium (Bi) are extensively investigated.6,9,14
Belonging to the class of non-corrosive weakly coordinating boron-containing electrolytes, magnesium tetrakis (hexafluoroisopropyloxy) borate (Mg[B(hfip)4]2, Fig. 1) possesses high ionic conductivity, oxidative stability and coulombic efficiency.3,5,15 The simpler synthesis, lower combustible nature and reactivity of fluoroalkoxyborates make them preferable over the also investigated fluoroalkoxyaluminates.5,16,17 The salt thereby relies on strong electron-withdrawing –CF3 groups and boron acting as a Lewis acid, forming a Lewis base adduct (B[hfip]4−), to increase the electrochemical window.5 Large anionic groups lower the anion–cation interactions, leading to excellent ionic conductivity (6.8 mS cm−1 at 25 °C).6,15 Depending on the synthesis route, a complete chloride-free salt (no halogen-based precursors) can be synthesized, enabling higher potentials than the usual chloride-containing electrolytes offer (3.2 V vs. Mg/Mg2+), avoiding parasitic corrosion reactions.15
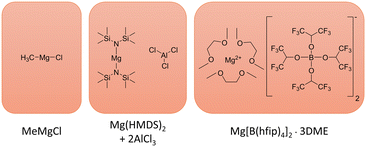 | ||
| Fig. 1 Structures of the MeMgCl, Mg(HMDS)2–2AlCl3 and Mg[B(hfip)4]2·3DME electrolytes. In the case of Mg(HMDS)2–2AlCl3 electrolyte, only the precursors are drawn, as a complex Schlenk equilibrium unfolds upon dissolving in a respective solvent. A detailed investigation of this behaviour was performed by Merrill and Schaefer.18 | ||
There have been several studies using Mg[B(hfip)4]2 as electrolyte – none of these have shown any sign of dendritic growth. Luo et al. observed a smooth and non-dendritic layer of magnesium using a 0.5 M solution of Mg[B(hfip)4]2 at 2.0 mA cm−2 for 3 h.19 Dlugatch et al. reported hexagonal crystals using a conditioned 0.3 M solution of Mg[B(hfip)4]2 in DME at current densities ranging from 0.5 to 5 mA cm−2 with a high proportion of magnesium in the deposits. A higher current density yielded more nucleation and smaller crystals.20 Similarly, hexagonal crystals were reported by Mandai et al. for a 0.3 M solution of Mg[B(hfip)4]2 in DME at 1 mA cm−2 for 3 h.21
While hexamethyldisilazide magnesium chloride (HMDSMgCl) showed only an inferior performance with regard to coulombic efficiency, voltage stability and conductivity on its own, the result could be considerably improved upon addition of MgCl2 or AlCl3.3
Merrill and Schaefer investigated several small magnesium nucleation spots for a 0.35 M electrolyte solution in diglyme containing magnesium bis(hexamethyldisilazide) with two equivalents of aluminum chloride (Mg(HMDS)2–2AlCl3, Fig. 1). A scanning electron microscopy (SEM) analysis revealed that these crystals showed only mossy and crystalline growth.18 Energy-dispersive X-ray (EDX) spectroscopy maps of a mossy deposit indicated that mainly aluminum was deposited followed by magnesium. Measurements of this electrolyte performed by Zhao-Karger et al. in our group showed no sign of dendrite formation after cycling for 60 times (2 mA cm−2 for 2 h). Replacing AlCl3 with MgCl2 to simplify the synthesis resulted in the formation of a chemically more stable and less sensitive and reactive electrolyte as well as lowering the corrosive nature.3,5,15
In contrast to these reports, Davidson et al. reported magnesium dendrite formation for an electrolyte system based on methylmagnesium chloride (MeMgCl, Fig. 1) in THF.22,23 Grignard reagent based electrolytes, like MeMgCl, belong to the first discovered class that showed successful magnesium plaiting stripping properties, but were soon replaced in their pure form, since the limited oxidative stability of Grignard reagents (between 1.0 and 2.2 V vs. Mg/Mg2+ on Pt) and their high reactivity severely hindered their application with several cathode materials.3,6,13 Later development led to the all-phenyl complex (APC) electrolyte, which was derived from the phenyl-Grignard reagent (PhMgCl) and AlCl3 in ether, leading to an increased oxidative stability above 3.0 V vs. Mg/Mg2+ on Pt.6
The results of Davidson et al. showed that dendrite formation may be possible, and that the deposition morphology has to be closer investigated in regard to the used electrolyte and other factors like current density and electrolyte concentration. Direct comparison of different literature on this topic should also be handled with care, as a varying electrode distance based upon different cell geometries can already alter the deposition morphology.24 Therefore, every magnesium electrolyte system must be tested and evaluated independently in a systematic approach under similar cell conditions for its tendency to form dendrites.
As the exact mechanism of magnesium deposition is not yet fully understood, a staged deposition mechanism that would govern dendrite formation will be explained by the well-studied example of Li dendrite formation. Basically, three different types of deposition can be distinguished: epitaxial, mossy, and dendritic growth.25,26 These deposition morphologies change depending on the overpotential, the growth mechanism and the time after which they can be observed.26,27 Detailed deposition mechanisms are complex, as they depend on a multitude of parameters that influence the appearance and shape of the deposits. The classical explanation for Li-dendrite formation follows a process containing the following steps:
1. At the onset of electrodeposition, an overpotential must be surpassed to initiate the nucleation on the anode surface. In the presence of a passivation layer or lower electronic conductivity, the energy required to generate nucleation sites is higher and thus the overpotential is increased.28,29 In the next stage of electrodeposition, epitaxial growth is typically observed as an initial morphology.25 There, the uniform growth is a result of the high cation concentration at the surface. Subsequently, the concentration near the electrode surface decreases during the electroplating process, allowing a low overpotential to maintain the applied current density.30
2. The second growth regime is mossy growth. As the cation concentration decreases, the deposits expand towards the bulk of the electrolyte where the concentration is higher. The overall mossy morphology consists of many root-growing whiskers that intertwine to form the observed structure.26
3. Finally, dendrites appear when the cation concentration at the surface becomes close to zero accompanied by a further drop in overpotential.25 Unlike whiskers, dendrites undergo branching and can penetrate a separator which causes battery failure.26 Non-equilibrium morphologies such as mossy growth and dendrites are a result of diffusion limitation, which follows any current density that is above the limiting current density and causes cation depletion near the electrode surface and an instantaneous reduction at the nearest surface.22,26,31–33
In that regard, this work investigated the plating of magnesium for two common magnesium electrolytes, Mg[B(hfip)4]2 in DME and Mg(HMDS)2–2AlCl3 in THF (Fig. 1) by time-lapse photography, SEM/EDX and X-ray photoelectron spectroscopy (XPS). Their deposition behavior in a flooded symmetric magnesium–magnesium cell was monitored for 8 h in a range of different electrolyte concentrations and current densities. The MeMgCl/THF electrolyte (Fig. 1) was chosen as a benchmark system for comparison with the work from Davidson et al. that observed dendrite formation on magnesium surfaces under these conditions and to serve as a baseline for the other two investigated electrolytes.22
Experimental
Electrochemistry and video microscopy
All experiments were carried out in an argon-filled glovebox (MBraun) with moisture and oxygen levels below 0.1 ppm. The electrochemical setup consisted of two magnesium electrodes in a parallel geometry with a distance of 17 mm between the electrodes and a reference Mg electrode (Mg foil, 0.1 mm thickness, 99.9% purity, Gelon Lib) placed in between them. The actual Mg electrode areas used for the individual experiments are tabulated in the ESI† (Tables S1–S3). To remove the oxidation layer, the facing sides of the electrodes were scraped with a scalpel right before usage. The electrolyte was added dropwise until the scratched part of the electrodes was submerged. The electrochemical measurements were performed with a PalmSense 4 potentiostat using chronopotentiometry (CP) by setting a fixed current that was calculated based on the submerged magnesium electrode surface and a duration of the experiments of 8 h. A video microscope (Cainda F210 WiFi Microscope) was used in the timed shot mode (20 seconds between each picture) to monitor the plating reaction.Preparation of the electrolytes
All solvents were dried with molecular sieves (3 Å, Acros Organics) for at least 48 h prior to use. Before drying, the molecular sieves were activated by heating to 295 °C overnight in a vacuum of 1 × 10⁻³ bar. Karl Fischer titration measurements (ESI† Fig. S1) revealed water contents of 8.2 ppm for THF and 15.0 ppm for DME.Characterization via SEM/EDX, XPS and FIB cross-sectioning
After plating, the electrodes were removed from the electrochemical cell, washed carefully with the respective electrolyte solvent (THF or DME) and removed from the glovebox. Air contact was kept at a minimum during loading into the SEM chamber by keeping the samples in an airtight container, only exposing the samples to the atmosphere during fixation on the SEM stub. SEM/EDX measurements were performed using a Thermo Scientific Apreo 2 instrument equipped with an Ultra-Dry EDX detector. For SEM imaging, a voltage of 10 or 20 kV and a current of 13 nA was used. EDX maps were recorded with a map resolution of 768 × 512 pixels, a frame time of 30 s and a dwell time of 76.30 μs, utilizing the same voltage and current parameters as for the SEM images. XPS-samples were prepared from plating experiments that were performed using the lowest electrolyte concentration and the highest current density, as these conditions are the most prone to show electrolyte decomposition and SEI formation. All samples were washed with the respective electrolyte solvent prior to the transfer. Transfer to the load lock of the XPS system (Specs, Germany) was done in an airtight container. The XPS data were collected using monochromatic Al Kα radiation (200 W, 12 kV) and a pass energy of 30 eV for the detailed measurements. All binding energies were calibrated to the C 1s peak of C–C/C–H species at 284.9 eV. Peak fit was carried out by Casa XPS using Shirley-type backgrounds together with Gaussian–Lorentzian (GL30) peak shapes. Focused-ion beam (FIB) cross-sectioning and ion-induced SE imaging was performed on a Helios Nanolab 600 system (Thermo Fisher Scientific, USA). First a protective Pt layer of approximately 500 nm was deposited by ion beam induced deposition (IBID) using methylcyclopentadienyl trimethyl platinum (C9H16Pt) as precursor. Afterwards, a wedge was excavated using ion currents of 9 nA at 30 kV with a final cleaning step of the resulting cross section at 0.9 nA. Ion-beam induced SE imaging was performed at an ion current of 9 pA using an Everhart–Thornley detector.Karl Fischer titration and ionic conductivity measurements
The water content of THF and DME was tested using a Mettler Toledo C10S Coulombic KF titrator with a methanol-based anolyte (Hydranal™ Coulomat AG, Honeywell). 0.5 ml of solvent was added after drift stabilization below 10 μg min−1 after the automatic pre-titration of the instrument. Ionic conductivity measurements were performed with a BioLogic MCS-10 instrument using a 1 M KCl solution for calibration of the cell constant. The cell consisted of 2 platinum electrodes with a distance of 3 mm and a surface area of 15 mm2 and were filled with 1 mL of test substance. All measurements were performed at 25 °C for 30 min. Only conductivity values after 15 min were accounted and averaged to ensure temperature equilibration.Data management
All data (measurements, raw and processed) were managed using an instance of the Karlsruhe data infrastructure for materials science (Kadi4mat) and are published following the FAIR (Findable, Accessible, Interoperable and Reusable) principles in accordance with the German Research Foundation guidelines at the Zenodo open repository and can be accessed by the following DOI: https://doi.org/10.5281/zenodo.10890167.36,37 A schematic representation of the data management structure is provided in the ESI† (Fig. S22).Results and discussion
A short explanation of the terminology used for the different deposit appearances as well as videos of all hereinafter mentioned experiments can be found in the ESI† (Fig. S3 and Videos S1–S28).MeMgCl in THF
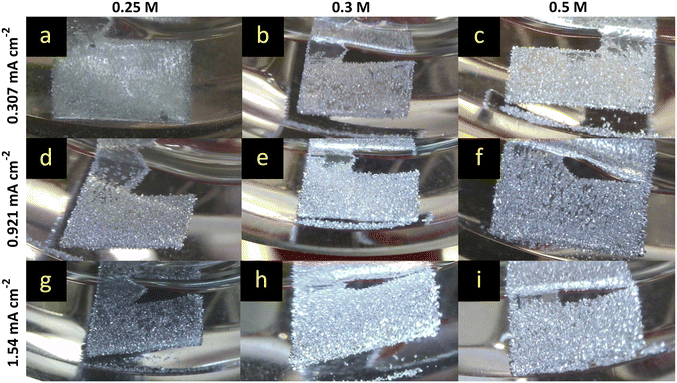
The benchmark MeMgCl electrolyte (Fig. 2) showed a homogeneous, needle-like magnesium deposition throughout the entire Mg foil surface for every current (0.307 mA cm−2, 0.921 mA cm−2 and 1.54 mA cm−2) and electrolyte concentration (0.25 M, 0.3 M and 0.5 M). The recorded time-lapse photography revealed no big difference by varying the electrolyte concentration while keeping the current density fixed. On the other hand, by increasing the current density, the deposits appeared more closely packed and larger in size. This can be explained by Faraday's laws of electrolysis. A higher electron flow, dictated by the fixed current setting in the CP measurement mode, leads to more cations that are being reduced within the same time frame of 8 h. As no gas evolution or other visual side reaction and only growth of the deposited mass was observed, this indicated a sufficient ionic conductivity of the electrolyte. Conductivity measurements of MeMgCl (ESI† Table S4) showed low ionic conductivity ranging between 0.062 and 0.199 mS cm−2. Among all electrolytes investigated in this paper, it exhibits the lowest ionic conductivity while also being applied with the highest molarities. Apart from the experiment with the lowest current and electrolyte concentration (Fig. 2a), dead detached magnesium can be seen at the bottom of all vials. This could be related to facilitated growth of larger particles that break free more easily and to weaker adhesion of the deposits on the magnesium surface, therefore requiring lower force to detach.Further analysis of the electrochemical data showed a decrease of overpotential with an increased concentration of MeMgCl (shown in Fig. 3). This can be explained by the consumption rate of cations and the created concentration gradients, which are reflected in the ionic conductivity. A constant ion flux is needed to maintain the current. Generally, up to a certain point, an increased electrolyte salt concentration provides more cations and therefore usually increases the ionic conductivity. Therefore, a lower voltage is sufficient to provide an ion flux that replaces the consumed species at the surface during the deposition reaction. Higher current densities of the same concentration resulted in higher overpotentials as the consumption of Mg cations is accelerated.
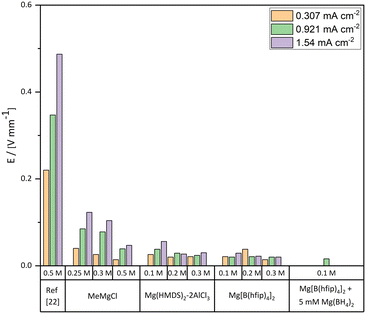 | ||
| Fig. 3 Plating potential over distance values for all measured electrolytes in a range of different concentrations and current densities. In the case of the benchmark MeMgCl electrolyte, reported values of the 0.5 M electrolyte by Davidson et al. were added for better comparison.22 | ||
Interestingly, a comparison of our results with the findings of the referenced paper of Davidson et al. shows completely different results for the 0.5 M MeMgCl electrolyte (Fig. 2 and 3).22 The overpotentials were only about 10% of the reported values of Davidson et al. for all applied current densities. Besides the measured plating potentials, there were also visual differences regarding the location of magnesium deposits. In our experiments, crystallites nucleated and grew on the entire metal surface under all used experimental conditions. On the other hand, the report by Davidson et al. shows a preferred deposition area on the edges of the immersed magnesium ribbons and predominant growth in the form of branching dendrites on the two corners.22 As no details on the preparation or preconditioning of the electrodes prior to plating were provided in their experimental section, we assume that the magnesium foils were directly used as received. This would explain the differences compared to our report, since herein all surfaces of the magnesium foils were scratched inside a glovebox to reduce the MgO layer to a minimum before the plating experiments were performed. A bandgap of around 7 eV renders MgO as an isolator and therefore deposition would be strongly hindered on thick MgO surfaces due to the low electronic conductivity.38 Any edge, obtained by cutting the electrode to its size, would expose a fresh magnesium surface (cutting edge) with a considerably thinner MgO layer. Furthermore, as in both studies fixed current densities were set, but in the case of Davidson et al. most of the surface was supposedly passivated, the effective current density would be significantly higher on the active spots (the cutting edges). This leads to harsher deposition conditions as the fixed current and therefore fixed deposition mass of magnesium have to be accommodated by these few spots. Paired with the low ionic conductivity, a strong concentration gradient in the electrolyte is the result leading to dendrite growth at these positions.
Hence, we attribute the observed fractal structures and a stronger branching in their report to an increased effective current density. In our work no fractal structures or branching were observed under the same conditions of 0.5 M, 8 h of deposition and current densities of 0.307, 0.921, and 1.54 mA cm−2 (Fig. 2c, f and i).
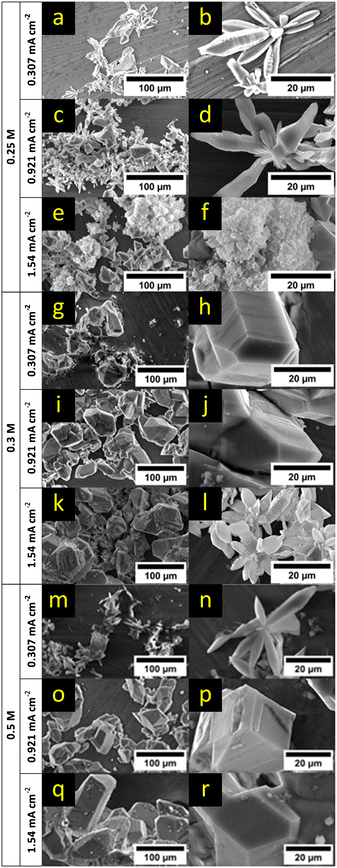
For further analysis, SEM measurements of the formed deposits after 8 h of plating in different electrolyte concentrations (0.25 M, 0.3 M and 0.5 M) and for different current densities (0.307 mA cm−2, 0.921 mA cm−2 and 1.54 mA cm−2) were collected (Fig. 4, respective EDX maps: ESI† Fig. S4–S12). An increase of the current density led to an increase of nucleation sites and larger deposits for the lowest and middle electrolyte concentration. For the highest electrolyte concentration (0.5 M), the nucleation density appeared to be similar and only the size of deposits grew with increasing current density. In all cases, root-growing deposits with unidirectional growth towards the electrolyte (Fig. 4b, d and l–n) as well as crystalline growth (Fig. 4a, c, e, g–i, k and o–r) were observed. In the case of the lowest electrolyte concentration and the highest current density, isotropic deposits could be observed besides the crystalline growth as shown in Fig. 4e and f. These mossy structures were mainly on top of already formed crystalline deposits and could be explained by the rapid consumption of cations not preferring a crystal orientation anymore. This can be understood as the reduction rate is high at the highest current density, but the cation concentration and ionic conductivity is at the same time the lowest. Therefore, the reported overpotentials in Fig. 3 showed also the highest value under these conditions and indicated a strong concentration gradient near the surface. For higher concentrations, the concentration gradient will be less strong and thus no signs of mossy deposition were found. In contrast, in the case of higher electrolyte concentrations and high current densities, primary deposits were covered by a few new small but also crystalline nucleation sites as depicted in Fig. 4q and r.
EDX maps of the electrodes (ESI† Fig. S4–S12) indicate that the deposits consisted mainly of magnesium with traces of oxygen, chloride, and carbon. Oxygen presumably can be attributed to MgO and/or Mg(OH)2 that could result from reactions with trace amounts of water in the solvent during the washing step, from exposure of the sample to air during loading of the samples into the SEM chamber or reactions of the Mg/MgO surface with the electrolyte (Grignard compound and/or THF). Chloride can be related to decomposition of the electrolyte, since MgCl2 is a known product from the process of electrodepositing Grignard reagents.39
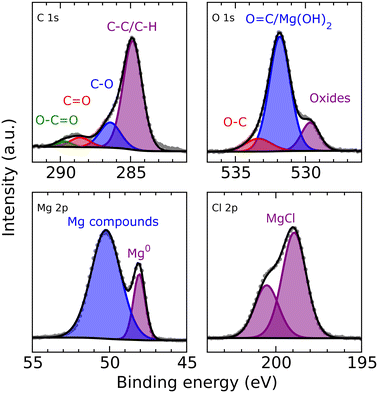
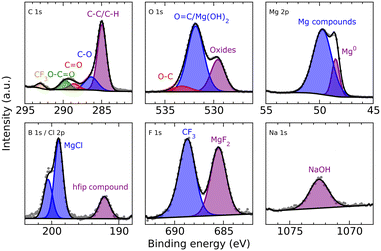
XPS analysis (Fig. 5) of a magnesium electrode after deposition (8 h from a 0.25 M MeMgCl–THF solution with a current density of 1.54 mA cm−2) revealed several organic species in the surface layer that could result from deposition of decomposition products of THF and/or the Grignard reagent. Furthermore, the spectra corroborated, besides freshly deposited metallic Mg the presence of other Mg compounds like MgCl2 and MgO. The comparatively large intensity of the O 1s peak at 531.8 eV indicates that this peak could contain also a contribution from Mg(OH)2 besides the O![[double bond, length as m-dash]](https://www.rsc.org/images/entities/char_e001.gif) C group signal, which should also appear at this binding energy. All identified components show good qualitative agreement with the EDX measurement, especially when keeping in mind the different sampling depths of EDX and XPS measurements.
C group signal, which should also appear at this binding energy. All identified components show good qualitative agreement with the EDX measurement, especially when keeping in mind the different sampling depths of EDX and XPS measurements.
Although all MeMgCl results showed no actual dendrite formation for this electrolyte, the mossy growth observed for the highest current density and the lowest electrolyte concentration resulted in a well-known preform of dendrites.40 An increase of the effective current density, which we assume happened in the work of Davidson et al. by not removing the MgO surface, would therefore most likely trigger the formation of branching dendrites.22
Mg(HMDS)2–2AlCl3 in THF
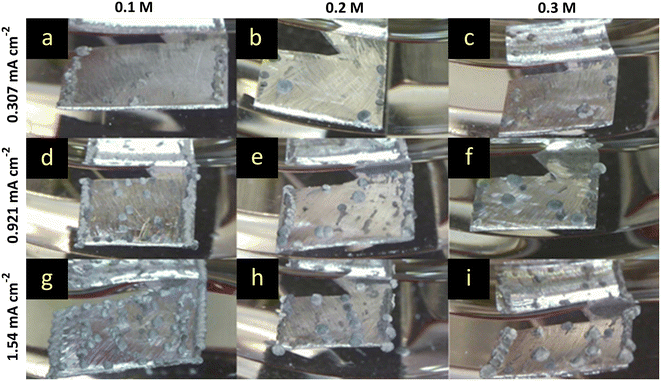
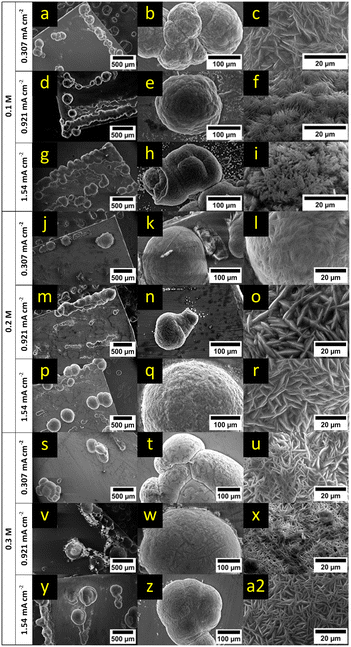
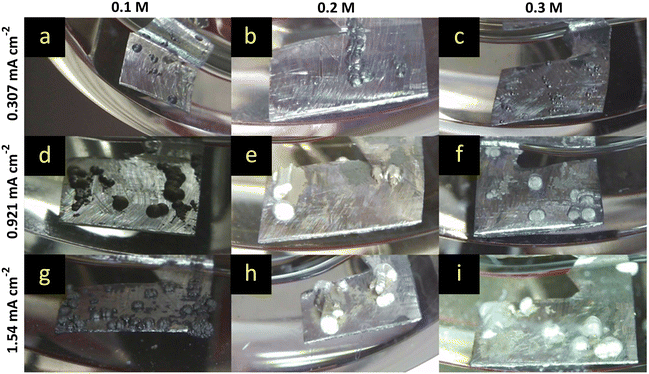
The comparison of overpotentials between the MeMgCl and the Mg(HMDS)2–2AlCl3 electrolyte (Fig. 3) shows decreased overpotentials in all cases for the Mg(HMDS)2–2AlCl3 electrolyte. An increased electrolyte concentration correlated with a decrease of the overpotential. On the other hand, a higher current density resulted in higher overpotentials. These trends were similar to the MeMgCl system and could likewise be explained by ion flux and the cation consumption rate and thereby related to the ionic conductivity of the electrolyte solution.Compared visually, the most apparent difference of the time-lapse photography results (Fig. 6) from the previously discussed MeMgCl electrolyte (Fig. 2) was the shape and amount of nucleation spots. Instead of a complete coverage by tiny particles, this electrolyte promotes the formation of larger spherical deposits ranging from 100 μm to 500 μm in diameter (Fig. 6a and g and 7a and y), while most of the electrode surface remained visually unaltered. An increased current density led to an increase of nucleation spots and deposited magnesium. For higher electrolyte concentrations, the number of nucleation spots decreased. The higher nucleation tendency for decreasing electrolyte concentrations (Fig. 6g–i) and increasing current densities (Fig. 6a, d and g) could be correlated with the measured higher overpotentials. For low concentrations, it appeared that not enough magnesium ions were in solution to satisfy the applied current by diffusion to the initially formed nucleation sites. Hence, the nucleation energy was exceeded, and new nucleation appeared until the overpotential dropped below the required nucleation energy. The current was then maintained by mass transport towards the nucleation sites. For higher concentration this effect would be less pronounced as more magnesium ions are in solution leading to a higher ionic conductivity. Measurements of the ionic conductivity (ESI† Table S4) support these observations as the ionic conductivity increased between 0.1 M and 0.3 M from 1.523 mS cm−2 to 2.915 mS cm−2. The same effect appeared for an increased current density while keeping a fixed concentration.
Closer analysis of the magnesium surface by SEM images (Fig. 7, respective EDX maps: ESI† Fig. S13–S21) showed that for all concentrations and applied currents, the major part of the surface was not covered, indicating large passivated areas which would increase the effective applied current density in all cases.
For the lowest electrolyte concentration (0.1 M) and higher applied currents (0.921 mA cm−2 and 1.54 mA cm−2), small nucleation sites could be observed close to the larger deposition on the magnesium surface (Fig. 7e and h). No sign of classical dendrite formation was observed under the harshest conditions (lowest concentration and highest current density) for this electrolyte within the 8 h plating time frame. The surface morphology of the larger deposits changed significantly for the lowest electrolyte concentration by variation of the current density. At the lowest current density, the surface looked like ridges and platelets (Fig. 7c). Higher currents yielded thin needles (Fig. 7f) and in the case of the highest current density, an inhomogeneous and rough surface could be observed (Fig. 7i). The primary size of the surface particles decreased with an increase of current density, and intergrown particles could be observed more often (Fig. 7a, d and g).
The 0.2 M electrolyte resulted in small nucleation sites for the middle and highest current density along the electrode surface (Fig. 7n and q). In the case of the lowest current density the surface of the deposition appeared homogeneous (Fig. 7l). The middle and highest current density resulted in ridges which share a length of about 20 to 30 μm (Fig. 7o and r). These observations follow the same trend as described for the lower concentration. However, the roughness of the deposit surface was reduced and ranged only from smooth to ridges without showing any needle-like growth. This can be again explained by the higher availability of cations leading to a lower level of depletion within the electrolyte near the surface.
The number of nucleation spots for the 0.3 M electrolyte increased only slightly with an increased current density (Fig. 7s, v and y). In contrast to the lowest and middle current density, only a few nucleation sites formed on the surface. This can be explained by the higher concentration of Mg cations. The deposition spots are limited to the initial nucleation sites and the ion flux towards the few deposits is sufficient to maintain the current, leading to a low overpotential. Similar to the other concentrations, the overall shape of the deposits was spherical (Fig. 7s, v and y). The surface of the deposits did not change significantly for varied current densities and can be described as needle/ridge-like (Fig. 7u, x and a2). The ridges were between 10 and 20 μm in length. The roughness of the deposition surface was higher than that of the 0.2 M solution. This might be related to the missing nucleation on the electrode surface.
EDX maps of the deposits (ESI† Fig. S13–S21) confirmed a successful plating of magnesium. Additional traces of oxygen, carbon, chlorine and aluminum suggest a slight decomposition of the electrolyte salt in our experiments.
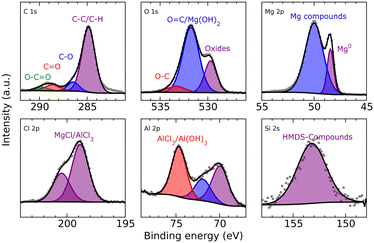
XPS analysis of the deposited magnesium (Fig. 8) shows hydrocarbons derived from decomposition of either the solvent or salt. Furthermore, closer analysis shows again in the O 1s spectrum the superimposed peak of carbonyl groups that could also be related to Mg(OH)2 formation and can be explained like in the case of MeMgCl either by decomposition of THF or the reaction of the surface MgO with the electrolyte species. Some reaction with residual traces of water in the electrolyte would also be possible. As already indicated by the EDX measurements, chloride (MgCl2/AlCl3) and aluminum (AlCl3/Al(OH)3) could also be detected. Finally, the incorporation of HMDS or its decomposition products was signaled by the measurement in the Si 2s region (the measurement in the Si 2p region was perturbed by the presence of a Mg 2s satellite feature).
Mg[B(hfip)4]2 in DME
Compared to the previous tested electrolytes, Mg[B(hfip)4]2 showed the lowest absolute overpotentials for all applied conditions (Fig. 3) as well as a lower increase of the overpotential within the same system by utilizing lower concentrations or higher current densities. The lower increase may be related to multiple factors like the changed desolvation energy of the solvent changing from a THF coordinated Mg-Cl cluster [MgClx(THF)y]+ to a DME coordinated Mg cluster [Mg(DME)3]2+. Other reasons may be a lower stripping energy of the bulky B(hfip)4− anion required to plate the magnesium cations. A higher ionic conductivity or differences of the interface between electrolyte and magnesium metal may also contribute. Ionic conductivity measurements (ESI† Table S4) of the Mg[B(hfip)4]2 electrolyte salt support the low overpotential as they showed a three to four times increased conductivity in comparison with the Mg(HMDS)2–2AlCl3 electrolyte, ranging between 5.962 and 8.043 mS cm−2. Changing the solvent from DME to THF reduced the ionic conductivity by 1–2 mS cm−2. A theoretical work of different solvent interactions with the Mg[B(hfip)4]2 electrolyte as well as solvent-dependent plating/stripping mechanisms and desolvation energies utilizing different glymes and THF was discussed in detail by Drews et al.41The low overpotentials of the Mg[B(hfip)4]2 electrolyte indicate that the actual plating process of magnesium required less energy compared to the MeMgCl electrolyte. However, the overall trend by increasing the current density or the concentration was similar to the previously tested electrolytes and can likewise be explained.
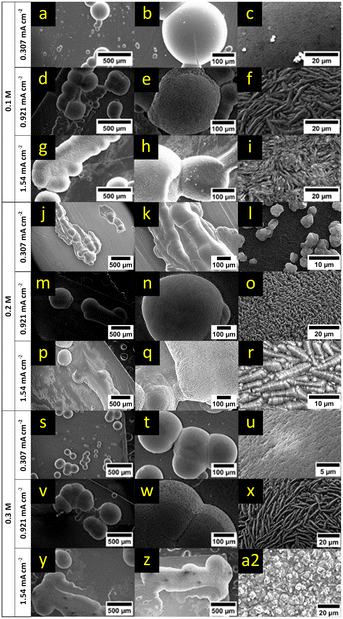
Like Mg(HMDS)2–2AlCl3, Mg[B(hfip)4]2 shows only a few spherical deposits on the magnesium surface (Fig. 9). Compared to the previously discussed electrolytes, the surface of the deposits from Mg[B(hfip)4]2 appeared less reflective after the plating process and in some videos changed from a metallic reflective look to a duller black appearance during plating (ESI† Videos S19–S27). This happened immediately for low current densities and for higher current densities, once the deposits reached a certain size. The effect seems to be current density related, as larger deposits would lower the effective current density by exposing a larger active surface. Therefore, it might be related to the particle size and how densely the deposits arranged/agglomerated. Another explanation may be a change of the surface roughness of the deposits, thereby affecting the reflection properties. No detached magnesium was observed in all cases after 8 h of plating. While the low current density showed small individual nucleation spots (Fig. 9a and c), the higher current densities often resulted in growth along other deposits or connected deposits, indicating either preferred regions for initial nucleation or a preferred directional growth along the electrode surface.
The low overpotentials paired with only a few deposition sites may look contradictive but could be explained by assuming that the initial nucleation was hindered. This may have happened by a residual thin layer of MgO blocking the surface. Another reason may be the decomposition of the electrolyte, forming a passivating layer with low ionic conductivity or a combination of both. There are reports in literature that support both explanations, as chloride ions are discussed to have a corrosive nature leading to activation/preconditioning of the magnesium surfaces like in the case of the MeMgCl and Mg(HMDS)2–2AlCl3 electrolyte.39 There are also reports of solid interfacial layer formation from electrolyte decomposition on cycled magnesium electrodes for the Mg[B(hfip)4]2 and Mg(HMDS)2–2AlCl3 electrolytes.9,42 In both cases, the nucleation would be hindered. After initial nucleation, cations can become attached at the fresh magnesium surface of the formed deposition sites instead of creating new nucleation sites, requiring less energy and therefore leading to a potential drop in the measurements.
This would create only a few active spots that now must satisfy the applied current leading to a higher current density as the initial calculation was designed for the whole electrode surface (similar to our assumed conditions in the Davidson et al. reference).22
SEM analysis (Fig. 10, respective EDX maps: ESI† Fig. S22–S30) of deposits from the lowest electrolyte concentration shows that the deposits merged for all tested current densities. In the case of the lowest current density clearly defined spheres are observed (Fig. 10a). Higher current densities resulted in rod-like deposits consisting of multiple spheres grown together (Fig. 10d and g). For the lowest and middle current density, the largest part of the electrode surface remained unchanged. In contrast, the highest current density yielded hundreds of small nucleation sites with a diameter of <5 μm on the foil around the primary deposits (lighter spots on the foil, shown in Fig. 10h upper half). The morphology of the primary deposits was highly dependent on the applied current density. For the lowest current density, the surface was relatively smooth (Fig. 10b and c). The middle current density resulted in smooth (Fig. 10e) as well as ridge-like (Fig. 10f) surfaces. Among them, the smooth surface appeared on the smaller deposits, while the rough surface could be observed for the larger deposited particles. A needle-like surface appeared for the highest current density (Fig. 10i). An explanation for these current density related surface morphologies may be the different consumption/depletion rates of Mg cations paired with the low concentration of magnesium cations in the electrolyte. For a high current density, reduction of the cations happened instantly when reaching the active surface which led to the uneven morphology of deposits. The small dimension of nucleation sites seen for the highest current density can be explained likewise, as the strong depletion of cations near the surface overcame the energy required for nucleation and therefore new nucleation sites appeared at the harshest conditions.
In the case of the 0.2 M electrolyte no distinct differences in morphology of the primary deposits were observed for the applied current densities besides larger diameters for increased current densities. As for the 0.1 M solution, the highest current density showed hundreds of small nucleation sites along the deposits on the surface (Fig. 10p and q). The surface of the larger deposits changed from smooth with on grown small secondary deposits (Fig. 10l) to a rough surface made of ridges and valleys (Fig. 10o) and to caterpillar-like segments with about 10 μm in length (Fig. 10r) for the low, middle and highest current density, respectively.
In general, the ionic conductivity of the borate-based electrolyte reaches a maximum at a concentration of 0.3 M, which is also the standard electrolyte concentration reported in most papers regarding this electrolyte.21 In our case, the highest conductivity was already reached at 0.2 M, but the 0.3 M electrolyte showed almost comparable conductivity with only a small deviation (<200 μS cm−2, see ESI† Table S4). As for the other two concentrations, the lowest and middle current densities resulted in a few big deposits (Fig. 10s and v). These deposits are spherical and sometimes grown together (Fig. 10t and w). The highest current rate yielded big spherical and grown together deposits as well as many small nucleation sites along the electrode surface (Fig. 10y and z). The morphologies of the deposits are different for the applied current densities but are in line with the observations from the lower concentrations. With increasing current density, the morphology changed from a smooth to a ridge-like surface of about 20 μm in length (Fig. 10u and x). The highest current density resulted in a non-uniform, rough surface with embedded small particles (Fig. 10a2). The observed distinct differences of the surface morphology support the assumption that the change in reflection and the dull appearance in the time-lapse videos are related to the surface roughness of the particles.
EDX maps of deposits from the Mg[B(hfip)4]2 electrolyte system (ESI† Fig. S22–S30) show mainly magnesium with traces of oxygen, boron, carbon, and fluorine. The observed oxygen content may be attributed to MgO formation while the sample was exposed to air during the loading of the sample into the SEM chamber but may also be related to a slight decomposition of the electrolyte salt on the surface. Boron, carbon, and fluorine can be related to residual, recrystallized electrolyte salt that was not completely washed away while rinsing with DME or, more likely, to decomposition products of the electrolyte salt, as also previously reported in the literature.42
XPS measurements of the freshly deposited magnesium (Fig. 11) showed organic species most likely related to decomposed DME but also fluorinated groups that derived from decomposition of the hexafluoroisopropyloxy groups (hfip). This is also supported by the B 1s spectra that showed one signal at the typical position where borates would be positioned, indicating the presence of some B–O compounds. Besides CF3, also MgF2 was identified in the F 1s spectrum, pointing to magnesium anode passivation through electrolyte salt degradation. Small amounts of sodium and chloride indicate a non-complete metathesis reaction or incomplete separation of the salt precursors during filtration (NaBH4 and MgCl2) of the Mg[B(hfip)4]2 electrolyte salt during synthesis.
As the primary deposits from the Mg(HMDS)2–2AlCl3 as well as Mg[B(hfip)4]2 electrolyte featured a similar spherical appearance without the typical crystalline growth, a closer inspection of FIB cross-sectioned samples was performed (Fig. 12). Mg(HMDS)2–2AlCl3 shows larger radially collocated grains within the primary deposit. This indicates a more spot originated growth of the larger spheres resulting in individual primary deposits on the electrode surface. In the case of Mg[B(hfip)4]2, smaller intertwined grains are observed with no distinct collocation. This results in a rough surface with all kinds of crystal orientations promoting further nucleation on the primary deposits, supporting the lowest observed overpotentials among the investigated electrolytes.
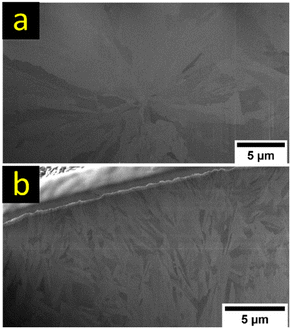 | ||
| Fig. 12 Ion-induced SEM images of FIB cross sections of Mg deposits from 0.2 M Mg(HMDS)2–2AlCl3 (a) and 0.2 M Mg[B(hfip)4]2 (b) electrolyte solutions obtained with a current density of 0.307 mA cm−2. | ||
Morphological influence of Mg(BH4)2 as electrolyte additive for the Mg[B(hfip)4]2 electrolyte
The influence of Mg(BH4)2 as an electrolyte additive was tested with respect to the obtained morphology, as it showed beneficial plating/stripping performance when combined with the Mg[B(hfip)4]2 electrolyte.43 It has been discussed in literature that Mg(BH4)2 may remove the oxidized layer of magnesium on the electrode surface and enhance the formation of a solid electrolyte interphase layer. Mg(BH4)2 could also act as a water scavenger lowering the concentration of residual water traces and therefore lower parasitic reactions and passivation reactions on the Mg-anode.43Instead of a few spherical deposits (Fig. 13a), the solution with the additive yielded large, planar-like deposition (Fig. 13e and f). Additionally, many small nucleation sites, partially intergrowing, could be observed around the planar-like deposit (Fig. 13g). Compared to the electrolyte without additive that showed a smooth and ridge-like surface of the deposits, only one appearance of the surface, which consisted of small crystalline particles, could be observed for the solution with the additive (Fig. 13h).
 | ||
| Fig. 13 SEM comparison of magnesium deposits from a 0.1 M Mg[B(hfip)4]2 solution (a–d) and a Mg[B(hfip)4]2 solution containing 5 mM Mg(BH4)2 (e–h). The pictures (a)–(c) were already presented in Fig. 10d–f but were reused for better comparability with the additive. Pictures (c and d) show the surface of the largest and one of the smaller deposits featured in (b), respectively. | ||
The overpotential of the additive containing electrolyte solution was slightly decreased by 4 mV mm−1, indicating a lower barrier for the deposition of cations. This can be explained by the removal of MgO from the electrode surface and therefore lowering of the nucleation energy required for the direct nucleation on the surface, leading to a more even deposition on the electrode surface.43 EDX measurements (ESI† Fig. S31) showed similar results like the electrolyte without borohydride addition.
Morphological influence of solvent and water content for the Mg[B(hfip)4]2 electrolyte
All electrolyte systems were investigated in their classical solvents. To be comparable with the benchmark experiments of Davidson et al., MeMgCl was measured in THF. Most reports about Mg(HMDS)2–2AlCl3 use THF. Mg[B(hfip)4]2 is usually dissolved in glyme-based solvents, most commonly DME. To exclude that the change from THF to DME had a significant impact on the Mg-depositing nature in the case of the Mg[B(hfip)4]2 electrolyte, additional tests with THF as solvent were carried out. Fig. 14b shows the Mg deposition after 8 h from a 0.1 M Mg[B(hfip)4]2 electrolyte in THF. Regarding the morphology, these results match well with the results obtained from the DME-based electrolyte. In both cases, single spherical deposits and no dendrite formation can be observed.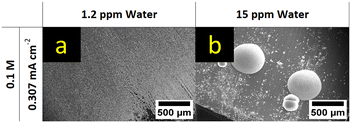 | ||
| Fig. 14 SEM comparison of magnesium deposits from a 0.1 M Mg[B(hfip)4]2 electrolyte dissolved in THF containing (a) 1.2 ppm water and (b) 15 ppm water. | ||
Various electrolyte systems need conditioning cycles, often related to trace levels of water or impurities in the electrolyte solutions, to reach their optimal performance. In the case of the investigated MeMgCl electrolyte, residual water in the solvent would directly react with the Grignard compound and therefore be eliminated. For the Mg(HMDS)2–2AlCl3 and Mg[B(hfip)4]2 electrolytes this is not necessarily the case and needs closer investigation. In particular, the addition of Mg(BH4)2 and its influence on the depositing nature might indicate that water traces in these electrolytes could directly influence the nucleation amount and morphology of the deposited magnesium. A comparison of plating experiments utilizing THF with water levels of 1.2 ppm and 15 ppm (Fig. 14; EDX, ESI† Fig. S32) show a drastic change of the deposited Mg in morphology and surface coverage. Lower water levels led to a uniform deposition of Mg on the whole surface. Individual crystals grew into each other, creating a planar deposition on the Mg anode. Repetition with other concentrations and current densities showed the same behavior (SEM, ESI† Fig. S33; XPS, ESI† Fig. S34). This indicates that a higher water content passivates the magnesium anode and the energy barrier for nucleation becomes higher as magnesium is preferentially deposited on only a few initially created nucleation spots instead of further nucleation.
Nevertheless, utilizing solvents with higher water contents (8.2 ppm and 15 ppm for THF and 15 ppm for DME) did not result in dendrites, although non-uniform deposition appeared when increasing the effective current on these spots significantly.
Conclusions
Whether magnesium forms dendrites in a magnesium battery is a controversial topic in the literature, which often lacks in-depth investigation of the influence of the experimental conditions. Several reports claim a dendrite-free nature of magnesium plating but neglect the complex interaction of different parameters like concentration and current density, which determine the deposition morphology. In this study, we used two state-of-the-art electrolytes, (Mg[B(hfip)4]2 and Mg(HMDS)2–2AlCl3), and we investigated their tendency for dendrite formation under the reported conditions that had previously shown dendrite formation for the Grignard-based MeMgCl electrolyte. For better comparability with results presented in the literature, MeMgCl was tested under the same conditions to serve as an internal standard.EDX and XPS measurements confirmed that MeMgCl, Mg[B(hfip)4]2 and Mg(HMDS)2–2AlCl3 deposited mainly magnesium along with decomposition products from the electrolyte salts. Previous investigations with MeMgCl showed clear transition from a kinetic- to a diffusion-controlled plating that led to the formation of dendrites.22,23 Our results could not reproduce this behavior and showed only a dendrite preform which we mainly attributed to differences in the preparation (scratching) of the Mg surface and thereby the removal of a thick MgO layer. In our work, deposition from MeMgCl resulted in a homogeneous coverage of root growing unidirectional deposits that nucleated across the whole electrode surface. Overpotentials for the 0.3 M electrolyte solutions at a current density of 1.54 mA cm−2 showed a decreasing trend from 104 mV mm−1 to 30 mV mm−1 to 20 mV mm−1 for the MeMgCl, Mg(HMDS)2–2AlCl3 and Mg[B(hfip)4]2 electrolytes, respectively. The deposits obtained for these electrolytes appeared spherical with no clear crystalline appearance and thereby showed no transition to diffusion-limited growth that would lead to dendrite formation under the applied conditions. Mg deposits from the two state-of-the-art electrolytes Mg(HMDS)2–2AlCl3 and Mg[B(hfip)4]2 showed denser packing compared to the Grignard electrolyte, which can be seen as an advancement towards a planar Mg plating. However, due to the thin native oxide layer on pristine Mg foil and trace water contents of the solvents, only a few spots were active during electrochemical cycling. Adding Mg(BH4)2 effectively eliminated residual water traces of the solvent and removed the surface oxide layer, thereby triggering a more homogeneous anode reaction with smooth deposits. Utilizing a solvent with lower water content shifted the deposition from a spherical non-uniform deposition morphology to a crystalline and planar plating behavior.
Among the tested electrolytes, Mg[B(hfip)4]2 showed the best performance and could become a benchmark electrolyte requiring further experimental optimization, e.g., other electrolyte additives or in combination with surface-modified Mg foils.
Data availability
All data (measurements, raw and processed) were managed using an instance of the Karlsruhe data infrastructure for materials science (Kadi4mat) and are published following the FAIR (Findable, Accessible, Interoperable & Reusable) principles in accordance with the German Research Foundation guidelines at the Zenodo open repository and can be accessed by the following DOI: https://doi.org/10.5281/zenodo.10890167.Author contributions
Leon Leuppert: investigation (lead); formal analysis (lead); writing – original draft (equal). Adam Reupert: methodology (lead); supervision (equal); data curation (lead); writing – original draft (equal). Thomas Diemant: investigation (supporting); writing – review & editing (equal). Tom Philipp: investigation (supporting); writing – review & editing (equal). Christine Kranz: resources (supporting); writing – review & editing (equal). Zhenyou Li: writing – review & editing (equal). Maximilian Fichtner: conceptualization (lead); resources (lead); supervision (equal); writing – review & editing (equal).Conflicts of interest
There are no conflicts to declare.Acknowledgements
This work contributes to the research performed at CELEST (Center for Electrochemical Energy Storage Ulm-Karlsruhe) and was funded by the German Research Foundation (DFG) under Project ID 390874152 (POLiS Cluster of Excellence, EXC 2154). The authors acknowledge the Focused Ion Beam Center UUlm for enabling FIB cross-sectioning and ion-induced SE imaging.Notes and references
- J. W. Choi and D. Aurbach, Nat. Rev. Mater., 2016, 1, 16013 CrossRef CAS.
- P. Saha, M. K. Datta, O. I. Velikokhatnyi, A. Manivannan, D. Alman and P. N. Kumta, Prog. Mater. Sci., 2014, 66, 1–86 CrossRef CAS.
- R. Dominko, J. Bitenc, R. Berthelot, M. Gauthier, G. Pagot and V. Di Noto, J. Power Sources, 2020, 478, 229027 CrossRef CAS.
- J. Bitenc, A. Ponrouch, R. Dominko, P. Johansson and M. R. Palacin, in Encyclopedia of Electrochemistry, ed. A. J. Bard, M. Stratmann, E. Gileadi, M. Urbakh, E. J. Calvo, P. R. Unwin, G. S. Frankel, D. Macdonald, S. Licht, H. J. Sch¿fer, G. S. Wilson, I. Rubinstein, M. Fujihira, P. Schmuki, F. Scholz, C. J. Pickett and J. F. Rusling, Wiley, 1st edn, 2020, pp. 1–36 Search PubMed.
- A. Mauger, C. M. Julien, A. Paolella, M. Armand and K. Zaghib, Mater. Sci. Eng., R, 2018, 134, 1–21 CrossRef.
- F. Liu, T. Wang, X. Liu and L.-Z. Fan, Adv. Energy Mater., 2021, 11, 2000787 CrossRef CAS.
- M. Shi, T. Li, H. Shang, D. Zhang, H. Qi, T. Huang, Z. Xie, J. Qi, F. Wei, Q. Meng, B. Xiao, Q. Yin, Y. Li, D. Zhao, X. Xue and Y. Sui, J. Energy Storage, 2023, 68, 107765 CrossRef.
- R. Xu, X. Gao, Y. Chen, C. Peng, Z. Zhang, C. Wang, H. Sun, X. Chen and L. Cui, Mater. Today Phys., 2023, 36, 101186 CrossRef CAS.
- J. A. Blázquez, R. R. Maça, O. Leonet, E. Azaceta, A. Mukherjee, Z. Zhao-Karger, Z. Li, A. Kovalevsky, A. Fernández-Barquín, A. R. Mainar, P. Jankowski, L. Rademacher, S. Dey, S. E. Dutton, C. P. Grey, J. Drews, J. Häcker, T. Danner, A. Latz, D. Sotta, M. R. Palacin, J.-F. Martin, J. M. G. Lastra, M. Fichtner, S. Kundu, A. Kraytsberg, Y. Ein-Eli, M. Noked and D. Aurbach, Energy Environ. Sci., 2023, 16, 1964–1981 RSC.
- M. K. Naseem, M. Azmat, C. Du, R. Jiang, Y. Hajra, M. Zou Zhu and C. Cao, J. Mater. Chem. A, 2023, 11, 24878–24889 RSC.
- M. Kotobuki, B. Yan and L. Lu, Energy Storage Mater., 2023, 54, 227–253 CrossRef.
- M. R. Palacin, P. Johansson, R. Dominko, B. Dlugatch, D. Aurbach, Z. Li, M. Fichtner, O. Lužanin, J. Bitenc, Z. Wei, C. Glaser, J. Janek, A. Fernández-Barquín, A. R. Mainar, O. Leonet, I. Urdampilleta, J. A. Blázquez, D. S. Tchitchekova, A. Ponrouch, P. Canepa, G. S. Gautam, R. S. R. G. Casilda, C. S. Martinez-Cisneros, N. U. Torres, A. Varez, J.-Y. Sanchez, K. V. Kravchyk, M. V. Kovalenko, A. A. Teck, H. Shiel, I. E. L. Stephens, M. P. Ryan, E. Zemlyanushin, S. Dsoke, R. Grieco, N. Patil, R. Marcilla, X. Gao, C. J. Carmalt, G. He and M.-M. Titirici, J. Phys. Energy, 2024, 6, 031501 CrossRef.
- M. Rashad, M. Asif, Y. Wang, Z. He and I. Ahmed, Energy Storage Mater., 2020, 25, 342–375 CrossRef.
- Z. Meng, Z. Li, L. Wang, T. Diemant, D. Bosubabu, Y. Tang, R. Berthelot, Z. Zhao-Karger and M. Fichtner, ACS Appl. Mater. Interfaces, 2021, 13, 37044–37051 CrossRef CAS PubMed.
- Z. Zhao-Karger, M. E. Gil Bardaji, O. Fuhr and M. Fichtner, J. Mater. Chem. A, 2017, 5, 10815–10820 RSC.
- T. Pavčnik, M. Lozinšek, K. Pirnat, A. Vizintin, T. Mandai, D. Aurbach, R. Dominko and J. Bitenc, ACS Appl. Mater. Interfaces, 2022, 14, 26766–26774 CrossRef PubMed.
- A. Schmidt, H. Koger, A. Barthélemy, G. Studer, B. Esser and I. Krossing, Batteries Supercaps, 2022, 5, e202200340 CrossRef CAS.
- L. C. Merrill and J. L. Schaefer, Langmuir, 2017, 33, 9426–9433 CrossRef CAS PubMed.
- J. Luo, Y. Bi, L. Zhang, X. Zhang and T. L. Liu, Angew. Chem., Int. Ed., 2019, 58, 6967–6971 CrossRef CAS PubMed.
- B. Dlugatch, M. Mohankumar, R. Attias, B. M. Krishna, Y. Elias, Y. Gofer, D. Zitoun and D. Aurbach, ACS Appl. Mater. Interfaces, 2021, 13, 54894–54905 CrossRef CAS PubMed.
- T. Mandai, Y. Youn and Y. Tateyama, Mater. Adv., 2021, 2, 6283–6296 RSC.
- R. Davidson, A. Verma, D. Santos, F. Hao, C. D. Fincher, D. Zhao, V. Attari, P. Schofield, J. Van Buskirk, A. Fraticelli-Cartagena, T. E. G. Alivio, R. Arroyave, K. Xie, M. Pharr, P. P. Mukherjee and S. Banerjee, Mater. Horiz., 2020, 7, 843–854 RSC.
- R. Davidson, A. Verma, D. Santos, F. Hao, C. Fincher, S. Xiang, J. Van Buskirk, K. Xie, M. Pharr, P. P. Mukherjee and S. Banerjee, ACS Energy Lett., 2019, 4, 375–376 CrossRef CAS.
- O. B. Chae, J. Kim and B. L. Lucht, J. Power Sources, 2022, 532, 231338 CrossRef CAS.
- A. Hagopian, M.-L. Doublet and J.-S. Filhol, Energy Environ. Sci., 2020, 13, 5186–5197 RSC.
- P. Bai, J. Li, F. R. Brushett and M. Z. Bazant, Energy Environ. Sci., 2016, 9, 3221–3229 RSC.
- P. Bai, J. Guo, M. Wang, A. Kushima, L. Su, J. Li, F. R. Brushett and M. Z. Bazant, Joule, 2018, 2, 2434–2449 CrossRef CAS.
- J. J. De Yoreo, Rev. Mineral. Geochem., 2003, 54, 57–93 CrossRef CAS.
- M. V. Mirkin and A. P. Nilov, J. Electroanal. Chem. Interfacial Electrochem., 1990, 283, 35–51 CrossRef CAS.
- H. J. Chang, A. J. Ilott, N. M. Trease, M. Mohammadi, A. Jerschow and C. P. Grey, J. Am. Chem. Soc., 2015, 137, 15209–15216 CrossRef CAS PubMed.
- J. Eaves-Rathert, K. Moyer, M. Zohair and C. L. Pint, Joule, 2020, 4, 1324–1336 CrossRef CAS.
- M. Rosso, T. Gobron, C. Brissot, J.-N. Chazalviel and S. Lascaud, J. Power Sources, 2001, 97–98, 804–806 CrossRef CAS.
- A. J. Bard and L. R. Faulkner, Electrochemical methods: fundamentals and applications, Wiley, New York, Weinheim, 2nd edn, 2001 Search PubMed.
- Z. Zhao-Karger, X. Zhao, O. Fuhr and M. Fichtner, RSC Adv., 2013, 3, 16330 RSC.
- Z. Zhao-Karger, R. Liu, W. Dai, Z. Li, T. Diemant, B. P. Vinayan, C. Bonatto Minella, X. Yu, A. Manthiram, R. J. Behm, M. Ruben and M. Fichtner, ACS Energy Lett., 2018, 3, 2005–2013 CrossRef CAS.
- N. Brandt, L. Griem, C. Herrmann, E. Schoof, G. Tosato, Y. Zhao, P. Zschumme and M. Selzer, Data Sci. J., 2021, 20, 8 CrossRef.
- CERN, European Organization for Nuclear Research & OpenAIRE, Zenodo, 2013, DOI:10.25495/7GXK-RD71.
- M. Sotoudeh and A. Groß, J. Phys. Chem. Lett., 2022, 13, 10092–10100 CrossRef CAS PubMed.
- J. Shi, J. Zhang, J. Guo and J. Lu, Nanoscale Horiz., 2020, 5, 1467–1475 RSC.
- J.-H. Cheng, A. A. Assegie, C.-J. Huang, M.-H. Lin, A. M. Tripathi, C.-C. Wang, M.-T. Tang, Y.-F. Song, W.-N. Su and B. J. Hwang, J. Phys. Chem. C, 2017, 121, 7761–7766 CrossRef CAS.
- J. Drews, P. Jankowski, J. Häcker, Z. Li, T. Danner, J. M. García Lastra, T. Vegge, N. Wagner, K. A. Friedrich, Z. Zhao-Karger, M. Fichtner and A. Latz, ChemSusChem, 2021, 14, 4820–4835 CrossRef CAS PubMed.
- A. Roy, V. Bhagavathi Parambath, T. Diemant, G. Neusser, C. Kranz, R. J. Behm, Z. Li, Z. Zhao-Karger and M. Fichtner, Batteries Supercaps, 2022, 5, e202100305 CrossRef CAS.
- Z. Li, T. Diemant, Z. Meng, Y. Xiu, A. Reupert, L. Wang, M. Fichtner and Z. Zhao-Karger, ACS Appl. Mater. Interfaces, 2021, 13, 33123–33132 CrossRef CAS PubMed.
Footnotes |
| † Electronic supplementary information (ESI) available: Additional figures and information. Resource data including data treatment was made publicly available following the FAIR principle in accordance with the DFG guidelines at Zenodo. See DOI: https://doi.org/10.1039/d4lf00124a & https://doi.org/10.5281/zenodo.10890167 |
| ‡ These authors contributed equally: Leon Leuppert, Adam Reupert. |
| This journal is © The Royal Society of Chemistry 2024 |

