Multiple signal amplification strategy using porous materials and novel controlled release self-on mode for ultrasensitive immunoassay†
Lu
Zhao
a,
Xuejing
Liu
a,
Xiang
Ren
 a,
Zhongfeng
Gao
 a,
Hongmin
Ma
 a,
Dan
Wu
 *a,
Qin
Wei
 a and
Huangxian
Ju
 ab
ab
aSchool of Chemistry and Chemical Engineering, University of Jinan, Jinan 250022, P. R. China. E-mail: wudan791108@163.com
bState Key Laboratory of Analytical Chemistry for Life Science, School of Chemistry and Chemical Engineering, Nanjing University, Nanjing 210023, P. R. China
First published on 1st February 2024
Abstract
Sensitivity and accuracy are key indicators for analysis, while the signal self-on/off effect is an effective means to enhance detection sensitivity. Herein, we have utilized the multiple signal amplification strategy of porous Ag/Au shell with high efficiency catalytic functionality and an aggregation-caused quenching (ACQ) elimination effect firstly. The wrapping of the Ag/Au shell eliminated the ACQ effect of rubrene (Rub), and Ag can catalyze the decomposition of the coreactant K2S2O8 and lead to the formation of more SO4˙− radicals, thereby improving its electrochemiluminescence (ECL) efficiency, which promoted the application of aromatic rings as luminescence probes. Secondly, a mesoporous Fe–MOF with strong catalytic activity for the coreactants (K2S2O8) was selected as a controlled release carrier to further improve the output signals of the sensor. Thirdly, the coreactants were encapsulated as functional factors, realizing controllable changes in output signals from scratch with the introduction of targets. These strategies maximize the self-on effect to more clearly display subtle changes in the concentration of the analyte, prostate-specific antigen (PSA). On this basis, the developed ECL sensor exhibited good sensitivity and accuracy for PSA detection, with a detection limit of 5.01 fg mL−1, which provided an important basis for constructing efficient biosensors to better meet immunoassay needs.
Introduction
In terms of men's health, prostate cancer is a primary danger with the highest incidence among male malignant tumors. Prostate-specific antigen (PSA) is a single-chain glycoprotein secreted by the prostate gland, and it can be used as a specific indicator to diagnose prostate cancer clinically.1–5 Among the methods to monitor PSA levels, electrochemiluminescence (ECL) immunoassay has the advantages of low background, wide dynamic ranges and simple operation.6–8 These merits make ECL technology suitable for sensitive and accurate PSA detection. The construction of an ECL sensor combined with a controlled release strategy is a promising method to improve the sensitivity and accuracy of detection. By stimulating the controlled release carrier to release the functional components, the ECL sensor can be equipped with self-off or self-on mode, which can more sensitively and precisely pick up tiny changes in the concentration of the detected substance, and better meet the needs of clinical diagnosis.9–11In most of the reported literature, the introduction of a co-reactant can produce active radicals to react with the luminophore. The effective use of catalysts can produce more coreactant radicals, thus achieving ECL signal amplification. Therefore, the use of efficient luminophores and catalysts is an effective means of enhancing ECL performance. Porous structures have unique physicochemical properties, high porosity, large specific surface area and tunable pore size, and thus have attracted enormous attention in catalysis, energy and related fields.12–14 It is worth noting that it is possible to increase the ECL efficiency and sensitivity by using luminophore and catalyst with porous structure. Luminophores with porous structure have increased adsorption sites, enabling the ECL sensor to load more biological macromolecules and react with more coreactant radicals. Additionally, catalysts with a porous structure have large active specific surface areas and sufficient diffusion channels to endow them with high conductivity and agglomeration resistance, thus producing more coreactant radicals.
Based on their merits of high quantum efficiency and stable radical ions in aprotic solvents, polycyclic aromatic hydrocarbons (PAHs) are considered to be feasible ECL luminophores.15,16 However, the luminescence capacity of PAHs is limited due to their aggregation-caused quenching (ACQ) resulted from strong π–π interactions between the aromatic rings.15,16 According to the reported literature, wrapping PAHs with the metal Ag can effectively solve this problem, because Ag nanoparticles can reduce the ACQ, and the luminescence of the PAHs can be enhanced by the core–shell structure.17 In this work, we synthesized an Ag/Au porous cube cage to wrap rubrene (Rub) and form a core–shell structure to achieve strong ECL. The porous characteristic further boosted the ability of the Ag/Au nanocube cage to enhance the ECL performance of Rub. Additionally, Ag can catalyze the decomposition of the coreactant K2S2O8 and lead to the formation of more SO4˙− radicals,18 improving the ECL intensity and efficiency. Further, Fe–MOF was introduced as a catalyst to stimulate the production of more SO4˙− radicals. The valence transformation between Fe(II/III) is remarkably effective in K2S2O8 activation compared with other metal catalysts (such as Co2+, Ni2+, Ce3+),19 and its unique properties of well-defined porosity, good conductivity, high surface area and active sites endow Fe–MOF with ideal potential as a catalyst.20 Therefore, the use of Fe–MOF can increase the performance of the constructed ECL sensor.
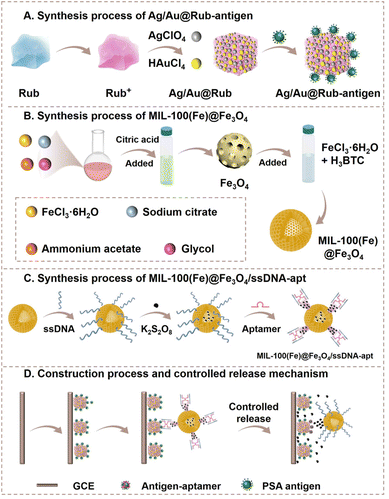
In this work, an ultrasensitive porous controlled release ECL (CRE) aptasensor was constructed using Rub wrapped in an Ag/Au porous nanocube cage (Ag/Au@Rub porous nanocube core–shell, Ag/Au@Rub PNCCS) as the luminophore, and a MIL-100(Fe)@Fe3O4 core–shell as the catalyst and controlled release carrier to detect trace PSA. In this controlled release strategy, the K2S2O8 coreactant was encapsulated in MIL-100(Fe)@Fe3O4, and the ssDNA-PSA aptamer was used as a clamp-like molecular gate to block the holes of MIL-100(Fe)@Fe3O4 by the base sequence pairing between them. Due to the stronger specific binding ability between the PSA antigen and aptamer, the molecular gate collapsed, resulting in the release of K2S2O8 to generate the ECL signal. Powered by the strong catalysis of Ag+ and Fe2+ for K2S2O8 decomposition, the ECL signal was greatly enhanced. Based on these strategies, a low limit of detection (LOD) of 5.01 fg mL−1 for PSA was calculated, which demonstrated the outstanding accuracy and precision of the constructed CRE aptasensor, providing a promising method for constructing efficient ECL sensors to better meet the needs of clinical diagnosis.
Experimental section
Synthesis of Ag@Au porous nanocube shell
90 μL of 1% HAuCl4·4H2O solution was added to 20 mL of ultrapure water, and then 340 μL of 6 mM AgNO3 solution and 1 mL of 100 mM L-ascorbic acid solution were successively added to the prepared HAuCl4·4H2O solution with constant stirring. After 10 min of stirring, the products were obtained through centrifugation (2500 rpm, 20 min), and then the obtained Ag@Au porous nanocube shell was stored in a 5 mL CH3CN solution.Synthesis of Ag/Au@Rub PNCCS
10 mg of Rub was dissolved into 3 mL of CH2Cl2 with constant stirring, and then 200 μL of 19.5 mg mL−1 AgClO4 solution (in CH3CN) and 240 μL of 10 mg mL−1 I2 solution (in CH2Cl2) were successively added to the Rub solution with constant stirring. After 20 min of stirring, the Rub+ powder was obtained through centrifugation and drying and then stored in a 2 mL CH3CN solution in the dark. Finally, 8 mL of the prepared Ag@Au porous nanocube shell solution was added dropwise to 1 mL of the prepared Rub+ solution with constant stirring. After 30 min of stirring, the olive-green product Ag/Au@Rub PNCCS was obtained.Synthesis of Fe3O4 NPs
10 mmol of FeCl3·6H2O, 3 mmol of sodium citrate, 100 mmol of ammonium acetate and 140 mL glycol were mixed and heated at 170 °C for 1 h. Then, the formed dark-brown solution was transferred to a Teflon-lined stainless-steel autoclave and heated at 200 °C in an oven for 16 h. The blank solid was obtained by magnetic separation, washed with ethanol and dried at 60 °C. Next, 1.0 g of the obtained powder was dispersed in 50 mL ultrapure water. The dispersed solution was ultrasonicated for 20 min and then heated to 90 °C. 4.5 mL of 2.0 M citric acid solution was added, and the mixture was heated for a further 1.5 h. The Fe3O4 NPs was obtained by magnetic separation and washed with ethanol and dried at 60 °C.Preparation of the MIL-100(Fe)@Fe3O4 core–shell
50 mg of the obtained Fe3O4 NPs and 20 mL of 10 mmol L−1 FeCl3·6H2O and H3BTC solutions (in ethanol) were mixed and sonicated. The solution was then heated at 70 °C for 48 h. The MIL-100(Fe)@Fe3O4 core–shell was obtained by magnetic separation, washed with ethanol and dried at 60 °C.Preparation of MIL-100(Fe)@Fe3O4/ssDNA-apt and encapsulation of the coreactant K2S2O8
First, 50 μL of 200 μM carboxyl-modified anchor-DNA solution was mixed with 50 μL of 20 mg mL−1 EDC, 50 μL of 20 mg mL−1 NHS and 450 μL of 0.1 M PBS solution (pH = 7.4). The mixture was incubated at 4 °C for 15 min. Next, 50 μL of 1.0 mg mL−1 MIL-100(Fe)@Fe3O4 core–shell was added to the mixture and shocked at 4 °C for 12 h. Uncombined biomolecules were removed from the prepared MIL-100(Fe)@Fe3O4/ssDNA by centrifugation and washing with H2O three times. Next, the MIL-100(Fe)@Fe3O4/ssDNA was dispersed in 1 mL of 100 mM K2S2O8 solution (0.1 M PBS solution, pH = 7.4) and shocked at 4 °C overnight. Finally, 50 μL of 200 μM PSA aptamer solution was mixed to block the pores of MIL-100(Fe)@Fe3O4 core–shell at 4 °C for 8 h. The final MIL-100(Fe)@Fe3O4/ssDNA-apt was stored at 4 °C.Construction process of the porous CRE aptasensor
The construction of the porous CRE aptasensor is shown in Scheme 1. 8 μL of Ag/Au@Rub-antigen solution and 6 μL MIL-100(Fe)@Fe3O4/ssDNA-apt solution were modified onto the polished GCE surface in sequence. The GCE was dried at 4 °C and washed with water to remove the unbonded components.ECL detection of PSA
The ECL behavior was monitored over a scan range of −1.8∼0 V in pH = 7.4 PBS. The photomultiplier tube voltage was 700 V.Results and discussion
Characterization of Ag/Au@Rub PNCCS
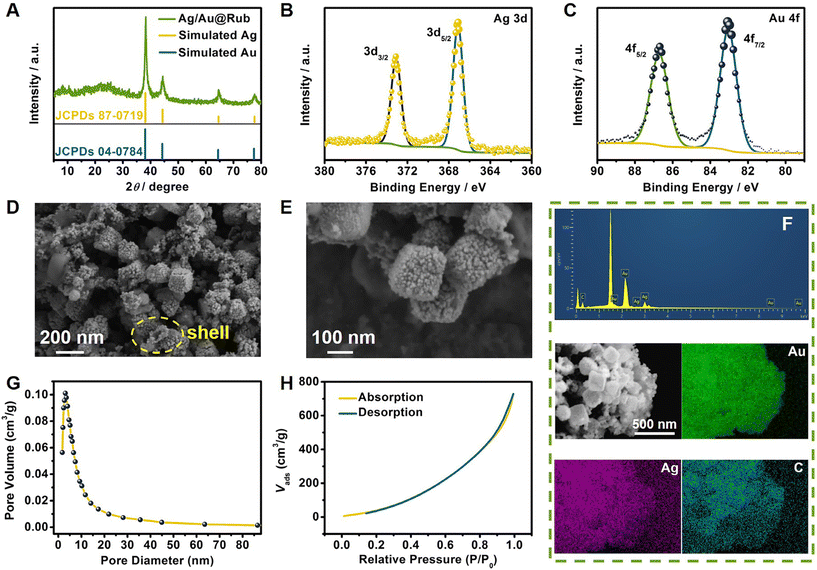
Fig. 1A shows the X-ray diffraction (XRD) patterns of the Ag/Au@Rub PNCCS. The four major peaks at 38.3°, 44.4°, 64.7° and 77.7° were in good agreement with the simulated peaks of cubic Ag and Au, which matched with the (111), (200), (220) and (311) crystallographic planes. As shown in Fig. S1,† the total surface elemental composition and chemical valence states of the Ag/Au@Rub PNCCS were tested using the X-ray photoelectron spectroscopy (XPS) technique. In Fig. 1B–C, the high-resolution Ag 3d spectrum can be deconvoluted into two strong peaks at 367.1 and 373.1 eV, corresponding to Ag 3d5/2 and Ag 3d3/2, respectively.21,22 The Au 4f spectrum exhibited two strong peaks at 83.0 and 86.7 eV, corresponding to Au 4f7/2 and Au 4f5/2, respectively.23 These indicated the production of the Ag/Au shell-wrapped rubrene. The scanning electron microscope (SEM) images in Fig. 1D–E indicated that the as-synthesized Ag/Au@Rub had a uniform porous nanocube core–shell morphology with an average diameter of 167 nm, and the thickness of the Ag/Au shell is observed to be about 17 nm from the broken porous cube (marked by the yellow dotted circle). According to the energy-dispersive spectrometry (EDS) images, the main elements Ag, Au and C were evenly distributed in the Ag/Au@Rub PNCCS (Fig. 1F). In addition, the porous structure was clearly observed, and the Brunauer–Emmett–Teller (BET) results showed a pore diameter of 3.03 nm in Ag/Au@Rub PNCCS (Fig. 1G). In Fig. 1H, the N2 adsorption–desorption isotherm was assigned as a type-III isotherm, which signified that the Ag/Au@Rub PNCCS possessed macroporosity. In addition, the BET surface area was 496.10 m2 g−1, and the pore volume was 1.13 cm3 g−1. These indicated high activity and adsorption sites in Ag/Au@Rub PNCCS.Characterization of MIL-100(Fe)@Fe3O4
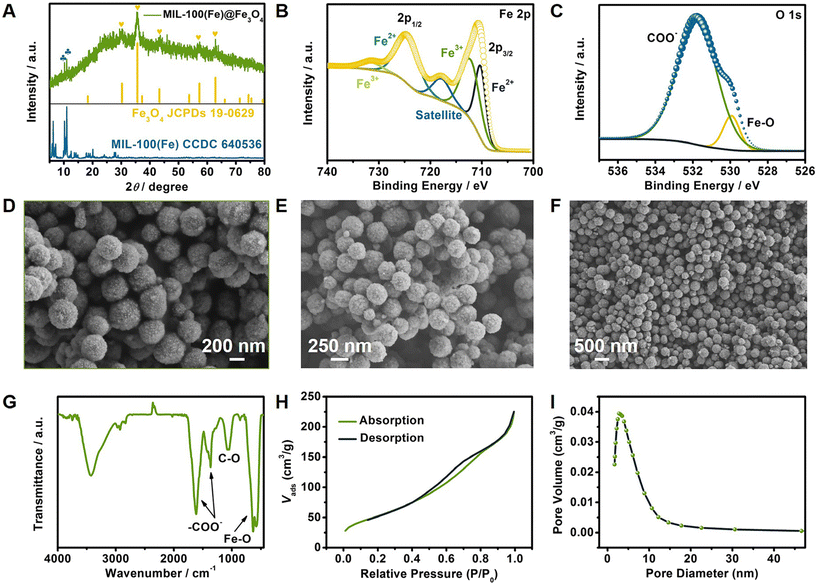
The XRD pattern of MIL-100(Fe)@Fe3O4 showed diffraction peaks at 30.1°, 35.4°, 43.1°, 56.9° and 62.5° (Fig. 2A), which represented the crystal faces at (220), (311), (400), (511) and (440) of Fe3O4, respectively (JCPDS, no. 19-0629). The weak peaks appearing at 10.2° and 11.0° corresponded to the (822) and (842) planes of MIL-100(Fe), and were consistent with the standard data CCDC 640536. The XPS survey scan spectrum of MIL-100(Fe)@Fe3O4 is shown in Fig. S2.† Two predominant Fe 2p peaks were revealed, along with a low intensity shake-up satellite peak at 718.1 eV (Fig. 2B). The fitted peaks at 710.5 eV and 712.5 eV corresponded to Fe2+ and Fe3+ of Fe 2p3/2, respectively. The Fe 2p1/2 peaks at 724.9 eV and 731.7 eV indicated the coexistence of the Fe2+ and Fe3+ in MIL-100(Fe)@Fe3O4, respectively. Fig. 2C shows that the binding energies at 530.1 eV and 532.0 eV were ascribed to Fe–O bonds and the COO− group.24,25 These observations demonstrated the formation of MIL-100(Fe)@Fe3O4. Typical SEM micrographs of the obtained product are shown in Fig. 2D–F. As shown in Fig. 2D, the bare Fe3O4 spheres have a relatively rough surface with a uniform diameter of about 260 nm. It can be seen that the MIL-100(Fe)@Fe3O4 sample displayed a uniform porous spherical morphology, and that the average diameter is about 300 nm (Fig. 2E). Furthermore, some broken porous spheres of MIL-100(Fe)@Fe3O4 in Fig. 2F illustrated a core–shell structure with a thickness of 40 nm for the shell layer. The EDS and mapping results display the uniform distributions of the elements Fe and O on MIL-100(Fe)@Fe3O4 (Fig. S3†). The Fourier transform infrared (FT-IR) spectra in Fig. 2G exhibit asymmetric and symmetric vibration peaks of –COO− at 1620 and 1375 cm−1, C–O stretching of the COO− group at 1065 cm−1, and the Fe–O lattice mode of Fe3O4 at 580 cm−1, which verified the co-existence of Fe3O4 and MIL-100(Fe).26,27 A type-IV isotherm was observed from the N2 adsorption–desorption isotherm (Fig. 2H), which illustrated the mesoporosity of the as-synthesized MIL-100(Fe)@Fe3O4 with a small pore diameter of 2.77 nm (Fig. 2I). In addition, the BET surface area was 198.45 m2 g−1, and the pore volume was 0.35 cm3 g−1. These results proved that the MIL-100(Fe)@Fe3O4 can meet the needs of a controlled release carrier.Exploration of the mechanism of enhancement of the ECL signal by the porous characteristics of Ag/Au@Rub PNCCS and MIL-100(Fe)@Fe3O4
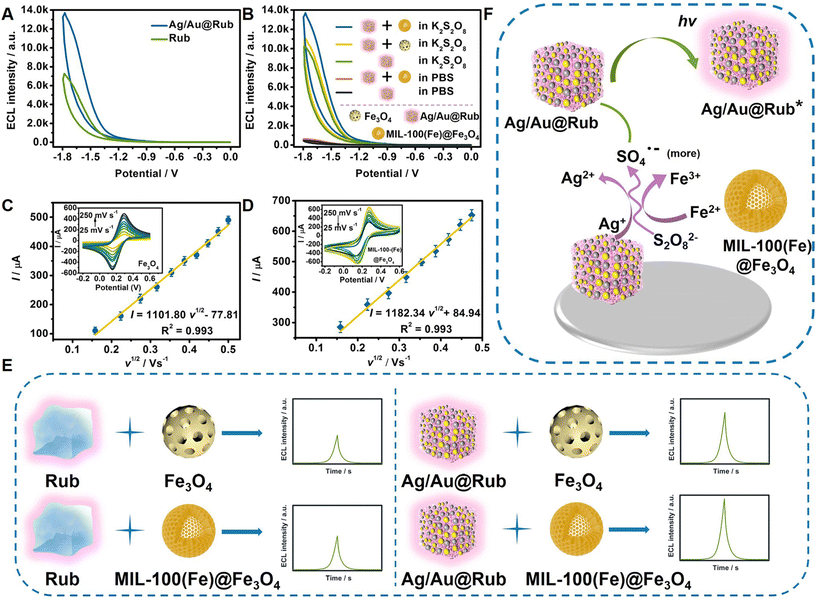
As shown in Fig. 3A, the ECL signal of the luminophore Rub was improved, which indicated that the Au/Ag porous cubic shell effectively increased the contact sites between the encapsulated Rub and the coreactant K2S2O8. In terms of the catalyst, the porous MIL-100(Fe) was used as a shell to wrap Fe3O4 porous spheres. Compared with the catalyst Fe3O4, the MIL-100(Fe)@Fe3O4 composite had greater electrochemical specific surface area (ECSA) and active sites, which made the catalytic activity for the generation of SO4˙− stronger, thus magnifying the ECL signals (Fig. 3B). By comparing the ECL signals with and without the catalysis of MIL-100(Fe)@Fe3O4 in K2S2O8 and bare PBS solutions, respectively, the mechanism of action for MIL-100(Fe)@Fe3O4 was explored. As shown in Fig. 3B, the ECL signals in bare PBS presented low values, both with and without MIL-100(Fe)@Fe3O4. When ECL measurements were conducted in K2S2O8 solution, the ECL signal improved under the catalysis of MIL-100(Fe)@Fe3O4, illustrating that the catalyst MIL-100(Fe)@Fe3O4 acted on K2S2O8 rather than Ag/Au@Rub.Cyclic voltammetry (CV) measurements were conducted to verify the accelerated electron transfer of the MIL-100(Fe)@Fe3O4 composite through the increased oxidation peak current. In addition, combined with the slopes of the linear equation (I vs. v1/2) and Randles–Sovcik equation (Fig. 3C–D), the values of ECSA were calculated. The Randles–Sovcik equation is as follows:28
| I = 2.69 × 10⁵AD1/2n3/2v1/2c |
Possible ECL mechanisms of the constructed CRE aptasensor
According to the reported literature,18 Ag(I/II) and Fe(II/III) are superior to other metal catalysts (such as Cu2+, Co2+, Ni2+) for K2S2O8 activation. Based on this, we speculated that MIL-100(Fe)@Fe3O4 and Ag/Au@Rub could catalyze K2S2O8 to generate more SO4˙−, and then the exited state of Ag/Au@Rub (Ag/Au@Rub*) realized ECL accompanied by SO4˙−. The feasible ECL mechanism is displayed in Fig. 3F and formulas (1)–(6):18,29Path 1
| S2O82− + e− → SO42− + SO4˙ | (1) |
Path 2
| Ag+ + S2O82− → Ag2+ + SO42− + SO4˙− (more) | (2) |
| Fe2+ + S2O82− → Fe3+ + SO42− + SO4˙− (more) | (3) |
Path 3
| Ag/Au@Rub + e− → Ag/Au@Rub˙− | (4) |
| Ag/Au@Rub˙− + SO4˙− → Ag/Au@Rub* + SO42− | (5) |
| Ag/Au@Rub* → Ag/Au@Rub + hv | (6) |
Performance analysis of the constructed CRE aptasensor
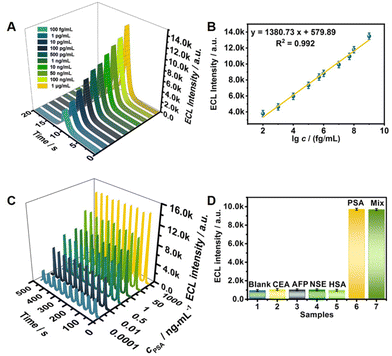
To evaluate the performance of the constructed CRE aptasensors in PSA detection, it was first necessary to ensure successful layer-by-layer modification of the CRE aptasensor (Fig. S5†) and optimize various detection parameters (Fig. S6†). Afterwards, the constructed CRE aptasensor was used to detect PSA samples with concentration gradients under the optimized conditions. When the PSA antigen specifically bound to the aptamer, this strong binding caused the aptamer to fall from the MIL-100(Fe)@Fe3O4 surface, releasing the coreactant K2S2O8 and realizing ECL. From this, it can be seen that the higher the PSA antigen concentration, the greater the amount of released aptamer, resulting in more SO4˙− reacting with Ag/Au@Rub˙−, and thus a higher ECL signal. The working curve between the obtained ECL signals and PSA concentrations was plotted (Fig. 4A), from which it can be seen that the ECL signals increase linearly with increasing PSA concentration. The derived linear equation was I = 1380.73 lg![[thin space (1/6-em)]](https://www.rsc.org/images/entities/char_2009.gif) c + 579.89 (R2 = 0.992) (Fig. 4B). This strong linear correlation illustrated the high probability for the quantitative determination of PSA using the CRE aptasensor. The calculated LOD was 5.01 fg mL−1, which is lower than those of most published detection methods for PSA (Table S1†).
c + 579.89 (R2 = 0.992) (Fig. 4B). This strong linear correlation illustrated the high probability for the quantitative determination of PSA using the CRE aptasensor. The calculated LOD was 5.01 fg mL−1, which is lower than those of most published detection methods for PSA (Table S1†).
The reproducibility of the CRE aptasensor for PSA was estimated with interassay precision by seven identical constructed aptasensors. The interassay coefficient obtained from 1 μg mL−1 PSA was 1.8%. Based on the good reproducibility data of other biosensors analyzing cancer biomarkers,30,31 the constructed CRE aptasensor had good reproducibility (Fig. S7†). As shown in Fig. 4C, the signals can be maintained at a stable level, exhibiting the good stability of the constructed CRE aptasensor. The selectivity was also explored in a blank sample, and in the presence of probable interferents (100 ng mL−1) in human serum, such as carcinoembryonic antigen (CEA), alpha fetoprotein (AFP), neuron-specific enolase (NSE), and human serum albumin (HSA). The results in Fig. 4D showed that the ECL signals with and without interferents were different. However, the ECL signals in bare PSA sample and mixture (10 ng mL−1 PSA + 100 ng mL−1 interferents) had minor differences. These results embody the excellent selectivity of the constructed CRE aptasensor.
The amount of PSA in the real samples and the recovery of the standard PSA solution were detected in order to explore the reliability of the constructed CRE aptasensor. Prior to measurement, the samples were centrifuged to obtain the supernatant (9000 rpm, 2 times). Then, the PSA in three clinical serum samples was tested three times to acquire the original concentrations. The recovery rates and relative standard deviation (RSD) were calculated through a standard addition method.32,33 The recovery experiments were repeated five times. Finally, the calculated recovery rate ranged from 97.5% to 103%, and the RSD values fell within 1.5–8.6% (Table S2†), which demonstrated the excellent accuracy and precision of the constructed CRE aptasensor, which can meet the needs of precise clinical diagnosis for prostatic cancer.
Conclusions
In this work, an ultrasensitive CRE aptasensor with a strong self-on effect was constructed to realize trace detection of PSA. The porous catalyst (MIL-100(Fe)@Fe3O4) can produce more coreactant radicals due to its high conductivity and agglomeration resistance. The porous Ag/Au@Rub enabled the CRE aptasensor to load more biological macromolecules and react with more coreactant radicals. Furthermore, the strong catalytic activity of Ag(I/II) in Ag/Au@Rub and Fe(II/III) in MIL-100(Fe)@Fe3O4 can also produce more coreactant radicals to improve the signal, this approach represents a multiple signal amplification strategy. Combined with the encapsulation of the coreactant K2S2O8 in the carrier, the constructed CRE aptasensor had a strong self-on effect to improve the sensitivity and reduce the false positive rate. The enhanced self-on effect was observed and verified by ECL and CV measurements. The low LOD of 5.01 fg mL−1 reflected the high sensitivity. In addition, the constructed CRE aptasensor performed well in reproducibility, selectivity and stability, which can meet the needs of sensitive clinical diagnosis of prostate cancer. These strategies will open a new opportunity for detection of other serious disease.Conflicts of interest
There are no conflicts to declare.Acknowledgements
This work was supported by the National Natural Science Foundation of China (22274063), the Young Taishan Scholars Program of Shandong Province (tsqn201909124). All of the authors express their sincere thanks.References
- H. Lilj, D. Ulmert and A. J. Vickers, Prostate-Specific Antigen and Prostate Cancer: Prediction, Detection and Monitoring, Nat. Rev. Cancer, 2008, 8, 268–278 CrossRef PubMed.
- G. Wu, R. H. Datar, K. M. Hansen, T. Thundat, R. J. Cote and A. Majumdar, Bioassay of Prostate-Specific antigen (PSA) Using Microcantilevers, Nat. Biotechnol., 2001, 19, 856–860 CrossRef CAS PubMed.
- K. Mohan, K. C. Donavan, J. A. Arter, R. M. Penner and G. A. Weiss, Sub-nanomolar Detection of Prostate-Specific Membrane Antigen in Synthetic Urine by Synergistic, Dual-Ligand Phage, J. Am. Chem. Soc., 2013, 135, 7761–7767 CrossRef CAS PubMed.
- G. N. Cai, Z. Z. Yu, R. R. Ren and D. P. Tang, Exciton-Plasmon Interaction between AuNPs/Graphene Nanohybrids and CdS Quantum Dots/TiO2 for Photoelectrochemical Aptasensing of Prostate-Specific Antigen, ACS Sens., 2018, 3, 632–639 CrossRef CAS PubMed.
- Z. C. Yu, H. X. Gong, J. H. Xu, Y. X. Li, Y. Y. Zeng, X. L. Liu and D. P. Tang, Exploiting Photoelectric Activities and Piezoelectric Properties of NaNbO3 Semiconductors for Point-of-Care Immunoass, Anal. Chem., 2022, 94, 3418–3426 CrossRef CAS PubMed.
- L. Zhao, M. Wang, X. Z. Song, X. J. Liu, H. X. Ju, H. Q. Ai, Q. Wei and D. Wu, Annihilation Luminescent Eu-MOF as a Near-infrared Electrochemiluminescence Probe for Trace Detection of Trenbolone, Chem. Eng. J., 2022, 434, 134691 CrossRef CAS.
- X. Z. Song, L. Zhao, C. N. Luo, X. Ren, L. Yang and Q. Wei, Peptide-Based Biosensor with a Luminescent Copper-Based Metal-Organic Framework as an Electrochemiluminescence Emitter for Trypsin Assay, Anal. Chem., 2021, 93, 9704–9710 CrossRef CAS PubMed.
- H. Gao, N. Zhang, Y. Li, W. Zhao, Y. W. Quan, Y. X. Cheng, H. Y. Chen and J. J. Xu, Triple Amplification of 3,4,9,10-Perylenetetracarboxylic Acid by Co2+-Based Metal-Organic Frameworks and Silver-Cysteine and Its Potential Application for Ultrasensitive Assay of Procalcitonin, Sci. China: Chem., 2020, 63, 715–721 CrossRef CAS.
- P. D. Thornton, R. J. Mart and R. V. Ulijn, Enzyme-responsive Polymer Hydrogel Particles for Controlled Release, Adv. Mater., 2007, 19, 1252–1256 CrossRef.
- N. Ma, X. Ren, H. Wang, X. Kuang, D. W. Fan, D. Wu and Q. Wei, Ultrasensitive Controlled Release Aptasensor Using Thymine-Hg2+-Thymine Mismatch as a Molecular Switch for Hg2+ Detection, Anal. Chem., 2020, 92, 14069–14075 CrossRef CAS PubMed.
- L. Zhao, X. Z. Song, D. W. Fan, X. J. Liu, H. Wang, Q. Wei and D. Wu, Highly Efficient Signal On/Off Electrochemiluminescence Gel Aptasensor Based on a Controlled Release Strategy for the Sensitive Detection of Prostate Specific Antigen, Anal. Chem., 2023, 95, 5695–5701 CrossRef CAS PubMed.
- Y. Q. Kang, Y. Tang, L. Y. Zhu, B. Jiang, X. T. Xu, O. Guselnikova, H. X. Li, T. Asahi and Y. Yamauchi, Porous Nanoarchitectures of Nonprecious Metal Borides: From Controlled Synthesis to Heterogeneous Catalyst Applications, ACS Catal., 2022, 12, 14773–14793 CrossRef CAS.
- L. Duan, C. Wang, W. Zhang, B. Ma, Y. Deng, W. Li and D. Zhao, Interfacial Assembly and Applications of Functional Mesoporous Materials, Chem. Rev., 2021, 121, 14349–14429 CrossRef CAS PubMed.
- Y. W. Hou, M. Dong, J. T. He, J. Sun, C. Y. Sun, X. Li, X. L. Wang and Z. M. Su, Oxygen vacancies confined in hierarchically porous CsPbBr3@Pb-MOF through in situ structural transformation for promoting photocatalytic CO2 reduction, Inorg. Chem. Front., 2023, 10, 5098–5110 RSC.
- J. M. Wang, L. Y. Yao, W. Huang, Y. Yang, W. B. Liang, R. Yuan and D. R. Xiao, Overcoming Aggregation-Induced Quenching by Metal−Organic Framework for Electrochemiluminescence (ECL) Enhancement: Zn-PTC as a New ECL Emitter for Ultrasensitive MicroRNAs Detection, ACS Appl. Mater. Interfaces, 2021, 13, 44079–44085 CrossRef CAS PubMed.
- J. L. Liu, Z. L. Tang, J. Q. Zhang, Y. Q. Chai, Y. Zhuo and R. Yuan, Morphology-Controlled 9,10-Diphenylanthracene Nanoblocks as Electrochemiluminescence Emitters for MicroRNA Detection with One-Step DNA Walker Amplification, Anal. Chem., 2018, 90, 5298–5305 CrossRef CAS PubMed.
- C. Wang, Y. Kuang, L. Luo and X. M. Sun, Highly controlled bifunctional Ag@rubrene core–shell nanostructures: surface-enhanced fluorescence and Raman scattering, J. Mater. Chem. C, 2013, 1, 4146–4152 RSC.
- G. P. Anipsitakis and D. D. Dionysiou, Radical generation by the interaction of transition metals with common oxidants, Environ. Sci. Technol., 2004, 38, 3705–3712 CrossRef CAS PubMed.
- X. M. Dang, M. Sun, A. Sinha, J. F. Niu and H. M. Zhao, Coupling O2 and K2S2O8 Dual Coreactant with Fe-N-C Modified Electrode for Ultrasensitive Electrochemiluminescence Signal Amplification, ChemistrySelect, 2019, 4, 1673–1680 CrossRef CAS.
- A. Bavykina, N. Kolobov, S. Khan, J. A. Bau, A. Ramirez and J. Gascon, Metal-Organic Frameworks in Heterogeneous Catalysis: Recent Progress, New Trends, and Future Perspectives, Chem. Rev., 2020, 120, 8468–8535 CrossRef CAS PubMed.
- M. S. Zhu, P. L. Chen and M. H. Liu, Ag/AgBr/Graphene Oxide Nanocomposite Synthesized via Oil/Water and Water/Oil Microemulsions: A Comparison of Sunlight Energized Plasmonic Photocatalytic Activity, Langmuir, 2012, 28, 3385–3390 CrossRef CAS PubMed.
- J. S. Lee, H. Kim and W. R. Algar, Thiol-Ligand-Catalyzed Quenching and Etching in Mixtures of Colloidal Quantum Dots and Silver Nanoparticles, J. Phys. Chem. C, 2017, 121, 28566–28575 CrossRef CAS.
- M. Jalali, R. S. Moakhar, T. Abdelfattah, E. Filine, S. S. Mahshid and S. Mahshid, Nanopattern-Assisted Direct Growth of Peony-like 3D MoS2/Au Composite for Nonenzymatic Photoelectrochemical Sensing, ACS Appl. Mater. Interfaces, 2020, 12, 7411–7422 CrossRef CAS PubMed.
- Y. M. Fu, K. Xiao, Q. Q. Zhang, X. H. Zhang, C. C. Du and J. H. Chen, Highly Selective Photoelectrochemical Assay of Arsenate Based on Magnetic Co3O4-Fe3O4 Cubes and the Negative-Background Signal Strategy, Anal. Chem., 2020, 92, 13298–13304 CrossRef PubMed.
- Y. W. Li, W. J. Zhang, J. Li, H. Y. Ma, H. M. Du, D. C. Li, S. N. Wang and J. S. Zhao, Fe-MOF-Derived Efficient ORR/OER Bifunctional Electrocatalyst for Rechargeable Zinc-Air Batteries, ACS Appl. Mater. Interfaces, 2020, 12, 44710–44719 CrossRef CAS PubMed.
- X. Chen, Y. S. Zhang, Y. H. Zhao, S. Wang, L. Z. Liu, W. Y. Xu, Z. R. Guo, S. H. Wang, Y. X. Liu and J. L. Zhang, Encapsulating Pt Nanoparticles through Transforming Fe3O4 into MIL-100(Fe) for Well-Defined Fe3O4@Pt@MIL-100(Fe) Core–shell Heterostructures with Promoting Catalytic Activity, Inorg. Chem., 2019, 58, 12433–12440 CrossRef CAS PubMed.
- Y. Y. Xu, L. F. Xu, S. D. Qi, Y. L. Dong, Z. U. Rahman, H. L. Chen and X. G. Chen, In Situ Synthesis of MIL-100(Fe) in the Capillary Column for Capillary Electrochromatographic Separation of Small Organic Molecules, Anal. Chem., 2013, 85, 11369–11375 CrossRef CAS PubMed.
- L. L. Li, K. P. Liu, G. H. Yang, C. M. Wang, J. R. Zhang and J. Zhu, Fabrication of Graphene-Quantum Dots Composites for Sensitive Electrogenerated Chemiluminescence Immunosensing, Adv. Funct. Mater., 2015, 21, 869–878 CrossRef.
- X. Zhong, S. S. Yang, N. Liao, R. Yuan and Y. Zhuo, Development of Hollow Electrochemiluminescent Nanocubes Combined with a Multisite-Anchored DNA Nanomachine for Mycotoxin Detection, Anal. Chem., 2015, 21, 869–878 Search PubMed.
- Z. L. Qiu, J. Shu, J. F. Liu and D. P. Tang, Dual-Channel Photoelectrochemical Ratiometric Aptasensor with up-Converting Nanocrystals Using Spatial-Resolved Technique on Homemade 3D Printed Device, Anal. Chem., 2019, 91, 1260–1268 CrossRef CAS PubMed.
- Z. L. Qiu, J. Shu and D. P. Tang, Bioresponsive Release System for Visual Fluorescence Detection of Carcinoembryonic Antigen from Mesoporous Silica Nanocontainers Mediated Optical Color on Quantum Dot-Enzyme-Impregnated Paper, Anal. Chem., 2017, 89, 5152–5160 CrossRef CAS PubMed.
- L. L. Liu, R. J. Zeng, Q. Y. Lin, X. Huang and D. P. Tang, Cation Exchange Reaction-Mediated Photothermal and PolaritySwitchable Photoelectrochemical Dual-Readout Biosensor, Anal. Chem., 2023, 95, 16335–16342 CrossRef PubMed.
- S. Y. Chen, Z. C. Liu, Y. S. Wang, J. Tang, Y. Y. Zeng, X. L. Liu and D. P. Tang, Block-Polymer-Restricted Sub-nanometer Pt Nanoclusters Nanozyme-Enhanced Immunoassay for Monitoring of Cardiac Troponin I, Anal. Chem., 2023, 95, 14494–14501 CrossRef CAS PubMed.
Footnote |
| † Electronic supplementary information (ESI) available: Chemicals and apparatus; electrochemical measurements (Table S1–2, Fig. S1−S6) (Word). See DOI: https://doi.org/10.1039/d4qi00011k |
| This journal is © the Partner Organisations 2024 |

