 Open Access Article
High degree of silanization of olive wood shell stone and its use in polyester biocomposites†
Melissa
Olmedo-Navarro
a,
Juana M.
Pérez
 *a,
Natalia
Gutiérrez-Segura
 a,
Bernardo
Sánchez-Sevilla
a,
Yolanda
Soriano-Jerez
b,
Diego A.
Alonso
a,
Bernardo
Sánchez-Sevilla
a,
Yolanda
Soriano-Jerez
b,
Diego A.
Alonso
 c,
Mari Carmen
Cerón
b and
Ignacio
Fernández
 *a
*a
aDepartment of Chemistry and Physics, Research Centre CIAIMBITAL, University of Almería, Ctra. Sacramento, s/n, 04120, Almería, Spain. E-mail: ifernan@ual.es
bDepartment of Chemical Engineering, University of Almería, 04120 Almería, Spain
cDepartamento de Química Orgánica, Facultad de Ciencias, Instituto de Síntesis Orgánica (ISO), Universidad de Alicante, Apdo. 99, 03080 Alicante, Spain
First published on 4th March 2024
Abstract
A full optimization of the reaction conditions for the high degree of functionalization of olive wood shell stone (OS) with silanes of different nature has been conducted. The assayed silanes were 3-aminopropyltrimethoxysilane (APTMS), γ-methacryloxypropyltrimethoxysilane (MEMO), 3-(2-aminoethylamino)propyltrimethoxysilane (AEAPTMS) and octadecyltrimethoxysilane (ODTMS) obtaining high degrees of functionalization of the initial native OS. A complete characterization of the functionalized OS materials was performed using a plethora of techniques such as Fourier transform infrared spectroscopy (FTIR-ATR and FTIR-DRIFT), ζ-potential, elemental analysis, X-ray fluorescence (XRF), thermogravimetry (TG), moisture content, and particle size distribution. The potential use of these materials was subsequently studied in the synthesis of biocomposites partially replacing the conventional inorganic filler, which due to its crystallinity is known to be not beneficial for human health. The obtained biocomposite materials were studied by means of flexural resistance, Barcol hardness, colorimetry, static contact angle, and dynamic-mechanical analysis (DMA).
Sustainability spotlightThis study represents a significant advance in sustainable material development by investigating highly functionalized native olive wood shell stone (OS) using diverse silanes. The process transforms agricultural waste into advanced biofillers, supporting the circular economy and reducing reliance on non-renewable resources. This work aligns with several UN SDGs: (i) SDG 9 by promoting innovation in materials science and advancing sustainable practices within industries; (ii) SDG 12 by utilizing agricultural waste as a resource, reducing waste generation, and promoting the circular economy; (iii) SDG 13 by potentially reducing the carbon footprint through the use of sustainable materials and minimizing reliance on non-renewable resources; and (iv) SDG 15 by repurposing agricultural residues like olive stones, thereby reducing environmental impact and preserving land resources. |
Introduction
The olive tree is one of the predominant agricultural productions in Mediterranean countries, highly relevant in their economic and social industry. Under the leadership of Spain, countries such as Italy, Greece, or Turkey are some of the main producers of olives,1 and, as a consequence, these countries are also producers of high amounts of wastewater or solid residues derived from the extraction process.2 The residual solid lignocellulosic biomass derived from native olive wood shell stones (OS) is approximately 20% of the total olive weight. This agrifood residue is mainly composed of cellulose, hemicellulose, and lignin,2 but additional organic components, called extractives2 are part of the dry material. Importantly, several metabolites comprising the extractives serve as energy reserves or offer defense against microbial attacks,3 making them an additional attribute of the obtained residue. However, due to its high lignin content, OS is mainly repurposed as a renewable energy source, predominantly as solid fuel,4 due to its low percentage of N and S that minimize SO2 and NOx that contribute to the ozone layer depletion.5 Other studies have previously been described for the application of this renewable resource, such as the synthesis of bio-oil products6 by pyrolysis,7,8 synthesis of activated carbon for the removal of contaminants,9,10 synthesis of organic compounds such as furfural11 or phenol-formaldehyde resins,12 and most importantly the substitution of plastic13–23 or inorganic fillers, minimizing negative effects on the environment24 and promoting clean technologies and recycled products that also source relevant effects on the economy.25–27 One of the advantages of OS is the potential to replace traditional inorganic fillers as reinforcement in the production of green composites due to their biodegradability, lower density, acceptable specific strength properties, ease of separation, and low economic cost. These advantages allow progress in the field of the principle of circular economy and green economy,28 which has recently impacted the field by reorienting the current strategy toward environmental awareness whose objective is to convert waste into wealth.One significant limitation of lignocellulose-based composites stems from their hydrophilic nature, leading to poor compatibility with the hydrophobic matrix.29,30 This issue arises from the high hydrophilicity of OS, attributed to its abundant hydroxyl groups. As a result, the composites experience chemical vulnerability, causing dimensional alterations and weakening interfacial adhesion.17 Over time, these properties adversely affect the overall composite material performance. To address these shortcomings, the application of specific coupling agents has been documented in the literature, aimed at mitigating these hydrophilic tendencies.29,31–33 These agents effectively obstruct these hydrophilic sites, enhancing interaction between the matrices. Silanes, renowned for their efficacy as coupling agents, find extensive use in polymer composites owing to their bifunctional groups capable of reacting with both lignocellulose fillers and the polymer matrix. This interaction forms a crucial bridge between the two components.1,34–40 This enhancement in adhesion results in the formation of a uniform composite structure, leading to significantly improved mechanical properties. The strengthened bond between the components fosters greater integrity within the material, thus enhancing its overall structural and functional capabilities.36,41
Several studies have been conducted to explore the use of this material in synthesizing composites with polyester resins. One notable example is the work by Gharbi et al., wherein they achieved a flexural modulus 2.8 times higher by incorporating 55% of silanized olive nuts flour, treated with an unspecified amount of γ-mercaptopropyltrimethoxysilane, into a composite with polyester resin.42 Additionally, the study measured the flexural strength, which increased by about 10% (with respect to the untreated filler) at a content of 30 wt%. These findings underscore the critical role of silane treatment in improving the overall mechanical performance of the resulting composites.
The aim of this study is to valorize lignocellulosic biomass residues derived from the olive industry's waste stream, giving them a new use as reinforcement biofillers in the manufacturing of composites. Building upon our recently published results,43 where exceptional polyester-based biocomposites were synthesized and comprehensively characterized, we aim to further explore the synthesis of highly functionalized OS using the ‘grafting to’ approach employing silanes of varying nature, followed by a full characterization of the final materials. By partially substituting the conventionally used inorganic fillers with these highly functionalized lignocellulosic waste materials from the olive industry, which are less dependent on petrochemical sources, we anticipate the production of more biodegradable and environmentally friendly composite materials. This substitution could lead to an enhancement in the mechanical properties of the composites, contributing to their overall sustainability and reduced environmental impact.
Results and discussion
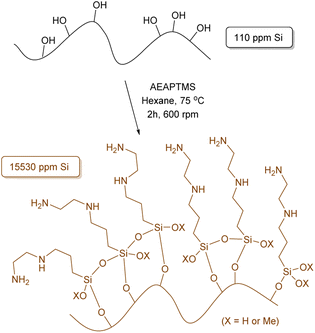
To initiate our study and building upon our previous findings,43 we have performed a comprehensive optimization process of the reaction conditions. Our aim was to maximize the amount of silane anchored onto the surface of the OS to hopefully enhance the interfacial adhesion between the polymer and matrix in the final composite.Given the diverse functional groups present in silanes, our principal focus centered on method refinement using silanes of different compositions, such as (3-aminopropyl)trimethoxysilane (APTMS) and γ-methacryloxypropyltrimethoxysilane (MEMO), where various solvents, temperatures and reaction times were tested (Tables S1 and S2†). The use of hexane and APTMS notably enhanced the efficiency of our methodology, resulting in a 7.9% increase in the anchoring of APTMS, totalling 33.6 mg g−1 of Si as determined by X-ray fluorescence (XRF) (Table S1,† entry 5). Increasing the reaction time from 2 hours to 24 or 72 hours further improved efficiency by more than 21%, yielding anchorings of 41.0 and 42.5 mg g−1 of Si, respectively. Continuing our investigation, [3-(2-aminoethylamino)propyl]trimethoxysilane (AEAPTMS) was evaluated using the optimized reaction conditions for APTMS (hexane, 2 h, 75 °C), resulting in an anchoring of 15.53 mg g−1 of Si (Scheme 1). This outcome indicates a nearly identical total nitrogen content in both materials (APTMS and AEAPTMS) when subjected to the same reaction conditions.
Next, our investigation turned to the utilization of MEMO as a silane agent. In our prior study,43 the experimental approach employing MEMO resulted in minimal functionalization of the initial OS obtaining a concentration of 0.11 mg per g Si. However, through an extensive optimization procedure where the solvent, temperature and pH were tackled (Table S2†), we achieved a remarkable increase in Si content of 13.6 mg g−1 after 2 h in water at pH 1.5 at 100 °C (entry 8, Table S2†). Similar to the observations with APTMS, extending the reaction time significantly facilitated silane attachment, resulting in 36.9 and 44.1 mg per g Si after 24 and 72 hours, respectively.
Having established the optimal conditions for MEMO, the reaction was conducted using a non-protic and hydrophobic silane such as octadecyltrimethoxysilane (ODTMS), resulting in the anchoring of 15.3 mg g−1 of Si on the surface of the initial OS after 2 hours of reaction. This promising outcome sets the stage for a more detailed examination of the interactions between the functional groups at the end of the chain in silanes anchored within our environmentally friendly and biodegradable OS matrix, particularly regarding their interaction with the polymers utilized in composite formation.
Table 1 summarizes the degree of functionalization results obtained from all silanization procedures conducted within 2 hours. As previously mentioned, the use of X-ray fluorescence (XRF) was key in quantitatively determining the Si content in all samples during the optimization process. These results were supported by subsequent elemental analysis (EA), confirming the presence of elemental nitrogen in OS@APTMS and OS@AEAPTMS, thereby validating the success of the ‘grafting to’ approach (entries 2 and 3, Table 1). Additionally, a noticeable increase of 3.1% in carbon and 1.0% in hydrogen was observed when comparing native OS with OS@ODTMS, further validating the efficacy of the developed methodology (compare entries 1 and 5, Table 1).
| Entry | Material | [Si]a,b/mg g−1 | Cc/% | Hc/% | Nc/% |
|---|---|---|---|---|---|
| a Data determined using XRF analysis. b In brackets the wt% of functionalization. c Data determined using CHNS elemental analysis. d LOD (limit of detection) established in 0.01%. | |||||
| 1 | OS | 0.11 | 47.1 | 6.1 | <LODd |
| 2 | OS@APTMS | 33.6 (21.5) | 42.7 | 6.3 | 2.5 |
| 3 | OS@AEAPTMS | 15.3 (12.4) | 44.6 | 6.5 | 3.3 |
| 4 | OS@MEMO | 13.6 (12.1) | 46.4 | 6.1 | <LODd |
| 5 | OS@ODTMS | 15.3 (20.4) | 50.2 | 7.1 | <LODd |
A field emission scanning electron microscope (FESEM) equipped with a high-definition back scattered electron detector (HDBSD) and an energy dispersive X-ray spectroscopy (EDX) module was used in our analysis. In the initial OS, the EDX mapping revealed the expected presence of carbon and oxygen as major components, along with traces of S, Si and K (Fig. S1†).44 This observation aligns with the findings described by Masłowski et al.,45 indicating that the functionalization process significantly alters the morphology of the specific biofiller, rendering it rougher and more jagged (Fig. S5†), probably due to the fracturing of cell walls and the emergence of microscopic fissures on the resulting surface. Furthermore, the presence of the corresponding silane on the particle surface was visibly apparent in all cases, resulting in a homogeneous distribution of the silane throughout the entire surface, as confirmed by EDX mapping images (Fig. 1 for OS@APTMS and Fig. S2–S4† for OS@AEAPTMS, OS@MEMO and OS@ODTMS, respectively). Notably, when aminated silanes like APTMS or AEAPTMS were analyzed through elemental mapping, the homogeneous distribution of nitrogen across the material was confirmed, similar to the distribution observed with silicon. This observation confirms that the silane structure remained intact throughout the process.
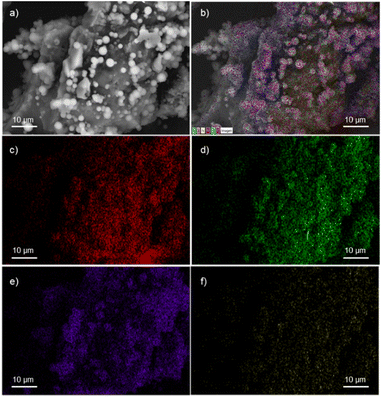 | ||
| Fig. 1 FESEM-EDX micrographs of OS@APTMS: (a) HDBSD; (b) overall mapping; (c) carbon; (d) oxygen; (e) silicon, and (f) nitrogen. | ||
The particle size distribution of all silanized biofillers was assessed (Fig. S13–S16†), and a summary is provided in Table S3.† Among the four silanized materials, only OS@MEMO maintained similar values of d50 (61.31 μm) and d90 (128.62 μm) to those of the native OS. In contrast, APTMS, AEAPTMS and ODTMS exhibited significantly larger average sizes, with d90 values of 171.01, 541.56, and 308.73 μm, respectively (Table S3†). Compared to feldspar, the reference inorganic filler, the particle sizes in all biofillers were notably larger than feldspar's d90 value of 25.55 μm. However, in terms of uniformity, OS@APTMS, OS@AEAPTMS, and OS@ODTMS closely resembled feldspar. In contrast, regarding surface area, only native OS and OS@MEMO, with values of 0.317 and 0.268 m2 g−1 respectively, were closer to the feldspar value of 1.601 m2 g−1. Silanization resulted in an increased size distribution in all the silanized materials except OS@MEMO, and it reduced the surface area in all except OS@MEMO, where the reduction was minimal (ca. 3%). Additionally, it enhanced uniformity in all except OS@MEMO, which suggests that, in terms of potential behavior, OS@MEMO is more akin to the native OS than the other silanized variants. These material disparities require consideration in assessing the mechanical properties of the resulting biocomposites (see below).
Fourier transform infrared spectroscopy provided confirmation of the respective functionalities present in the various biofillers (Fig. S17–S35†). In native OS, the wide bands observed between 3500 and 3100 cm−1 are attributed to O–H bond stretchings from the hydroxyl groups present in cellulose, hemicellulose, lignin, and surface moisture. The broadness of this band indicates the presence of hydrogen bonds. However, in the diffusive reflectance measurements (Fig. S18†), this band appeared to split into three bands with increased intensity. Upon silanization, spectral differences emerged in the material in comparison to the initial OS, suggesting covalent functionalization of the OH groups. This was further confirmed by the presence of a Si–O band at 1100 cm−1,46 along with a notable reduction in the hydroxyl bands, likely indicating a decrease in adsorbed moisture. Additionally, in all biofillers, new absorption bands within the 1800–800 cm−1 characteristic of silane groups were also evident.47 Incorporation of aminated silanes revealed bands at 1463 and 1581 cm−1 corresponding to the deformation modes,47,48 while anchoring of the aliphatic ODTMS showcased distinct peaks at 2918 and 2850 cm−1 associated with Csp3–H stretchings, along with the C–H bend or scissoring at 1465 cm−1.
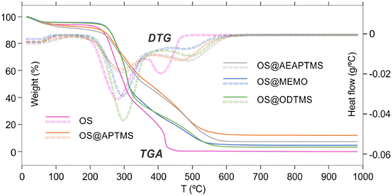
The analysis of TG and DTG curves clearly reveals three stages of thermal decomposition weight loss in both native and modified OS (Fig. 2). The initial stage of thermal decomposition, observed between 35 and 150 °C, corresponds to the release of adsorbed water and noncovalently attached organic molecules, i.e., monomeric silanes.45,48–50 Results from this stage indicate the highest weight loss in aminated OS@APTMS and OS@AEAPTMS, suggesting their coordination potential due to the nitrogen non-bonding electrons. Interestingly, despite this higher weight loss, its water content remains lower than that of native OS, implying that the silane coating is more effective in improving hydrophobicity (Table 2).
The second stage occurs between 200 and 375 °C for OS and 200–400 °C for OS@silanized, primarily attributed to the initial decomposition of hemicellulose (200–310 °C), followed by the degradation of lignin and cellulose (310–400 °C).50–54 This stage accounts for a significant mass loss. Interestingly, the functionalization of OS with aminated silanes appears to decrease the degradation rate, contrasting with the effect of ODTMS silane, where the degradation is even more pronounced than that of the native OS, resulting in a considerable mass loss. The third stage involves the final decomposition of lignin (>400 °C), which significantly differs when comparing silanized materials to the initial OS (Fig. 2).
In particular, the total degradation of OS occurs at 500 °C, while silanized materials require higher temperatures to complete this stage. This discovery is crucial, as the silane coating confers greater resistance to the material against higher temperatures, potentially beneficial for specific applications or in manufacturing processes requiring elevated temperatures for the production of desired composites. Additionally, the ash content varies considerably depending on the efficiency of the silanization process. For OS@APTMS, the ash content is 14.6%, while it is 2.8%, 9.9%, 7.2%, and 5.3% for OS, OS@AEAPTMS, OS@MEMO, and OS@ODTMS, respectively. These findings align with the amount of silane attached to the materials (Table 1). Powder X-ray diffraction (PXRD) analysis of these ashes revealed the presence of amorphous silica resulting from thermal decomposition of the grafted silanes.49
The new silanized biofillers were also studied in terms of colloidal stability. Electrophoretic mobility provides insight into the surface charge density of colloidal particles and helps in the understanding of the electrostatic forces that affect particle–particle interactions, aggregation, and dispersion within a solution. These measurements allow comparisons between the different surface coatings of the OS. Systems with high ζ-potential (−/+) are considered electrically stable, while low ζ-potential (−/+) values are usually referred to a system that tends to aggregate and further precipitate.55 In this study, measurements were always performed at a fixed conductivity of 700 μS cm−1, which is equivalent to a concentration of 7.3 mM NaCl (Fig. S36†). In these measurements only the electrical surface properties of the suspended fraction of the materials were studied, considering it as a representative portion of the entire material. The suspended fractions corresponded to 17, 17, 34, 17 and 33% for OS, OS@APTMS, OS@AEAPTMS, OS@MEMO, and OS@ODTMS, respectively, and their polydisperse particle distributions were 13.8 ± 10.9 μm, 2.6 ± 1.8 μm, 12.4 ± 7.9 μm, 8.1 ± 4.4 μm and 4.4 ± 7.3 μm, respectively. Fig. S37–S41 and Table S4† show their optical microscopy images and the particle histograms. At alkaline pH values (Fig. 3, Table S5†), all materials exhibited highly negative ζ-potential values, indicating a negative surface charge that hinders interaction with similar neighbouring particles. At pH 4, silanes containing amino groups (OS@APTMS and OS@AEAPTMS) showed a substantial increase in ζ-potential values, from −25.3 ± 0.3 to +31.3 ± 0.4 μS cm−1 and from −19.8 ± 0.4 to +31.5 ± 0.2 μS cm−1, respectively. This suggests an isoelectric point between pH 5 and 6 for APTMS and pH 7 and 8 for AEAPTMS, indicating the probable protonation of the amino moieties present in these silanes as the primary source of positive surface charge. On the other hand, those based on MEMO or ODTMS silanes exhibited significantly larger stability than OS between pH 8 and 10, but lower when the pH is below 6.
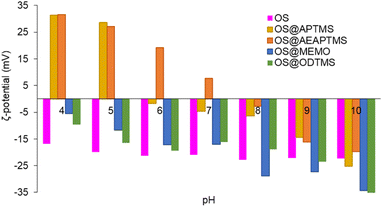 | ||
Fig. 3
ζ-Potential of native OS (pink), OS@APTMS (33![[thin space (1/6-em)]](https://www.rsc.org/images/entities/char_2009.gif) 600 ppm Si) (yellow), OS@AEAPTMS (15 600 ppm Si) (yellow), OS@AEAPTMS (15![[thin space (1/6-em)]](https://www.rsc.org/images/entities/char_2009.gif) 530 ppm Si, orange), OS@MEMO (13 530 ppm Si, orange), OS@MEMO (13![[thin space (1/6-em)]](https://www.rsc.org/images/entities/char_2009.gif) 600 ppm Si, blue), and OS@ODTMS (15 600 ppm Si, blue), and OS@ODTMS (15![[thin space (1/6-em)]](https://www.rsc.org/images/entities/char_2009.gif) 270 ppm Si, green), as a function of pH. All the measurements were performed in triplicate (Table S5†) with a constant conductivity of 700 μS cm−1. 270 ppm Si, green), as a function of pH. All the measurements were performed in triplicate (Table S5†) with a constant conductivity of 700 μS cm−1. | ||
Finally, the four silanized materials were assessed as biofillers for polyester composite fabrication, allowing for a reduction in the required loading of inorganic fillers. This approach paves the way of producing more biodegradable and eco-friendly polyester-based composites, contributing to the circular economy by using agricultural residues like olive stones, thus minimizing their environmental impact. To determine the substitutable amount of sodium feldspar with OS, viscosity measurements (in cP) were conducted for various mixtures at a constant temperature of 25 °C (Table S7†). Initially, a standard resin/feldspar mixture (50/50 %w/w) was prepared and measured, establishing a reference viscosity of 3426 cP. Subsequent blends of resin/feldspar/OS were formulated to achieve a similar viscosity, observed at a ratio of 50/42/8 %w/w (Fig. S47†). Notably, an increase in the viscosity of the mixture occurred as the OS quantity increased or when the resin amounts relative to the solid component decreased. Then, we proceeded to utilize the previously obtained OS@silanized materials in fabricating polyester-based biocomposites and assessing their mechanical properties. Employing the aforementioned method, we prepared identical OS/feldspar mixtures, achieving viscosity levels akin to those previously observed, except for OS@MEMO (Fig. 4). In the case of this biofiller, the obtained viscosity of 4706 cP was 1280 cP higher than when employing only feldspar.
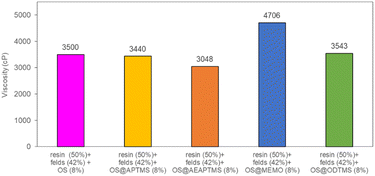 | ||
| Fig. 4 Viscosity values for the mixtures resin/feldspar/OS@silanized (50/42/8 %w/w). All the measurements were performed in triplicate (Table S7†). | ||
This remarkable disparity highlights the significant effect that silane treatment can exert on the resultant biocomposite, potentially leading to distinct mechanical properties (as detailed below). The final composites were obtained by a cobalt-catalyzed curing reaction of the styrene-dissolved unsaturated polyester resin obtaining test pieces according to ISO 178: 2019 (size 80 mm × 10 mm × 4 mm) and UNE 53270 (see Experimental section). The Barcol hardness was initially measured to determine the resistance to deformation of the different materials, always using the resin/feldspar (50/50 %w/w) as the positive control (Fig. 5, Table S7†). Compared to the control, an increase in the hardness value was noted when employing native OS (58.6 ± 1.4 B) OS@ATPMS (56.9 ± 2.0 B), and OS@MEMO (56.3 ± 2.0 B). In contrast, a reduction in Barcol hardness is evident with the use of OS@AEAPTMS (49.0 ± 3.0) and OS@ODTMS (36.0 ± 4.0 B), possibly due to the differing lengths of these silanes compared to the others. The influence of silanization on mechanical performance, specifically flexural strength and flexural modulus, was also assessed. A marginal decrease in flexural modulus (Fig. 6a), indicating a reduction in stiffness, was observed upon introducing 8% native OS. However, incorporating various OS@silanized biofillers significantly reinforced the composite, resulting in a higher flexural modulus in all cases except when using OS@ODTMS.
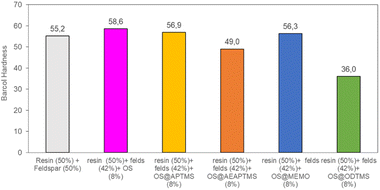 | ||
| Fig. 5 Barcol Hardness measurements for the different composites obtained. All the measurements were performed in triplicate (Table S7†) with a constant conductivity of 700 μS cm−1. | ||
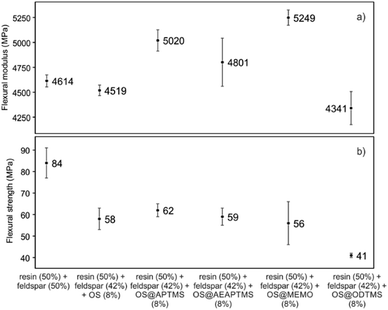 | ||
| Fig. 6 Mechanical performance in terms of (a) flexural modulus (MPa) and (b) flexural strength (MPa) for the different composites obtained. All the measurements were performed in triplicate (Table S6†). | ||
The increase in modulus is attributed to an improved level of adhesion between the biofiller and the matrix due to a better contact. Similar to the Barcol hardness, the most favorable results were obtained with OS@APTMS (5020 ± 241 MPa) and OS@MEMO (5249 ± 166 MPa), both exhibiting a lower water content compared to others (Table 2), and the latter having reactive sites that could react with the binder in the consequent curing process. No significant differences were observed among the flexural strengths among the OS@silanized biofillers, except for OS@ODTMS, which again exhibited a differential behavior with the lowest value suggesting the poorest interface within the polyester (Fig. 6b). These results of increasing modulus and almost no change in flexural strength are in agreement with previous findings.42
The viscoelastic properties of the new composites were evaluated with dynamic mechanical analysis (DMA). The polymer chain-packing density in the glassy state and glass transition temperature of the polymer are given by the storage modulus (E′) and the tan![[thin space (1/6-em)]](https://www.rsc.org/images/entities/char_2009.gif) δ, respectively.56,57 The response of a given material to an oscillatory deformation as a function of temperature allowed us to test the potential of reinforcement of OS@silanized materials as well as their interfacial properties. The storage modulus (E′) value of a composite is directly proportional to the interfacial strength of the filler and the matrix. For all composites studied, the behavior of an amorphous material was obtained, where a first plateau zone related to a glassy domain was observed until the temperature of the materials reached approximately 45 °C.
δ, respectively.56,57 The response of a given material to an oscillatory deformation as a function of temperature allowed us to test the potential of reinforcement of OS@silanized materials as well as their interfacial properties. The storage modulus (E′) value of a composite is directly proportional to the interfacial strength of the filler and the matrix. For all composites studied, the behavior of an amorphous material was obtained, where a first plateau zone related to a glassy domain was observed until the temperature of the materials reached approximately 45 °C.
In the glass transition region (45–90 °C), the storage modulus value shows a sharp decrease, followed by a modulus plateau at higher temperatures where the polymer behaves like a rubber (Fig. 7).
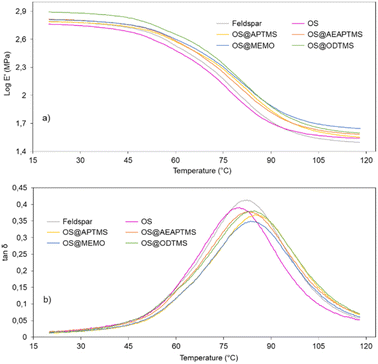 | ||
Fig. 7 DMA curves for cured samples of feldspar, native OS and OS@silanized: (a) storage modulus (log![[thin space (1/6-em)]](https://www.rsc.org/images/entities/char_2009.gif) E′) and (b) tan E′) and (b) tan![[thin space (1/6-em)]](https://www.rsc.org/images/entities/char_2009.gif) δ as a function of temperature (°C). δ as a function of temperature (°C). | ||
Note that except for the case of OS that the storage modulus obtained in the glassy domain is lower with respect to the feldspar sample, OS@silanized biocomposites present similar or even higher values, providing the material with similar or even higher stiffness. Furthermore, in the rubbery plateau, it could be observed that in all samples the E′ value is higher within biofillers than with feldspar, indicating that the physical crosslinking density increases in the silanized materials, especially with the OS@MEMO sample. An α relaxation centered at 82.1 °C (Table S6†) was obtained when the evolution of the loss angle (tan![[thin space (1/6-em)]](https://www.rsc.org/images/entities/char_2009.gif) δ) as a function of the temperature was analyzed for the feldspar composite. This value is related to the glass transition temperature Tg of the crosslinked polyester matrix. The addition of OS to the mixture led to a decrease in the intensity of relaxation along with a moderate negative shift of temperature (80.5 °C). However, when OS@silanized biofillers were used, the Tg values increased to 86.1, 82.9, 84.0 and 84.6 °C for OS@APTMS, OS@AEAPTMS, OS@MEMO and OS@ODTMS, respectively (Table S6†). This behavior is consistent with a more restricted molecular motion imposed by the chemical connectivity between the biofiller and the polyester matrix through the silane coupling agent, which causes a decrease in the amount of energy that could dissipate throughout the nanocomposite, causing a shifting to higher temperatures. This result provides evidence for the slight improvement in the interfacial adhesion between the polymer matrix and the OS@silanized biofiller with respect to feldspar. In line with these findings, SEM micrographs reveal the microscopic appearance of the composites, where a homogeneous distribution of particles is observed in all of them (Fig. 8). Fig. S49–S51† provide full sets of images for each of the composites, including those with feldspar and native olive stone.
δ) as a function of the temperature was analyzed for the feldspar composite. This value is related to the glass transition temperature Tg of the crosslinked polyester matrix. The addition of OS to the mixture led to a decrease in the intensity of relaxation along with a moderate negative shift of temperature (80.5 °C). However, when OS@silanized biofillers were used, the Tg values increased to 86.1, 82.9, 84.0 and 84.6 °C for OS@APTMS, OS@AEAPTMS, OS@MEMO and OS@ODTMS, respectively (Table S6†). This behavior is consistent with a more restricted molecular motion imposed by the chemical connectivity between the biofiller and the polyester matrix through the silane coupling agent, which causes a decrease in the amount of energy that could dissipate throughout the nanocomposite, causing a shifting to higher temperatures. This result provides evidence for the slight improvement in the interfacial adhesion between the polymer matrix and the OS@silanized biofiller with respect to feldspar. In line with these findings, SEM micrographs reveal the microscopic appearance of the composites, where a homogeneous distribution of particles is observed in all of them (Fig. 8). Fig. S49–S51† provide full sets of images for each of the composites, including those with feldspar and native olive stone.
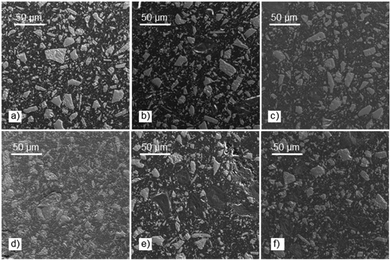 | ||
| Fig. 8 SEM images showing the microstructure of the composites containing: (a) feldspar; (b) OS; (c) OS@MEMO; (d) OS@AEAPTMS; (e) OS@APTMS; and (f) OS@ODTMS. | ||
The hydrophobic behavior of the biofillers and final composite materials was also determined by measuring the static contact angle with drops of water, formamide and diiodomethane (Tables S9 and S10†). The native OS biofiller displayed an initial water droplet contact angle of 45°, which completely adsorbed within the pellet after 5 seconds. This rapid adsorption effect was even more pronounced in OS@MEMO, where the droplet immediately adsorbed upon deposition. In contrast, larger contact angles of 105°, 84°, and 107° were determined for OS@APTMS, OS@AEAPTMS, and OS@ODTMS, respectively. This indicates that in these three cases, the silane treatment modified the wettability of the biofiller, with OS@AEAPTMS being the biofiller with the highest affinity for water. When considering droplets of formamide and diiodomethane, the behavior is opposite, with OS@APTMS exhibiting higher wettability with angles of 43° and 11°, for each droplet of formamide and diiodomethane, respectively (Table S10†).
Regarding the composites, in water, a significant increase in the contact angle was obtained when going from the native OS (80°) to the silanized specimens (97–118°), while in formamide, the OS produced an angle of 63°, and the contact angles of silanized biofillers were all within the range of 81–109°. The diiodide drop was not affected by the different composites, which obtain a contact angle in the range of 45–54°. Interestingly, all OS@silanized biofillers showed a purely hydrophobic behavior with negative values of water adhesion tension (τ0),58 except the native OS, which was positive, again demonstrating the effect that the silane coating can produce on the final properties of the composite (Table S9†).
The evaluation of the surface chromaticity in the resulting composites was also established using the CIELAB scale. Fig. S48† shows the visual colors of the two controls (pure resin and sodium feldspar) and those with olive stone biofillers. Table S8† shows the luminosity and chromacity values together with the chromatic aberrations (ΔL*, Δa* and Δb*). The latter are calculated by subtracting in each coordinate the value obtained when an 8% of biofiller is used from that obtained in 50/50 %wt. As expected, all chromatic aberrations significantly differ one from each other with the highest luminosity ΔL* obtained in OS@AEAPTMS and the highest chromacity Δa* and Δb* in OS@AEAPTMS and OS@ODTMS, respectively. Furthermore, chromatic aberrations and color change can be assessed by determining the color difference (ΔE) between the CIELAB values before and after adding the biofiller.43 As can be seen in Table S8,† the trend of ΔE is very similar to that of ΔL*, where the highest change of 25.5 and 24.0 is produced with OS@AEAPTMS and OS@APTMS, respectively, and the smallest change of similar magnitude is achieved when the native OS filler is used.
Experimental
Materials and methods
Olive wood shell stone (OS) was provided by the Spanish olive company Castillo located in Castillo de Canena in Jaén (Spain). The solid was milled with an analytical mill (IKA MF-10) and <124 μm fraction was chosen for the characterization and functionalization assays without any pre-treatment (Fig. S12†). Unless otherwise indicated, reagents and substrates were purchased from commercial sources and used as received. Solvents were purchased as technical grade and used as received. Polyester resin (Polres 12) was acquired from Omar Coatings, cobalt accelerator (Valirex Co 6% D60) and tert-butyl peroxybenzoate (TRIGONOX 93) were purchased from United Initiators and sodium feldspar (STONETUN S.FLT.45.EX) was obtained from Kaltun (Turkey).![[thin space (1/6-em)]](https://www.rsc.org/images/entities/char_2009.gif) δ = (E′′/E′) were measured as a function of temperature. The sample dimensions were about 4 × 1 × 0.4 cm. The main relaxation temperature T is defined as the temperature where the maximum of tan
δ = (E′′/E′) were measured as a function of temperature. The sample dimensions were about 4 × 1 × 0.4 cm. The main relaxation temperature T is defined as the temperature where the maximum of tan![[thin space (1/6-em)]](https://www.rsc.org/images/entities/char_2009.gif) δ is reached.
δ is reached.
Synthetic procedures
Conclusions
The synthesis of highly functionalized native olive wood shell stone (OS) with four different silanes has been optimized, and the resulting materials were thoroughly characterized. Silanized OS exhibited higher thermal stability compared to native OS. Surface charge analyses indicated improved stability under specific pH conditions for different silanes, in particular the substantial increase in ζ-potential values for OS@APTMS and OS@AEAPTMS at pH 4. Incorporating these biofillers into composites enhanced hardness and flexural modulus, with OS@APTMS and OS@MEMO showing the most promising results. DMA analysis suggested increased cross-linking density in silanized materials, especially prominent in the OS@MEMO probe, further supporting their role in enhancing material strength. An additional significant enhancement brought about by silanization was the marked improvement in the hydrophobic behavior of the composite materials. The transition from native OS to silanized specimens resulted in a substantial increase in the static contact angle, indicative of heightened water repellency. Overall, these findings offer potential for producing eco-friendly polyester-based composites using agricultural residues, thereby reducing environmental impact and promoting a circular economy.Author contributions
Melissa Olmedo-Navarro: investigation, validation, writing. Juana M. Pérez: investigation, validation, writing – original draft, writing – reviewing and editing, conceptualization, supervision, formal analysis. Natalia Gutiérrez-Segura: investigation. Bernardo Sánchez-Sevilla: investigation. Yolanda Soriano-Jerez: investigation, writing – reviewing and editing. Diego A. Alonso: investigation. Mari Carmen Cerón: investigation, writing – reviewing and editing. Ignacio Fernández: conceptualization, validation, visualization, supervision, writing – reviewing and editing, formal analysis, project administration, funding acquisition.Conflicts of interest
There are no conflicts to declare.Acknowledgements
This research has been funded by the State Research Agency of the Spanish Ministry of Science and Innovation (PID2021-126445OB-I00), by the Gobierno de España MCIN/AEI/10.13039/501100011033/Unión Europea “Next Generation EU”/PRTR (PDC2021-121248-I00, PLEC2021-007774, PDC2022-133206-100 and CPP2022-009967), and by the Generalitat Valenciana (project AICO 2021/013). N. G.-S. and J. M. P. acknowledge the Spanish Ministry of Science and Innovation and the University of Almería for a PTA (PTA2021-020795-I) and postdoctoral (Hipatia2021_04) grants, respectively. We would like to thank Prof. Ignacio Martín-Gullón for helpful discussions regarding the mechanical properties of the biocomposites.Notes and references
- M. Castellano, A. Gandini, P. Fabbri and M. N. Belgacem, J. Colloid Interface Sci., 2004, 273, 505–511 CrossRef CAS PubMed
.
- G. Rodríguez, A. Lama, R. Rodríguez, A. Jiménez, R. Guillén and J. Fernández-Bolaños, Bioresour. Technol., 2008, 99, 5261–5269 CrossRef PubMed
.
- R. González-Lamothe, G. Mitchell, M. Gattuso, M. S. Diarra, F. Malouin and K. Bouarab, Int. J. Mol. Sci., 2009, 10, 3400–3419 CrossRef PubMed
.
- J. M. Rosúa and M. Pasadas, Renewable Sustainable Energy Rev., 2012, 16, 4190–4195 CrossRef
.
- J. F. González, C. M. González-García, A. Ramiro, J. González, E. Sabio, J. Gañán and M. A. Rodríguez, Biomass Bioenergy, 2004, 27, 145–154 CrossRef
.
- T. Kushwaha, S. Ao, K. Ngaosuwan, S. Assabumrungrat, B. Gurunathan and S. Lalthazuala Rokhum, Environ. Prog. Sustainable Energy, 2023, e14170 CrossRef CAS
.
- A. E. Pütün, B. B. Uzun, E. Apaydin and E. Pütün, Fuel Process. Technol., 2005, 87, 25–32 CrossRef
.
- F. Yousefian, M. A. Babatabar, M. Eshaghi, S. M. Poor and A. Tavasoli, Fuel Process. Technol., 2023, 247, 107818 CrossRef CAS
.
- T. Budinova, N. Petrov, M. Razvigorova, J. Parra and P. Galiatsatou, Ind. Eng. Chem. Res., 2006, 45, 1896–1901 CrossRef CAS
.
- J. Saleem, U. Bin Shahid, M. Hijab, H. Mackey and G. McKay, Biomass Convers. Biorefin., 2019, 9, 775–802 CrossRef CAS
.
- D. Montané, J. Salvadó, C. Torras and X. Farriol, Biomass Bioenergy, 2002, 22, 295–304 CrossRef
.
- J. Tejeda-Ricardez, C. Vaca-García and M. E. Borredón, Chem. Eng. Res. Des., 2003, 81, 1066–1070 CrossRef CAS
.
- A. S. Singha and R. K. Rana, Mater. Des., 2012, 41, 289–297 CrossRef CAS
.
- C. A. Kakou, F. Z. Arrakhiz, A. Trokourey, R. Bouhfid, A. Qaiss and D. Rodrigue, Mater. Des., 2014, 63, 641–649 CrossRef CAS
.
- D. González, V. Santos and J. C. Parajó, J. Thermoplast. Compos. Mater., 2012, 25, 1005–1022 CrossRef
.
- O. M. L. Asumani, R. G. Reid and R. Paskaramoorthy, Composites, Part A, 2012, 43, 1431–1440 CrossRef CAS
.
- A. Schirp and M. P. Wolcott, Wood Fiber Sci., 2005, 37, 643–652 Search PubMed
.
- S. Valvez, A. Maceiras, P. Santos and P. N. B. Reis, Materials, 2021, 14, 845–876 CrossRef CAS
.
- R. Banat, Am. J. Polym. Sci., 2019, 9, 10–15 CAS
.
- J. U. Hernández-Beltrán, I. O. Hernández-De Lira, M. M. Cruz-Santos, A. Saucedo-Luevanos, F. Hernández-Terán and N. Balagurusamy, Appl. Sci., 2019, 9, 3721–3750 CrossRef
.
- B. Hamida, M. Ahmed, N. Nadia and M. Samira, Res. J. Pharm., Biol. Chem. Sci., 2015, 6, 127–132 CAS
.
- A. F. Koutsomitopoulou, J. C. Bénézet, A. Bergeret and G. C. Papanicolaou, Powder Technol., 2014, 255, 10–16 CrossRef CAS
.
- S. Perinović Jozić, D. Jozić, M. Erceg, B. Andričić and S. Bernstorff, Thermochim. Acta, 2020, 683, 178440 CrossRef
.
- S. Souissi, F. Lachtar, A. Elloumi and A. Bergeret, Iran. Polym. J., 2022, 31, 1511–1521 CrossRef CAS
.
- G. Siracusa, J. Polym. Environ., 2001, 9, 157–161 CrossRef CAS
.
- D. Polidoro, A. Perosa, M. Selva and D. Rodríguez-Padrón, ChemCatChem, 2023, 15, e202300415 CrossRef CAS
.
- S. Raza, Y. Orooji, E. Ghasali, A. Hayat, H. Karimi-Maleh and H. Lin, J. CO2 Util., 2023, 67, 102295 CrossRef CAS
.
-
W. Crane, F. Krausmann, N. Eisenmenger, S. Giljum, P. Hennicke, R. Kemp, P. R. Lankao, B. S. Manalang and S. Sewerin, Decoupling Natural Resource Use and Environmental Impacts from Economic Growth, United Nations Environment Programme, Paris, 2011 Search PubMed
.
- X. Li, L. G. Tabil and S. Panigrahi, J. Polym. Environ., 2007, 15, 25–33 CrossRef
.
- L. Srisuwan, K. Jarukumjorn and N. Suppakarn, Adv. Mater. Sci. Eng., 2018, 2018, 1–14 Search PubMed
.
- J. George, M. S. Sreekala and S. Thomas, Polym. Eng. Sci., 2001, 41, 1471–1485 CrossRef CAS
.
- C. Joly, R. Gauthier and M. Escoubes, J. Appl. Polym. Sci., 1996, 61, 57–69 CrossRef CAS
.
- H. Aouat, D. Hammiche, A. Boukerrou, H. Djidjelli, Y. Grohens and I. Pillin, Mater. Today: Proc., 2020, 36, 94–100 Search PubMed
.
-
C. K. Jayasuriya, Interfacial Bonding in Polymer–Ceramic Nanocomposites☆, 2017 Search PubMed
.
- I. C. Cabrera, S. Berlioz, A. Fahs, G. Louarn and P. Carriere, Int. J. Biol. Macromol., 2020, 165, 1773–1782 CrossRef CAS
.
- Y. Xie, C. A. S. Hill, Z. Xiao, H. Militz and C. Mai, Composites, Part A, 2010, 41, 806–819 CrossRef
.
- M. K. Thakur, R. K. Gupta and V. K. Thakur, Carbohydr. Polym., 2014, 111, 849–855 CrossRef CAS
.
- P. Fermo, G. Cappelletti, N. Cozzi, G. Padeletti, S. Kaciulis, M. Brucale and M. Merlini, Appl. Phys. A: Mater. Sci. Process., 2014, 116, 341–348 CrossRef CAS
.
- R. H. Halvorson, R. L. Erickson and C. L. Davidson, Dent. Mater., 2003, 19, 327–333 CrossRef CAS
.
- M. Abdelmouleh, S. Boufi, M. N. Belgacem, A. P. Duarte, A. Ben Salah and A. Gandini, Int. J. Adhes. Adhes., 2004, 24, 43–54 CrossRef CAS
.
- A. Valadez-Gonzalez, J. M. Cervantes-Uc, R. Olayo and P. J. Herrera-Franco, Composites, Part B, 1999, 30, 321–331 CrossRef
.
- A. Gharbi, R. B. Hassen and S. Boufi, Ind. Crops Prod., 2014, 62, 491–498 CrossRef CAS
.
- B. Sánchez-Sevilla, M. Olmedo-Navarro, J. M. Pérez, J. A. Martínez-Lao and I. Fernández, ChemistrySelect, 2023, 8, e20230034 CrossRef
.
- L. Hassaini, M. Kaci, N. Touati, I. Pillin, A. Kervoelen and S. Bruzaud, Polym. Test., 2017, 59, 430–440 CrossRef CAS
.
- J. Miedzianowska, M. Masłowski, P. Rybinski and K. Strzelec, Materials, 2020, 13, 4163–4186 CrossRef CAS PubMed
.
- C. Ihamouchen, H. Djidjelli, A. Boukerrou, S. Krim, M. Kaci and J. J. Martinez, J. Appl. Polym. Sci., 2012, 123, 1310–1319 CrossRef CAS
.
- F. Zhou, G. Cheng and B. Jiang, Appl. Surf. Sci., 2014, 292, 806–812 CrossRef CAS
.
- D. S. Nakonieczny, F. Kern, L. Dufner, A. Dubiel, M. Antonowicz and K. Matus, Materials, 2021, 14, 6651–6665 CrossRef CAS PubMed
.
- T. Nakamura, R. Tsutsumi, C. Hashiguchi, T. Terao, K. Manabe, T. Hirai, S. Fujii and Y. Nakamura, J. Appl. Polym. Sci., 2021, 138, e51297 CrossRef
.
- K. Wolski, S. Cichosz and A. Masek, Eur. Polym. J., 2019, 118, 481–491 CrossRef CAS
.
- S. N. Monteiro, V. Calado, R. J. S. Rodriguez and F. M. Margem, J. Mater. Res. Technol., 2012, 1, 117–126 CrossRef CAS
.
- L. Sanchez-Silva, D. López-González, J. Villaseñor, P. Sánchez and J. L. Valverde, Bioresour. Technol., 2012, 109, 163–172 CrossRef CAS PubMed
.
- A. Chouchene, M. Jeguirim, B. Khiari, F. Zagrouba and G. Trouvé, Resour., Conserv. Recycl., 2010, 54, 271–277 CrossRef
.
- J. F. García Martín, M. Cuevas, C. Feng, P. Á. Mateos and M. Torres, Processes, 2020, 8, 1–38 Search PubMed
.
-
R. J. Hunter, R. H. Ottewill and R. L. Rowell, Zeta Potential in Colloid Science: Principles and Applications, Elsevier Science, 2013 Search PubMed
.
- F. O. Bakare, M. Skrifvars, D. Åkesson, Y. Wang, S. J. Afshar and N. Esmaeili, J. Appl. Polym. Sci., 2014, 131, 1–9 CrossRef
.
- S. Chang, C. Zeng, J. Li and J. Ren, Polym. Int., 2012, 61, 1492–1502 CrossRef CAS
.
- E. A. Vogler, J. Biomater. Sci., Polym. Ed., 1999, 10, 1015–1045 CrossRef CAS
.
- O. Zeriouh, A. Marco-Rocamora, J. V. Reinoso-Moreno, L. López-Rosales, F. García-Camacho and E. Molina-Grima, Biotechnol. Bioeng., 2019, 116, 2212–2222 CrossRef CAS
.
Footnote |
| † Electronic supplementary information (ESI) available. See DOI: https://doi.org/10.1039/d3su00475a |
| This journal is © The Royal Society of Chemistry 2024 |

