A noninvasive blood glucose detection method with strong time adaptability based on fuzzy operator decision fusion and dynamic spectroscopy characteristics of PPG signals
Rui
Liu
a,
Jieqiang
Liu
b,
Zhengwei
Huang
c and
Qingbo
Li
 *a
*a
aSchool of Instrumentation and Optoelectronic Engineering, Precision Opto-Mechatronics Technology Key Laboratory of Education Ministry, Beihang University, Beijing, China. E-mail: qbleebuaa@buaa.edu.cn
bBeijing Orient Institute of Measurement & Test, Youyi Road No. 104, Haidian District, Beijing, 100094, China
cBeijing BAIF-Maihak Analytical Instrument Co., Ltd, Beijing, 100095, China
First published on 7th November 2024
Abstract
PPG signals are a new means of non-invasive detection of blood glucose, but there are still shortcomings of poor time adaptability and low prediction accuracy of blood glucose quantitative models. Few studies discuss prediction accuracy in the case of a large time interval span between modeling and prediction. This paper proposes an automatic optimal threshold baseline removal algorithm based on variational mode decomposition (AOT-VMD), which can adaptively eliminate high-frequency noise and baseline interference for each decomposed IMF modal component and reduce the baseline difference of PPG signals from different days. Furthermore, a fuzzy integral multi-model decision fusion algorithm based on error weight is proposed. The fuzzy integral operator is introduced to make the features with large contributions in each sub-model maintain a high-weight value in the overall prediction mechanism, which improves the prediction accuracy of blood glucose. In this paper, a self-developed portable PPG glucose meter is used to collect PPG signals, and the true blood glucose values for 8 consecutive days are collected by CGM. The proposed algorithm is used to build a model with the first day's data and predict the blood glucose values for the remaining 7 days. The experimental results show that the AOT-VMD preprocessing algorithm and the quantitative regression algorithm of the fuzzy integral multiple model decision fusion algorithm proposed in this paper perform well in measurement accuracy and time adaptability compared with the traditional methods. In addition, the proposed method requires less invasive calibration samples in the modeling stage, achieving high-precision prediction for a long period. 100% of the samples are located in areas A and B of the Clarke area in this experiment, and the algorithm has strong time generalization ability. This innovative method can promote the development of a home blood glucose noninvasive detector.
1 Introduction
Diabetes is a chronic disease that seriously endangers human health. It is second only to tumors and cardiovascular and cerebrovascular diseases in severity. Diabetes cannot be cured using existing medical means. The World Health Organization recommends that patients achieve real-time and continuous monitoring of blood glucose concentration. In accordance with the blood glucose measurement results, patients need to adjust their medication, inject insulin or use other medical means in time to control the blood glucose concentration1 and reduce the occurrence of complications. Therefore, blood glucose detection plays a vital role both in the early diagnosis of diabetes and in the control of complications in diabetic patients. Currently, the main clinical method used involves invasive detection, but this method needs to collect blood, and easily causes wound infection.2 To replace this invasive detection method, scientists are studying methods to replace blood detection for blood glucose measurement. The continuous blood glucose minimally invasive detection3 device CGM4 is a relatively mature market product that can be used based on the principle of interstitial fluid measurement. However, this minimally invasive method also has the disadvantages of high cost, high risk of infection, difficulty in detection, poor skin healing ability of diabetic patients, difficulty in wound healing, and high risk of allergy. Compared with invasive and minimally invasive methods, non-invasive blood glucose detection can improve the measurement method and reduce the pain of patients' blood glucose detection. However, the current non-invasive blood glucose detection methods still have the disadvantages of high cost, low accuracy, poor measurement robustness, and poor time adaptability. At present, the mainstream optical methods for non-invasive detection of blood glucose mainly include near-infrared spectroscopy detection, Raman spectroscopy, and photoplethysmography (PPG). The research on non-invasive blood glucose detection by near-infrared spectroscopy5 and Raman spectroscopy6 started early, but the equipment cost of near-infrared spectroscopy and Raman spectroscopy is high, so it is difficult to promote on a large scale. PPG7 combines data processing algorithms and machine learning techniques, uses monochromatic LEDs8 as light sources, reduces the cost of the instrument, and can infer blood glucose levels by analyzing PPG signals. In 2022, Zihan Nie et al.9 collected the features in PPG signals, 80% of the data were modeled, and 20% of the data were used for prediction, and the RFR method was used to establish a blood glucose prediction model with a root mean square error of 22.55 mg mL−1. In 2022, Anju Prabha et al.10 in India collected PPG signals and used support vector regression and the gradient enhanced regression algorithm to predict blood glucose levels. Standard Clarke error grid analysis showed that the predicted glucose value was in the clinically acceptable region. In 2023, a team11 from Mexico's National Institute of Technology used monochromatic LEDs with 525 nm, 660 nm, and 940 nm light sources to collect PPG signals from subjects. 70% of the data is used for training, while the remaining 30% is used to validate the results, which shows that the prediction error is less than 15%. Although the above studies have achieved high accuracy, the time span of the training and test sets is not given in this paper, so the time adaptability of the model cannot be evaluated. Moreover, the demand for modeling data is large, so the number of invasive calibration experiments is too large in practical applications, which also causes a psychological burden to the subjects in practical use. Therefore, high-precision blood glucose prediction under the conditions of long time span and small sample modeling has more practical application value.In this paper, self-developed hardware is used to collect PPG signals using multiple wavelength LEDs as light sources. In addition, a non-invasive blood glucose detection method with low cost and high detection accuracy based on PPG signals, less invasive calibration times, and a wide prediction time range is proposed.
In terms of data preprocessing, this paper proposes an automatic optimization threshold baseline noise removal algorithm based on variational mode decomposition. This achieved the effective removal of the signal baseline and high-frequency noise, and as far as possible eliminated the interference of the instrument state change over time, the physiological state of the subject, the test pressure, the detection site, and other measurement conditions. In addition, this paper proposes a weighted fuzzy integral multi-model decision fusion algorithm. It can adaptively adjust the nonlinear integral fusion weight parameters, and different sub-models select the best features as training models, which reduces the sample size requirement of the model. This improves the precision of blood glucose prediction in the case of small sample modeling.
2 Methodology
2.1 Data preprocessing
A PPG signal is a weak signal from the human body, which contains the interference of the low-frequency baseline, high-frequency noise and other material components. In order to remove the interference from this information, the signal is preprocessed before feature extraction. The automatic optimized threshold baseline noise removal algorithm based on variational mode decomposition consists of two main parts: variational mode decomposition and threshold denoising. Variational mode decomposition (VMD)12 can decompose the original signal into each intrinsic mode function (IMF). The variational mode decomposition method uses a completely non-recursive model to adaptively and iteratively control the center frequency of each IMF component, and artificially sets the number of IMF components after decomposition to achieve effective separation of signals at each frequency.Most of the traditional denoising methods based on variational mode decomposition directly discard the high-frequency IMF component, or filter the correlation coefficient and set the threshold of the correlation coefficient. Only when the correlation coefficient between the IMF and the original signal exceeds the threshold, the IMF signal of this layer is retained. However, this can only measure the linear relationship, and for some nonlinear relationship information, it will cause information loss. In order to effectively eliminate the baseline interference and high-frequency noise components caused by respiration in the PPG signal, and fully retain the original effective information, an automatic optimal threshold baseline noise removal algorithm based on variational mode decomposition (VMD) is proposed in this paper. In the traditional denoising algorithm based on the variational mode decomposition method, the threshold needs to be set manually. The key denoising parameters are estimated based on statistical and experimental analyses, and the estimated threshold is fixed, which is difficult to change manually according to different IMF components. In order to solve the above problems, the evaluation function is introduced to iterate and determine the best parameters to determine the threshold, so that the denoising effect is more obvious and the signal information contained in each order IMF component can be retained. The algorithm process is as follows:
(1) The original signal is decomposed by variational mode decomposition, and the relationship between the original signal and the IMF signals of each order can be expressed as the following equation, which can be decomposed into k mode functions and a drift baseline term.
| x(t) = imf1 + imf2 +… + imfk + res |
(2) The Pearson correlation coefficient between the modal functions of each layer and the original PPG signal is calculated, and the IMF functions of each order are rearranged according to the correlation coefficient size from large to small.
(3) The signal energy of the mode function with the largest correlation coefficient E is calculated.
(4) The correlation coefficient threshold C is set, and it is assumed that there are m mode functions with a correlation coefficient greater than or equal to C. Finally, the signal without baseline noise is Y(t). Then Y(t) can be obtained by using the following equation.
 is the pure mode function denoised by using the automatically optimized threshold.
where Ti is the denoising threshold of each IMF. In the study, the general threshold is set as follows:
where K is a constant, E is the signal energy of the mode function with the largest correlation coefficient, β is the parameter to be optimized, and N is the signal length.
(5) The optimal parameter β needs to be determined through several iterations, and the iterative evaluation function f is as follows:
An increase in r11 means that the useful component is larger than the noisy component. If r22 and hr21 are decreasing, then this means that the two signals are becoming more independent. As a result, the original signal and noise are gradually separated. In general, the noise denoising process performs better if r11 is larger, and r22 and hr21 are smaller, so f is expected to be as small as possible. Under the guidance of the evaluation function, the appropriate step is selected for parameter iteration to determine the optimal parameters.
The overall process of the automatic optimization threshold baseline noise removal algorithm based on variational mode decomposition is shown in Fig. 1.
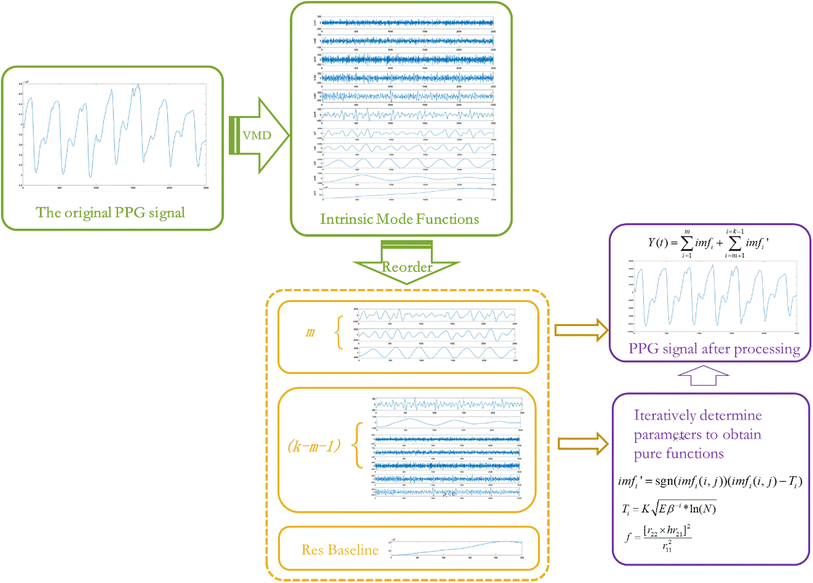 | ||
| Fig. 1 Automatic optimization threshold baseline noise removal algorithm based on variational mode decomposition. | ||
2.2 Quantitative detection
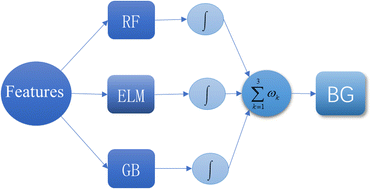
Considering the error caused by jitters and stray light, the relationship between blood glucose value and PPG signal characteristics (R coefficient, skewness, fractal dimension,13C0 complexity,14 and spectral entropy) is not linear, so it is necessary to determine a nonlinear multiple regression algorithm to complete the prediction of the blood glucose value. In this paper, a weight-based fuzzy integral multiple model decision fusion algorithm is proposed, and the parameters are adaptively adjusted. Three highly accurate and widely used nonlinear prediction models are nested in the algorithm, namely random forest,15 support vector machine16 and gradient boosting.17The commonly used multi-sub-model fusion structure uses the weighted average method, but the weighted average fusion structure needs to meet a condition, that is, the contribution of each sub-model to the final result is completely linear, and there is no interaction between the features. However, the interaction between features exists in blood glucose value prediction. In order to improve the accuracy of multiple nonlinear regression of the blood glucose value and better realize the accurate prediction of blood glucose, this paper uses the fuzzy integral multi-model decision fusion algorithm based on weight and chooses random forest, extreme learning machine, and gradient boosting as the sub-models with high accuracy. The fuzzy integral operator adopts the Choquet integral integration operator, which is a nonlinear integral method. The fuzzy measure can describe the interaction between each attribute, and then it is used to determine the weight to improve the accuracy of nonlinear regression. The specific algorithm is shown in Fig. 2.
First, as mentioned above, the temporal and spatial characteristics of human PPG signals were obtained, and the features of the two dimensions were fused as the input of the above three quantitative regression models, and a total of three kinds of blood glucose prediction values were obtained. Then a fuzzy integral is used to fuse these three blood glucose values.
According to the concept of fuzzy measure, if X = {X1,X2,…,Xn} is a group of N information sources, then fuzzy measure g: 2X → Ris+ is a function that can more effectively describe the joint contribution rate of feature attributes to the target attribute. According to Choquet's requirements, this function should satisfy the following boundary conditions and monotonicity:
(a) Triviality, g(ϕ) = 0, and g(X) = 1.
(b) Monotonicity, if A,B⊆X, and A⊆B, then g(A) ≤ g(B).
The Chouquet integral of the observation h over X is expressed as follows.
where rt and rt′ represent the true and predicted values of blood glucose in the training set, respectively, and T is the total number of samples in the training set.
where BG is the final predicted value and
 is the output of each model after the Choquet integral in the test data set.
3 Experimental
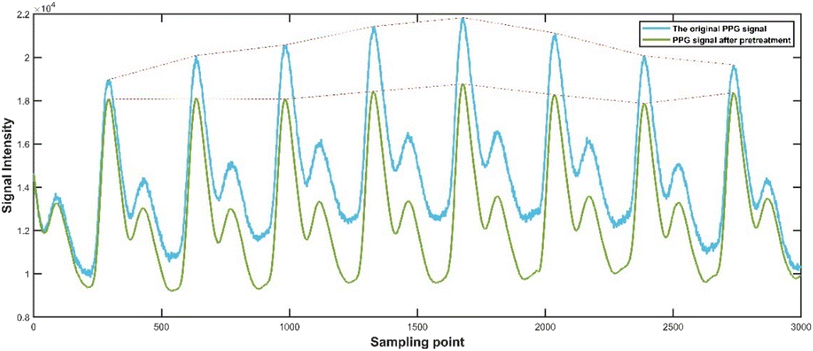
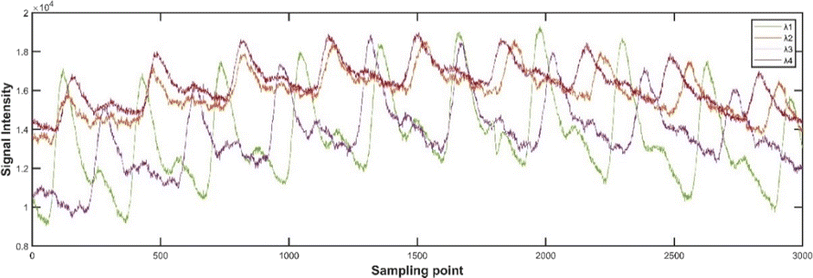
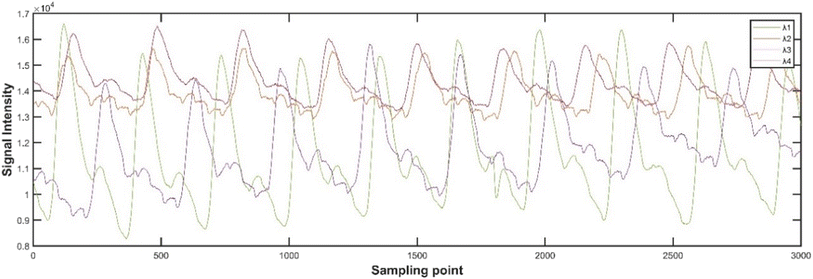
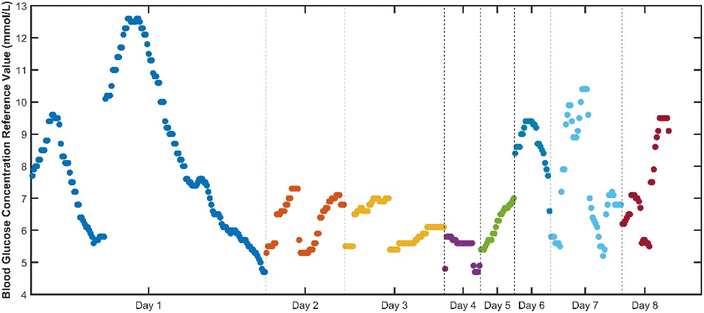
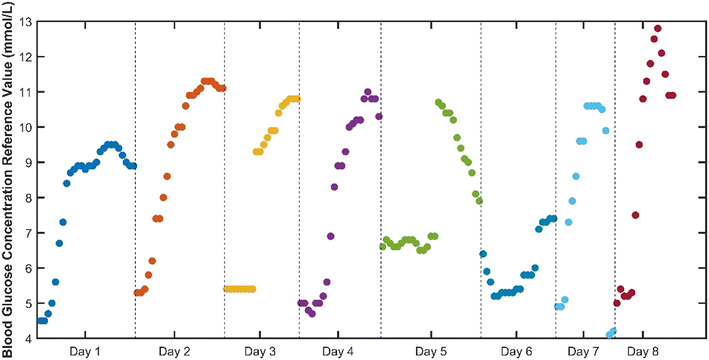
To verify the superiority of the proposed method, blood glucose detection experiments are designed in this paper. The PPG signal acquisition system is independently developed by our team, which uses four low-cost patch type multi-wavelength LEDs as signal acquisition light sources, and Si-based photodetectors to collect reflected light signals. The collected signals are transmitted to the host computer for signal preprocessing, feature extraction and quantitative regression prediction. And the predicted blood glucose value is transmitted back to the microprocessor system through Bluetooth, which is displayed on the display screen of the microprocessor system. In this paper, the blood glucose value detected by the CGM continuous glucose detection system was used as the reference true value, and the experimental subjects were healthy adults without diabetes, and 8 days was used as an experimental period for two cycles of experiments. The collected original PPG signals of each wavelength and the preprocessed signals are shown in Fig. 3–5, where λ1, λ2, λ3, and λ4 respectively represent PPG signals collected when LEDs of different wavelengths are used as light sources. It can be intuitively seen from the figure that the baseline and high-frequency noise of PPG signals at each wavelength are effectively removed after the preprocessing algorithm.Each experimental period includes 8 days, and the distribution of time and blood glucose values for each experimental period is shown in Fig. 6 and 7.
Compared with the first experimental period, the second experimental period reduced the amount of invasive data collected on the first day. The first experimental period was divided into Day 1 as the training set and Day 2–Day 8 as the test set. Due to the small blood glucose range on the first day of the second week experimental cycle, the second experimental period was divided into Day 1 and Day 2 combined as the training set, and Day 3–Day 8 as the test set.
4 Results and discussion
4.1 Experiment 1: comparison of different preprocessing methods
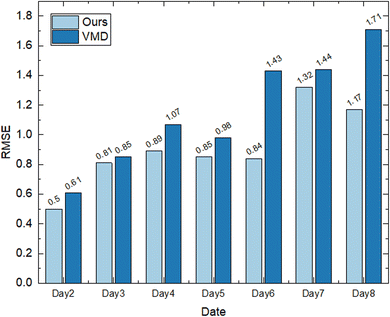
In order to verify that the preprocessing method proposed in this paper can effectively remove the baseline and noise, and retain effective information, the PPG signal is preprocessed by the preprocessing algorithm proposed in this paper and the traditional variational mode decomposition algorithm, and the eigenvalues are extracted. Then the quantitative detection algorithm proposed in this paper is used to compare the results. The experiment was carried out using the first cycle data, modeling the first day data and predicting the next seven days' data. The evaluation method is the root mean square error (RMSE), and the formula is as follows:The experimental results are presented in Table 1.
| Training set date | Test set date | RMSE (mmol L−1) | A% | A + B% | |||
|---|---|---|---|---|---|---|---|
| Ours | VMD | Ours | VMD | Ours | VMD | ||
| Day 2 | 0.50 | 0.61 | 100% | 100% | 100% | 100% | |
| Day 3 | 0.81 | 0.85 | 79% | 70% | 100% | 100% | |
| Day 4 | 0.89 | 1.07 | 100% | 47% | 100% | 78% | |
| Day 1 | Day 5 | 0.85 | 0.98 | 82% | 56% | 100% | 85% |
| Day 6 | 0.84 | 1.43 | 96% | 57% | 100% | 78% | |
| Day 7 | 1.32 | 1.44 | 67% | 62% | 100% | 79% | |
| Day 8 | 1.17 | 1.71 | 79% | 60% | 100% | 72% | |
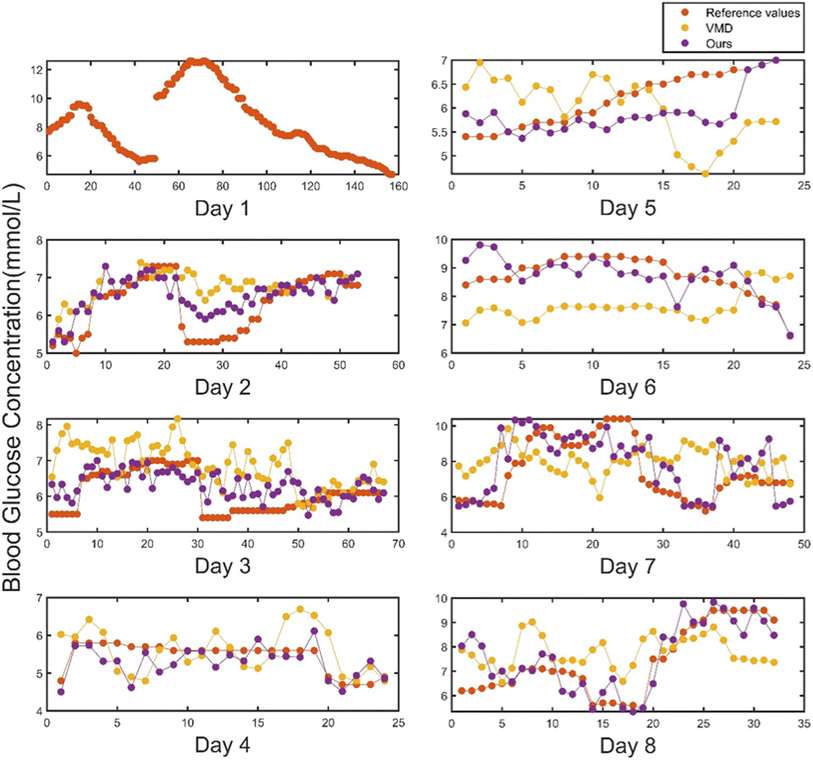
It can be seen from the results that the signal denoised by the preprocessing algorithm proposed in this paper has better performance in blood glucose prediction results. This is because the traditional VMD denoising simply removes all the high-frequency IMF components in the signal and ignores the biological signal information that may be contained in the high-frequency signal. The clean signal and noise signal are separated for each order component. The separation index parameter is determined by the similarity between the IMF component and the original signal, and it is adaptively iterated. This enables each layer of the IMF component of each PPG signal to have an optimal separation parameter, which effectively removes the noise and also retains the effective information. In addition, the proposed algorithm can effectively remove the baseline and eliminate the influence of respiratory drift. It can be seen from the results that the measurement error of the traditional preprocessing algorithm increases with the increase in the time span, and the proportion of the results falling in the interval A and B is also decreasing, which does not meet the accuracy requirements of blood glucose prediction. The algorithm proposed in this paper improves the time adaptability of noninvasive blood glucose detection from the perspective of data preprocessing (Fig. 8 and 9).
4.2 Experiment 2: comparison of different quantitative regression algorithms
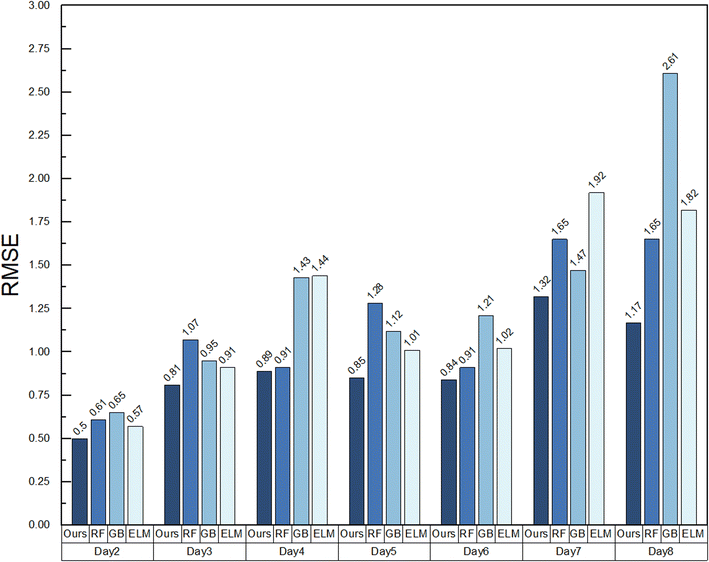
In order to verify that the quantitative detection method proposed in this paper improves the accuracy of blood glucose prediction, the PPG signal is preprocessed by the AOTVMD algorithm proposed in this paper, and the extracted features are respectively used for quantitative blood glucose regression prediction by the proposed algorithm, the ELM algorithm, random forest, and the gradient boosting algorithm. The first cycle data were used for the experiment, the data of the first day were modeled, and the data of the next seven days were predicted. The results are presented in Table 2.| Training set date | Test set date | RMSE | |||
|---|---|---|---|---|---|
| Ours | RF | GB | ELM | ||
| Day 2 | 0.50 | 0.61 | 0.65 | 0.57 | |
| Day 3 | 0.81 | 1.07 | 0.95 | 0.91 | |
| Day 4 | 0.89 | 0.91 | 1.43 | 1.44 | |
| Day 1 | Day 5 | 0.85 | 1.28 | 1.12 | 1.01 |
| Day 6 | 0.84 | 0.91 | 1.21 | 1.02 | |
| Day 7 | 1.32 | 1.65 | 1.47 | 1.92 | |
| Day 8 | 1.17 | 1.65 | 2.61 | 1.82 | |
The experimental results show that the integral fusion algorithm proposed in this paper can adaptively adjust the weights according to the contribution of different sample features and the contribution of sub-model prediction results, and map the sub-model prediction results to the fuzzy operator space. The features and sub-models with high accuracy can be better selected in the fusion strategy. Then, the prediction results of each sub-model are fused at the level of fuzzy operator, and finally the blood glucose prediction results are inverted. The proposed algorithm corrects the prediction bias of sub-models at the fuzzy operator level. Compared with the three sub-models in the fusion algorithm, the proposed algorithm improves the accuracy of blood glucose prediction results (Fig. 10).
4.3 Experiment 3: parallel experiment
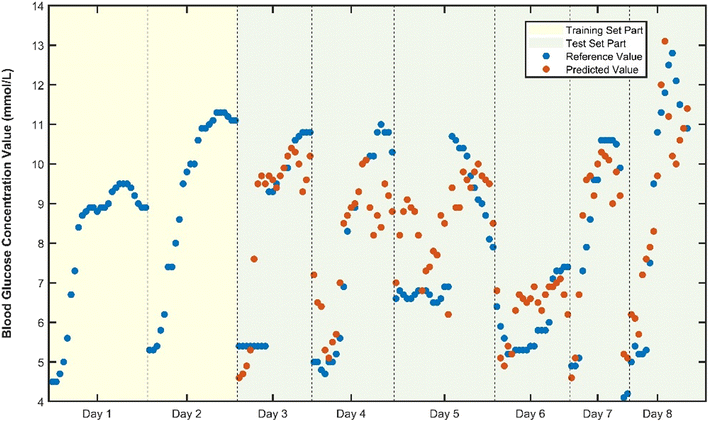
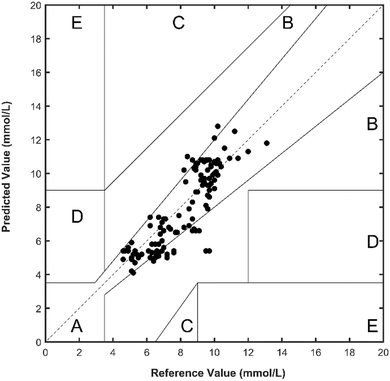
In order to further verify the algorithm proposed in this paper, the second experiment cycle is set as a parallel experiment for prediction, and the comparison between the prediction results and the reference value is shown in Fig. 11. It can be seen that the prediction results have a strong correlation with the reference true value in the trend. The Clarke error grid test results are shown in Fig. 12, and the predicted values all fall in the interval A and B, meeting the prediction requirements.The quantitative accuracy evaluation results of the second experimental cycle are shown in Table 3.
| Training set date | Test set date | Root mean square error | Correlation index | Proportion located in zone A | Proportion located in zone A + B |
|---|---|---|---|---|---|
| Day 1 + Day 2 | Day 3 | 0.96 | 0.74 | 93.8% | 100% |
| Day 4 | 1.34 | 0.87 | 78.9% | 100% | |
| Day 5 | 1.37 | 0.66 | 76.9% | 100% | |
| Day 6 | 0.94 | 0.60 | 80.0% | 100% | |
| Day 7 | 0.56 | 0.96 | 100% | 100% | |
| Day 8 | 1.23 | 0.72 | 66.7% | 100% |
The experimental results show that the blood glucose range of the system is 4.1–10.6 mmol L−1, the span is up to 9 mmol L−1, the effective detection time is 6 days, and the maximum root mean square error is 1.37 mmol L−1.
When the interval time between the training set and the test set is one week, the root mean square error and correlation coefficient indicators perform well, which meets the requirements of system design. The preprocessing part effectively eliminates the influence of the respiratory baseline and high-frequency noise adaptively without artificially setting parameters, retains the effective information of blood glucose to the greatest extent, and improves the signal-to-noise ratio. It reduces the interference of the change in the subject's physiological state on the model prediction.
In the quantitative regression prediction part of blood glucose, the idea of fuzzy integral fusion is used. The regression model with high prediction accuracy is selected in the sub-model and the prediction error of the sub-model is corrected in the fusion stage. The weights are given according to the prediction results of each sub-model. The features with large contributions in each sub-model also maintain a large contribution in the overall prediction mechanism, which alleviates the impact of sub-model prediction error on the overall accuracy.
With the passage of time, the hardware system itself will drift, and the subject's body state will also change. The proposed algorithm effectively eliminates the changes in the human body and the hardware system over time, and enhances the time adaptability. The method adopted in this paper has low instrument cost, improves the prediction accuracy and time adaptability, and the demand for modeling samples is small, which is of great significance to realize home non-invasive detection of blood glucose.
5 Conclusion
In this paper, we propose a non-invasive blood glucose detection method with low cost and high detection accuracy based on PPG signals, which requires less invasive calibration times and has a wide prediction time period.First, the AOT-VMD preprocessing algorithm is proposed, which introduces the evaluation function to automatically determine the threshold parameter, so that the baseline removal and denoising effect are more obvious compared with the traditional method. Moreover, the useful information contained in each IMF component can be retained, and the baseline and high-frequency noise generated by the instrument over time can be eliminated. Therefore, the consistency of PPG signals collected on different days can be improved. In order to improve the prediction accuracy, the ensemble modeling strategy is used to assign weights according to the prediction results of each sub-model, and then the prediction results of each sub-model are mapped to the fuzzy operator level for nonlinear integral fusion. This makes the features with large contribution in each sub-model maintain a high weight value in the overall prediction mechanism, reduces the impact of sub-model prediction error on the overall accuracy, decreases the demand for training sample number, and realizes high-precision prediction of small-sample modeling.
The experiment results show that the accuracy of the proposed algorithm is significantly improved compared with each sub-model. In the long-term prediction experiment, the blood glucose detection range of this system is 4.1–10.6 mmol L−1, and the effective detection time is 7 days. All prediction results fall in the interval A and B of the Clarke error grid, and it requires a small calibration sample set with the invasive blood glucose reference values. Therefore, the proposed algorithm shows the promise of future non-invasive home blood glucose detection, and may promote the development of affordable, portable, non-invasive, high-precision, and time-adaptive blood glucose meters. In addition, its applicability is not limited to blood glucose detection, but may be extended to the quantitative detection of blood parameters such as hemoglobin and blood lipids in the future.
Data availability
The datasets used and/or analyzed during the current study are available from the corresponding author upon reasonable request.Author contributions
Methodology: Qingbo Li, Rui Liu; software: Rui Liu, Zhengwei Huang; validation: Qingbo Li, Rui Liu; writing—original draft preparation: Rui Liu; writing—review, and editing: Qingbo Li, Jieqiang Liu; all authors have read and agreed to the published version of the manuscript.Conflicts of interest
The authors declare no competing interests.References
- E. D. Kim, W. D. Kim and J. H. Kim, et al., Impact of glycemic control on residual kidney function and technique failure associated with volume overload in diabetic patients on peritoneal dialysis, Kidney Res. Clin. Pract., 2024 DOI:10.23876/j.krcp.23.251.
- U. Matti and S. Ursula, Towards Individually Tailored Diets in Prevention and Treatment of Diabetes?, Nutrients, 2023, 15(12), 2649 CrossRef PubMed.
- L. J. Lei, C. Zhao and X. F. Zhu, et al., Nonenzymatic Electrochemical Sensor for Wearable Interstitial Fluid Glucose Monitoring, Electroanalysis, 2021, 34(2), 415–422 CrossRef.
- R. M. Bergenstal, D. M. Mullen and E. Strock, et al., Randomized comparison of self-monitored blood glucose (BGM) versus continuous glucose monitoring (CGM) data to optimize glucose control in type 2 diabetes, J. Diabetes Its Complications, 2022, 36(3), 108106 CrossRef PubMed.
- S. H. Lee, M. S. Kim and O. K. Kim, et al., Near-infrared Light Emitting Diode Based Non-invasive Glucose Detection System, J. Nanosci. Nanotechnol., 2019, 19(10), 6187–6191 CrossRef PubMed.
- N. Li, Z. Hang and H. M. Sun, et al., A Noninvasive Accurate Measurement of Blood Glucose Levels with Raman Spectroscopy of Blood in Microvessels, Molecules, 2019, 24(8), 1500 CrossRef PubMed.
- J. Z. Li, J. J. Ma and O. M. Omisore, et al., Noninvasive Blood Glucose Monitoring Using Spatiotemporal ECG and PPG Feature Fusion and Weight-Based Choquet Integral Multimodel Approach, IEEE Trans. Neural Netw. Learn. Syst., 2024, 35(10), 14491–14505 Search PubMed.
- L. A. Castro-Pimentel, A. D. C. Tellez-Anguiano and O. M. Guerra-Alvarado, et al., Non-Invasive Glucose Measurement Using Spectrography In Near Infrared (NIR), IEEE Lat. Am. Trans., 2019, 17(11), 1754–1760 Search PubMed.
- Z. H. Nie, R. Meng and K. Y. Li, Blood glucose prediction based on imagingphotoplethysmography in combination with Machine learning, Biomed. Signal Process. Control., 2023, 79(2), 104179 CrossRef.
- A. Prabha, J. Yadav and A. Rani, et al., Intelligent estimation of blood glucose level using wristband PPG signal and physiological parameters, Biomed. Signal Process. Control., 2022, 78, 103876 CrossRef.
- C. P. L. Alfredo, T.-A. Adriana del Carmen and C.-R. O. Iván, et al., Three-wavelength PPG and support vector machine for non-invasive estimation of blood glucose, Opt. Quantum Electron., 2023, 55, 708 CrossRef.
- Y. Han, X. Liu and N. Zhang, et al., LDCT image denoising algorithm based on two-dimensional variational mode decomposition and dictionary learning, Sci. Rep., 2024, 14(1), 17487 CrossRef CAS.
- D. R. J. Miras, G. A. Casali and M. Massimini, et al., FDI: A MATLAB tool for computing the fractal dimension index of sources reconstructed from EEG data, Comput. Biol. Med., 2024, 179, 108871 CrossRef PubMed.
- A. J. Gómez-García, I. J. Godino-Llorente and G. Castellanos-Dominguez, Non uniform Embedding based on Relevance Analysis with reduced computational complexity: Application to the detection of pathologies from biosignal recordings, Neurocomputing, 2014, 132, 148–158 CrossRef.
- W. Liu, A. Huang and P. Wan, Overcoming Individual Discrepancies, a Learning Model for Non-Invasive Blood Glucose Measurement, Appl. Sci., 2019, 9(1), 192 CrossRef CAS.
- Q. B. Li and Y. H. Wang, Noninvasive Blood Glucose Detection Using an Improved Sparrow Search Algorithm Combined with an Extreme Learning Machine Based on Near-Infrared Spectroscopy, J. Appl. Spectrosc., 2023, 90, 655–660 CrossRef CAS.
- G. Alfian, M. Syafrudin and J. Rhee, et al., Blood Glucose Prediction Model for Type 1 Diabetes based on Extreme Gradient Boosting, IOP Conf. Ser.: Mater. Sci. Eng., 2020, 803(1), 012012 CrossRef CAS.
| This journal is © The Royal Society of Chemistry 2025 |


