 Open Access Article
Creative Commons Attribution 3.0 Unported Licence
Solvothermal synthesis of magnetic CoFe2O4/rGO nanocomposites for highly efficient dye removal in wastewater†
Wenzhu Yin a,
Shuo Haoab and
Huaqiang Cao*a
aDepartment of Chemistry, Tsinghua University, Beijing 100084, P. R. China. E-mail: hqcao@mail.tsinghua.edu.cn
bCollege of Chemistry and Molecular Engineering, Zhengzhou University, Zhengzhou 450001, P. R. China
First published on 16th January 2017
Abstract
Magnetic CoFe2O4/reduced graphene oxide (rGO) (abbreviated as CFG) nanocomposites were fabricated by a simple solvothermal process. The structure and composition of the as-synthesized CFG nanocomposites were investigated by transmission electron microscopy (TEM), vibrating sample magnetometry (VSM), N2 adsorption–desorption isotherms, X-ray diffraction (XRD), X-ray photoelectron spectroscopy (XPS), and Raman spectroscopy. TEM images show that the uniform CoFe2O4 NPs (∼11 nm) are well dispersed on the rGO nanosheets. In addition, CFG has a high surface area (239.76 m2 g−1), exhibits a strong magnetic strength (59.20 emu g−1), and can be easily separated from other constituents under an external magnetic field. When using organic dyes, such as rhodamine B (Rh B), methylene blue (MB), Congo red (CR), methyl orange (MO), and methyl green (MG), as the adsorbates, CFG showed a good adsorption performance, especially, ∼100% for MB within 5 min. The maximum adsorption capacities for Rh B, MB, CR, and MG were 121.8, 93.5, 104.5, and 88.3 mg g−1, respectively. The effect of certain variables, such as temperature, pH of the initial solution, adsorbent dose, and adsorbate species, was studied in detail. All results suggested that CFG can be used as an environmentally friendly and highly efficient reusable adsorbent material with a high adsorption capacity and a fast removal rate that can be used to remove organic dyes from wastewater.
1. Introduction
Organic dyes are widely used in the textile industry because they provide bright colors and exhibit favourable characteristics, such as being easily water-soluble, cheaper to produce, and easier to apply on the fabric. However, when these organic dyes are present in effluents, they are of serious concern because of their adverse effects to human health and environment.1 Therefore, removing these dyes from the industrial effluents has been a major environmental concern in recent years.2 Various methods, such as biological treatment, adsorption, chemical oxidation, photocatalytic degradation, and coagulation, have been used to remove dyes from dye-containing wastewater.3–12 Among these methods, adsorption is a preferred route because of its low-cost, simplicity, and relatively low sludge production.13–15 Therefore, it is very important to develop novel adsorbents with high adsorption capacity and fast separation rates for treating large volumes of wastewater.16–19 Among the processes being proposed and/or developed, graphene-based adsorption is one of the most promising methods owing to the layered structure and high thermal and chemical stability of graphene and because of being highly efficient and less time-consuming.20–23 However, the drawback regarding these methods is the separation of graphene, which limits its further applications.In recent years, the application of magnetic particle technology to solve environmental problems has received considerable attention.24–26 Magnetic separation has been recognized as a fast and effective technique for separating magnetic particles from multicompositions. Cobalt ferrite (CoFe2O4) nanocrystals with spinel structure have attracted significant attention for environmental remediation because of their outstanding properties, such as high saturation magnetization, and size- and shape-dependent magnetic behaviour.27 Although some studies have reported the preparation and adsorption properties of CoFe2O4/graphene nanocomposites, the trivial process of preparation,28 slow removal rate,29 and low adsorption capacities30,31 hinder their applications in industrial wastewater treatment, which still remains a challenging task. In addition, Chen32 et al. reported a one-step method to prepare CoFe2O4–rGO by ball-milling, and the as-prepared CoFe2O4–rGO could be used for organic dye removal by photocatalytic degradation. Although photocatalytic degradation has many advantages, without light, the process of dye degradation can not occur. Furthermore, the photocatalytic degradation is a complex radical reaction, and the by-products may result in secondary pollution. Therefore, designing and tailoring CoFe2O4 hierarchical composite structures could be an appealing choice to address these challenges.
In the present study, cobalt ferrite (CoFe2O4) was immobilized on rGO via a solvothermal route. The as-prepared CoFe2O4/reduced graphene oxide (rGO) (abbreviated as CFG) nanocomposites have a large specific surface area, monodispersity of CoFe2O4 NPs, and are easy to separate under an external magnetic field. This means that CFG is a recyclable adsorbent for dye removal. Note that the adsorption capacities of CFG for dyes (initial dye concentration of 10 μM) are much higher than that of other magnetic adsorbents,33–38 demonstrating that the magnetic CFG nanocomposite is a promising material in the fields of separation/purification-related technologies.
2. Experimental
2.1. Chemicals and reagents
All reagents used in this experiment were of analytical grade and used as received without further purification. Natural graphite flakes with an average particle size of 50 mesh were obtained from Qingdao Tianshengda Graphite Co., Ltd. Potassium permanganate (KMnO4), sodium nitrate (NaNO3), ferric chloride hexahydrate (FeCl3·6H2O), cobalt chloride hexahydrate (CoCl2·6H2O), rhodamine B (Rh B), methyl green (MG), methylene blue (MB), Congo red (CR), and methyl orange (MO) were purchased from Sinopharm chemical reagent Co., Ltd. Sulfuric acid (H2SO4, 99%), hydrochloric acid (HCl), hydrogen peroxide (H2O2, 30%), hydrazine hydrate (N2H4·H2O, 80%), ethylene glycol, and ethanol were supplied by Beijing chemical reagent Co., Ltd. Deionized water (DIW) was obtained using a Milli-Q water purification system (Millipore, Billerica, MA, USA).2.2. Synthesis of the CFG nanocomposites and CoFe2O4 NPs (CFO)
Graphene oxide (GO) was synthesized from natural graphite powder by the modified Hummers method as described hereinafter.39 CFG nanocomposites were synthesized via a solvothermal process described as follows. Typically, 40 mg of GO was dispersed in a 20 mL of ethylene glycol and DIW cosolvent (v/v = 3![[thin space (1/6-em)]](https://www.rsc.org/images/entities/char_2009.gif) :
:![[thin space (1/6-em)]](https://www.rsc.org/images/entities/char_2009.gif) 1) with sonication for 2 h. At the same time, 135 mg of FeCl3·6H2O (0.5 mmol) and 59.5 mg of CoCl2·6H2O (0.25 mmol) were dissolved in 15 mL of DIW. After the GO dispersion was added, the resulting solution was stirred at room temperature for 5 h for the ion exchange. Then, N2H4·H2O (3 mL), which acted as both reducing agent and mineralizer, was added into the GO solution and the mixture was stirred for 0.5 h. The mixture was then transferred to a 50 mL Teflon-lined stainless steel autoclave and heated at 180 °C for 12 h. The product was collected, washed with DIW and absolute ethanol several times, and finally dried at 60 °C for 5 h. Bare CoFe2O4 was also synthesized via a similar route without adding GO.
1) with sonication for 2 h. At the same time, 135 mg of FeCl3·6H2O (0.5 mmol) and 59.5 mg of CoCl2·6H2O (0.25 mmol) were dissolved in 15 mL of DIW. After the GO dispersion was added, the resulting solution was stirred at room temperature for 5 h for the ion exchange. Then, N2H4·H2O (3 mL), which acted as both reducing agent and mineralizer, was added into the GO solution and the mixture was stirred for 0.5 h. The mixture was then transferred to a 50 mL Teflon-lined stainless steel autoclave and heated at 180 °C for 12 h. The product was collected, washed with DIW and absolute ethanol several times, and finally dried at 60 °C for 5 h. Bare CoFe2O4 was also synthesized via a similar route without adding GO.
2.3. Characterizations
XRD spectra (Bruker D8 advance) with Cu Kα radiation (λ = 1.5406 Å, 40 kV, 40 mA) were obtained in the 2 theta range from 5 to 80° for the crystal analysis of the sample. X-ray photoelectron spectroscopy (XPS) was carried out using a 250XI X-ray photoelectron spectrometer with an Al Kα radiation (1486.7 eV) as the excitation source at a base pressure of 1 × 10⁻⁸ Torr. All binding energy values were referenced to the C 1s peak of contaminant carbon at 284.8 eV. Raman spectra were obtained using an inVia-Reflex spectrometer at an excitation wavelength of 633 nm. The microstructure of CFG was analyzed by transmission electron microscopy (TEM, Hitachi H7650B, operating at 80 kV), high-resolution transmission electron microscopy (HRTEM, JEOL JEM-2100F, operating at 200 kV), and scanning electron microscopy (SEM, Hitachi S-3400 N II) coupled with energy-dispersive X-ray spectroscopy (EDX).The specific surface area and the pore-size distribution were determined by N2 adsorption/desorption isotherms at 77 K using a Thermo Fisher Scientific Surfer Gas Adsorption Porosimeter. Before measurements, samples were degassed at 300 °C for 6 h. The specific surface area was calculated using the Brunauer–Emmett–Teller (BET) method based on the adsorption data within the linear relative pressure (P/P0) range of 0.04–0.35. The pore-size distribution was calculated from the corresponding adsorption branch of the N2 isotherm by the Horvath–Kawazoe (HK) method for micropores and the Barrett–Joyner–Halenda (BJH) method for mesopores.
The magnetic properties were determined by vibrating sample magnetometer (VSM, Lakeshore, Model 7300 series). Absorption spectra were obtained using a Perkin Elmer Lambda 35 UV-Vis spectrophotometer.
2.4. Adsorption studies
Adsorption tests were typically carried out by stirring 50 mg of CFG in 200 mL of water solution containing 1 × 10⁻⁵ M organic dye in a 500 mL glass bottle. Experiments were also performed to determine the effects of varying both the adsorbent concentration and pH of the solution. All the experiments were carried out at a constant speed of 200 rpm under magnetic stirring. During each run, aliquots of 0.1 mL were withdrawn from the mixture at regular intervals of time, diluted, and centrifuged for 10 min at 2000 rpm. Subsequently, the absorbance of the supernatant solution was measured. The dye concentration was spectrophotometrically determined using a UV-Vis spectrophotometer and a 1 cm path-length cell to monitor the absorbance at λmax, corresponding to the maximum absorbance of the analyzed dyes. On the basis of the Lambert–Beer's law, the absorbance range was set from 0.1 to 1.0. Calibration curves were plotted to establish the relationship between absorbance and concentration of the standard dye solutions. The pH measurements were performed using a PHS-3E pH meter.2.5. Calculations
The removal (%) of the dyes was defined according to the following equation:| Removal (%) = (1 − C1/C0) × 100% | (1) |
The amount of dye adsorbed by the CFG composite at each time interval t, qt, was calculated by the following mass balance equation:
| qt = (C0 − Ct)V/m | (2) |
3. Results and discussion
3.1. Synthesis mechanism and characterization of the CFG nanocomposites
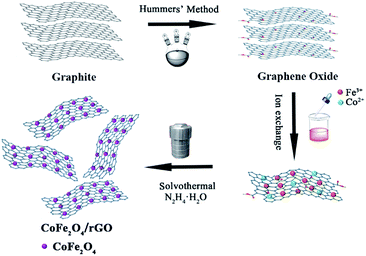
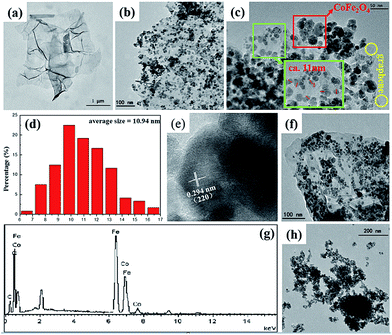
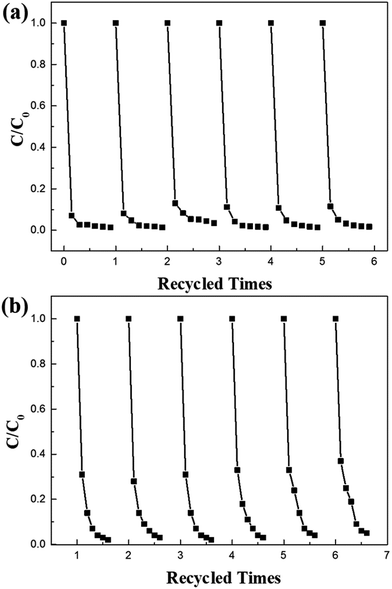
The as-prepared CFG nanocomposites have been synthesized with CoFe2O4 NPs (∼11 nm) anchored on a rGO framework via a solvothermal method (Scheme 1). Fe3+ and Co2+ were supported on the graphene surface via ion exchange. Then, N2H4·H2O not only provides OH− for the formation of Fe(OH)3 and Co(OH)2, but also acts as a reducing regent for reducing GO into rGO. In addition, hydrazine hydrate coordinates with Fe3+ and Co2+ and plays a role of capping reagent to control the growth of CoFe2O4 NPs. Finally, the CoFe2O4 NPs supported on rGO were obtained.The morphology, structure, and composition of the as-prepared CFG nanocomposites were investigated by TEM and EDX. As shown in Fig. 1a, it can be clearly seen that GO displayed a wrinkled paper-like structure of the ultrathin sheets and stacking of the sheets. Furthermore, CoFe2O4 NPs can deposit on the surface of the rGO nanosheet in a dense and orderly manner (Fig. 1b and c) and their size on the CFG nanocomposites are in the range of 6–17 nm, with an average particle size of about 11 nm (Fig. 1d). In addition, we further examined the crystal structure of CoFe2O4 NPs on graphene by HRTEM (Fig. 1e), and the d-spacing was about 0.29 nm, which was attributed to the lattice spacing of the (220) planes of CoFe2O4. When compared with the as-prepared CFG, the size and shape of the CoFe2O4 NPs barely changed and were still firmly attached on the rGO nanosheet after the 6th regeneration cycle (Fig. 1f), indicating that an excellent adhesion between rGO and the CoFe2O4 NPs was achieved. The stability of the CFG structure provides the possibility of recycling. Moreover, the EDX spectrum (Fig. 1g) confirmed the presence of C, Co, Fe, and O in the CFG nanocomposites. Also, the atomic% (Table 1) can further confirm the structure of the CFG nanocomposites. Moreover, the content of CoFe2O4 in the CFG nanocomposites is about 74.6%. Additionally, Fig. 1h shows the TEM images of bare CoFe2O4 (CFO), which was synthesized via a similar route without adding GO. In the absence of GO, the as-prepared CFO easily formed aggregates.
| Element | C | Co | Fe | O |
| Weight (%) | 12.19 | 23.51 | 41.88 | 22.43 |
| Atomic (%) | 28.46 | 11.19 | 21.03 | 39.32 |
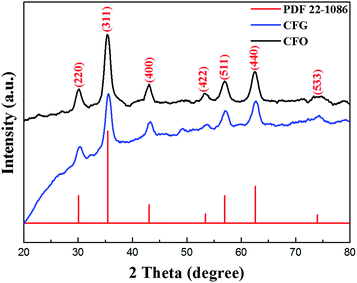
The XRD patterns of the obtained CFO and CFG nanocomposites are shown in Fig. 2. The peaks at 30.2°, 35.6°, 43.2°, 53.7°, 57.1°, 62.6°, and 74.5° are indexed to the characteristic peaks of (220), (311), (440), (422), (511), (440), and (533) planes, respectively. All marked peaks were clearly indexed to the standard cobalt ferrite (CoFe2O4) (PDF 22-1086),40 which is consistent with the EDX spectrum result. Note that no obvious diffraction peaks for rGO can be observed in the CFG nanocomposites, which might be due to the fact that the CoFe2O4 NPs are dispersed on the rGO surface, thus restraining the stacking of graphene layers in the composite.41 According to the Scherrer equation, the average particle size of the CoFe2O4 NPs is about 14.58 nm, which is in good agreement with the value obtained from the TEM image.
Fig. 3a shows the Raman spectra of CFG, GO, and CFO. Curve (i) presents the as-synthesized CoFe2O4 sample at room temperature. Three major Raman active modes with broadening peaks at about 310, 470, and 670 cm−1 can be clearly observed, which are compared with the spectra of some previous reports, showing the specific characteristics (A1g, Eg, 3T2g) of CoFe2O4 ferrite.29 CFG (curve (ii)) and CFO share similar peaks in the frequency range from 250 to 750 cm−1 (about 307, 474, and 654 cm−1), showing the existence of CoFe2O4 NPs in CFG. When compared with CFO, the CFG nanocomposite spectrum exhibits two Raman peaks at 1325 (D band) and 1595 cm−1 (G band), corresponding to graphene. The existence of these two bands in the CFG nanocomposites indicated that the graphene has been incorporated into the nanocomposite. In addition, when compared with GO, the D and G peaks of CFG shifted from 1325 to 1341 cm−1, and from 1595 to 1596 cm−1, indicating that GO has been reduced into rGO.42,43 The peak intensity ratio of the D band (the symmetry A1g mode) and the G band (the E2g mode of sp2 carbon atoms) could sensitively reflect the structural disorder degree of graphene. As a classical architecture with stacked π-conjugation, the precursor GO has an extremely small ID/IG ratio of 1.082. After reducing it with N2H4·H2O, the product CFG had an even higher ID/IG ratio of 1.584, which could be explained by the structural disorder within the material or the intensively reduced size of the in-plane sp2 conjugate domains.44
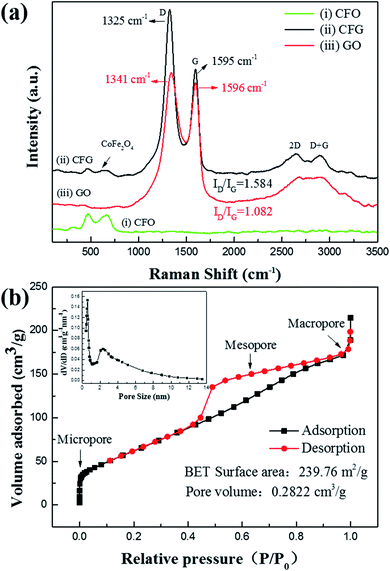 | ||
| Fig. 3 (a) Raman spectra of CFG, CFO, and GO; and (b) nitrogen adsorption–desorption isotherm curves of CFG. Inset of (b) is the pore-size distribution curve for CFG. | ||
The N2 adsorption/desorption isotherm exhibits an atypical IV-type curve with two steep uptakes (P/P0 < 0.01, P/P0 > 0.97) and a hysteresis loop (0.40 < P/P0 < 0.95), indicating the coexistence of micropores (<2 nm), mesopores (2–50 nm), and macropores (>50 nm) (Fig. 3b).45 From the adsorption branch of the isotherm, the specific surface area was 239.76 m2 g−1 and the total pore volume was 0.282 cm3 g−1, calculated by the multipoint Brunauer–Emmett–Teller method. The pore-size distribution is concentrated in the range of a typical mesoporous structure (inset of Fig. 3b) and the most probable pore size is 4.76 nm, which was calculated by the Barrett–Joyner–Halenda model. The large specific surface area of CFG should guarantee its adsorption performance for dyes in water.
XPS measurement was used to study the surface components and the elements valences of the CFG. In this study, CFG nanocomposites were characterized by XPS, and charging of the samples was controlled using a charge neutralizer filament, which were calibrated using the adventitious C 1s peak with a fixed value of 284.8 eV. Fig. 4a shows the characteristic photoelectron peaks of the as-synthesized CFG with scan binding energy (BE) from 200 to 1000 eV, and no additional elements were detected except for the core or outer orbital level photoelectrons and Auger electrons of Fe, Co, C, and O. The high resolution spectrum of the C 1s regions for the identification of surface functionalities are fitted by seven component peaks as shown in Fig. 4b, which are assigned to sp2 carbons (C![[double bond, length as m-dash]](https://www.rsc.org/images/entities/char_e001.gif) C, 284.8 eV), sp3 carbons (285.5 eV), hydroxyl groups (C–OH, 286.0 eV), epoxy and ether groups (C–O, 286.6 eV), carbonyl groups (C
C, 284.8 eV), sp3 carbons (285.5 eV), hydroxyl groups (C–OH, 286.0 eV), epoxy and ether groups (C–O, 286.6 eV), carbonyl groups (C![[double bond, length as m-dash]](https://www.rsc.org/images/entities/char_e001.gif) O, 287.6 eV), carboxyl groups (O–C
O, 287.6 eV), carboxyl groups (O–C![[double bond, length as m-dash]](https://www.rsc.org/images/entities/char_e001.gif) O, 288.7 eV), and π–π* shake-up transitions (289.9 eV). The relative contributions of the components associated with oxygenated and sp3 carbon species in the CFG was significantly lowered, and the overwhelming percentage of graphitic carbon suggested the graphitized nature of the CFG nanocomposites.46 From the Co 2p spectrum, it was found that the first two peaks, with binding energies of about 780.5 and 786.4 eV, correspond to Co 2p3/2 and its shake-up satellites, respectively, whereas the higher binding energy peaks around 795.5 and 802.6 eV were attributed to Co 2p1/2 and its shake-up satellites, respectively. The intense Co 2p3/2 shake-up satellite evidenced the presence of a large number of Co2+ species in the sample because the low-spin Co3+ cation only gave rise to much weaker satellite features than high-spin Co2+ with unpaired valence 3d electron orbitals.47 In addition, two peaks of an Fe 2p level with binding energies of 711.4 and 724.5 eV were assigned to Fe 2p3/2 and Fe 2p1/2, respectively. This result clearly demonstrated the presence of Fe3+. All the abovementioned analyses further confirmed the presence of CoFe2O4 nanocrystals on the surface of graphene nanosheets without any impurities.
O, 288.7 eV), and π–π* shake-up transitions (289.9 eV). The relative contributions of the components associated with oxygenated and sp3 carbon species in the CFG was significantly lowered, and the overwhelming percentage of graphitic carbon suggested the graphitized nature of the CFG nanocomposites.46 From the Co 2p spectrum, it was found that the first two peaks, with binding energies of about 780.5 and 786.4 eV, correspond to Co 2p3/2 and its shake-up satellites, respectively, whereas the higher binding energy peaks around 795.5 and 802.6 eV were attributed to Co 2p1/2 and its shake-up satellites, respectively. The intense Co 2p3/2 shake-up satellite evidenced the presence of a large number of Co2+ species in the sample because the low-spin Co3+ cation only gave rise to much weaker satellite features than high-spin Co2+ with unpaired valence 3d electron orbitals.47 In addition, two peaks of an Fe 2p level with binding energies of 711.4 and 724.5 eV were assigned to Fe 2p3/2 and Fe 2p1/2, respectively. This result clearly demonstrated the presence of Fe3+. All the abovementioned analyses further confirmed the presence of CoFe2O4 nanocrystals on the surface of graphene nanosheets without any impurities.
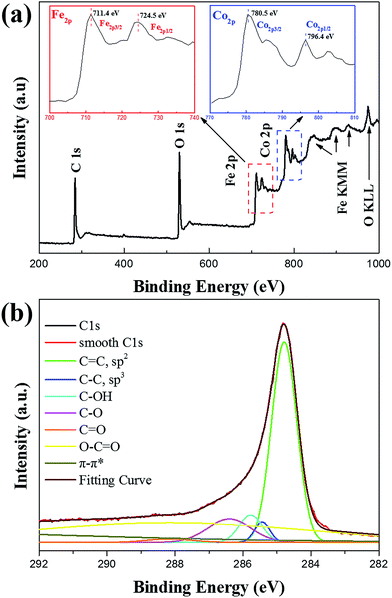 | ||
| Fig. 4 XPS spectra: (a) wide-scan survey of the CFG nanocomposites and (b) C 1s spectrum of the CFG nanocomposites. | ||
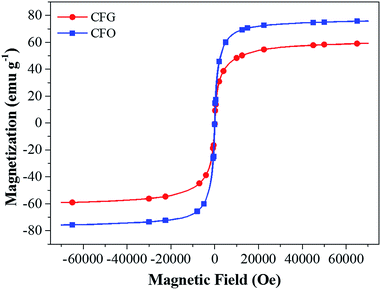
Fig. 5 shows the magnetization curves of the as-prepared CFO and CFG nanocomposites measured at room temperature by VSM. The saturation magnetization (Ms) is 75.86 emu g−1 and 59.20 emu g−1 for the CFO and CFG nanocomposites, respectively. The decrease in the Ms can be attributed to the presence of nonmagnetic graphene. The magnetic property of the as-prepared CFG nanocomposite indicates that as an adsorbent, it can be easily separated from the solution phase within several minutes by inducing an external magnetic field.
3.2. Adsorption properties
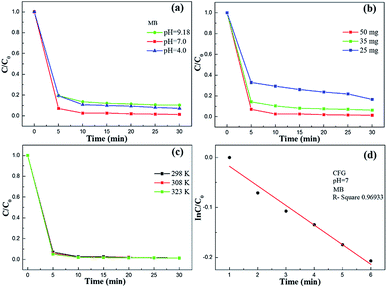
As shown in Fig. 6d, the adsorption process is distinctly consistent with a pseudo first-order kinetics. The linear form of the pseudo first-order rate equation is given as follows:
ln(qe − q) = ln![[thin space (1/6-em)]](https://www.rsc.org/images/entities/char_2009.gif) qe − k1t qe − k1t
| (3) |
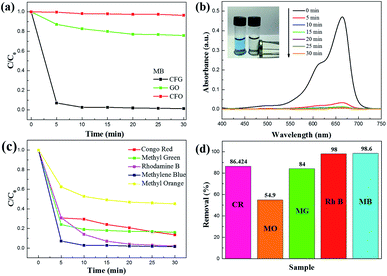
To investigate the adsorption capacity of CFG for MB, we immersed CFG (50 mg) in an aqueous solution of MB (1.0 × 10⁻⁵ M, 200 mL) for 30 min. Note that the adsorption rate of these dyes is independent of the changes in the temperature. A contact time of less than 5 min was invariably sufficient to reach an equilibrium. As shown in Fig. 7b, the adsorption band of the typical MB gradually disappeared with the increasing time, and the color of the solution disappeared after 10 min (inset of Fig. 7b). Similarly, CFG could completely adsorb Rh B within 30 minutes (Fig. S4†).
To investigate the potential application of CFG as an adsorbent for wastewater treatment, we carried out an adsorption experiment for the adsorption of MG, MR, and Rh B by CFG (Fig. 7c). The results of the experiment showed that CFG can also remove MG, MR, and Rh B quickly, and the maximum adsorption amounts of Rh B, MB, CR and MG were 121.8, 93.5, 104.5, and 88.3 mg g−1, respectively. Fig. 7d shows that the removal efficiency of CFG for Rh B, MB, MG, MO, and CR at concentrations of 1.0 × 10⁻⁵ M reach to 98.0%, 98.6%, 84.0%, 54.9% and 86.4%, respectively. These results suggest that the as-prepared CFG nanocomposites show excellent removal performance for these dyes.
4. Conclusions
In summary, the magnetic CFG nanostructures were synthesized via a simple solvothermal process, and the monodispersed CoFe2O4 NPs had a uniform size of about 11 nm. CFG displayed a higher adsorption capacity for MB, MG, Rh B, and CR in water. The results demonstrated that CFG had a high adsorption capacity and high adsorption rate, and could be easily separated under an external magnetic field. The maximum adsorption capacities of CFG for Rh B, MB, CR, and MG were 121.8, 93.5, 104.5, and 88.3 mg g−1, respectively. Furthermore, benefiting from its high saturation magnetization (over 59.20 emu g−1), the as-obtained CFG adsorbent could be easily separated from the solution by a magnet. The magnetic CFG adsorbent could be regenerated and reused for organic dye removal, thus the magnetically separable CFG is a promising material in the fields of separation/purification-related technologies without introducing foreign pollutants.Acknowledgements
This work was jointly supported by the National Program on Key Basic Research Project (973 Program, No. 2013CB933804) and the National Natural Science Foundation of China (No. 21271112, 21231005).Notes and references
- M. Rafatullah, O. Sulaiman, R. Hashim and A. Ahmad, J. Hazard. Mater., 2010, 177, 70–80 CrossRef CAS PubMed
.
- B. D. C. Ventura-camargo and M. A. Marin-morales, Textiles and Light Industrial Science and Technology, 2013, 2, 85–103 Search PubMed
.
- F. C. Wu and R. L. Tseng, J. Hazard. Mater., 2008, 152, 1256–1267 CrossRef CAS PubMed
.
- X. F. Wu, W. Wang, F. Li, S. Khaimanov, N. Tsdaeva and M. Lahoubi, Appl. Surf. Sci., 2016, 389, 1003–1011 CrossRef CAS
.
- S. J. You, B. Liu, Y. F. Gao, Y. Wang, C. Y. Tang, Y. B. Huang and N. Q. Ren, Electrochim. Acta, 2016, 214, 326–335 CrossRef CAS
.
- X. Han, S. Y. Dong, C. F. Yu, Y. Y. Wang, K. Wang and J. H. Sun, J. Alloys Compd., 2016, 685, 997–1007 CrossRef CAS
.
- S. Shukla and M. A. Oturan, Environ. Chem. Lett., 2015, 13, 157–172 CrossRef CAS
.
- H. Zangeneh, A. A. L. Zinatizadeh, M. Habibi, M. Akia and M. H. Isa, J. Ind. Eng. Chem., 2015, 26, 1–36 CrossRef CAS
.
- A. Ahmad, S. H. Mohd-Setapar, C. S. Chuong, A. Khatoon, W. A. Wani, R. Kumar and M. Rafatullah, RSC Adv., 2015, 5, 30801–30818 RSC
.
- H. Du, Z. Wang, Y. H. Chen, Y. Y. Liu, Y. S. Liu, B. J. Li, X. Y. Wang and H. Q. Cao, RSC Adv., 2015, 5, 10033–10039 RSC
.
- Y. Y. Liu, S. M. Wang, C. C. Xin, H. Du, C. X. Du and B. J. Li, ACS Omega, 2016, 1, 491–497 CrossRef CAS
.
- Y. S. Liu, X. Q. Jiang, B. J. Li, X. D. Zhang, T. Z. Liu, X. S. Yan, J. Ding, Q. Cai and J. M. Zhang, J. Mater. Chem. A, 2014, 2, 4264–4269 CAS
.
- T. F. Jiao, Y. Z. Liu, Y. T. Wu, Q. R. Zhang, X. H. Yan, F. M. Gao, A. J. P. Bauer, J. Z. Liu, T. Y. Zeng and B. B. Li, Sci. Rep., 2015, 5, 12415 CrossRef PubMed
.
- L. T. Gibson, Chem. Soc. Rev., 2014, 43, 5173–5182 RSC
.
- M. T. Yagub, T. K. Sen, S. Afroze and H. M. Ang, Adv. Colloid Interface Sci., 2014, 209, 172–184 CrossRef CAS PubMed
.
- V. Suba and G. Rathika, J. Adv. Phys., 2016, 5, 277–294 CrossRef
.
- L. Y. Zhang, W. L. Zhang, Z. Q. Zhou and C. M. Li, J. Colloid Interface Sci., 2016, 476, 200–205 CrossRef CAS PubMed
.
- X. L. Wu, Y. P. Shi, S. X. Zhong, H. J. Lin and J. R. Chen, Appl. Surf. Sci., 2016, 378, 80–86 CrossRef CAS
.
- Y. Qin, L. Wang, C. W. Zhao, D. Chen, Y. H. Ma and W. T. Yang, ACS Appl. Mater. Interfaces, 2016, 8, 16690–16698 CAS
.
- I. Duru, D. Ege and A. R. Kamali, J. Mater. Sci., 2016, 51, 6097–6116 CrossRef CAS
.
- N. U. Yamaguchi, R. Bergamasco and S. Hamoudi, Chem. Eng. J., 2016, 295, 391–402 CrossRef
.
- B. Liang, P. Zhang, J. Q. Wang, J. Qu, L. F. Wang, X. X. Wang, C. F. Guan and K. Pan, Carbon, 2016, 103, 94–100 CrossRef CAS
.
- D. R. Dreyer, S. Park, C. W. Bielawski and R. S. Ruoff, Chem. Soc. Rev., 2010, 39, 228–240 RSC
.
- W. Wang, T. F. Jiao, Q. R. Zhang, X. N. Luo, J. Hu, Y. Chen, Q. M. Peng, X. H. Yan and B. B. Li, RSC Adv., 2015, 5, 56279–56285 RSC
.
- S. S. Gao, L. Liu, Y. K. Tang, D. Z. Jia, Z. B. Zhao and Y. Y. Wang, J. Porous Mater., 2016, 23, 877–884 CrossRef CAS
.
- A. A. Markeb, L. A. Ordosgoitia, A. Alonso, A. Sanchez and X. Font, RSC Adv., 2016, 6, 6913–6917 RSC
.
- N. W. Li, M. B. Zheng, X. F. Chang, G. B. Ji, H. L. Lu, L. P. Xue, L. J. Pan and J. M. Cao, J. Solid State Chem., 2011, 184, 953–958 CrossRef CAS
.
- M. Y. Dong, Q. Lin, D. Chen, X. N. Fu, M. Wang, Q. Z. Wu, X. H. Chen and S. P. Li, RSC Adv., 2013, 3, 11628–11633 RSC
.
- Z. Ding, W. Wang, Y. J. Zhang, F. Li and J. P. Liu, J. Alloys Compd., 2015, 640, 362–370 CrossRef CAS
.
- A. A. Farghali, M. Bahgat, W. M. A. E. Rouby and M. H. Khedr, J. Alloys Compd., 2013, 555, 193–200 CrossRef CAS
.
- N. Dong, F. Z. He, J. L. Xin, Q. Z. Wang, Z. Q. Lei and B. T. Su, Mater. Res. Bull., 2016, 80, 186–190 CrossRef CAS
.
- G. Y. He, J. J. Ding, J. G. Zhang, Q. L. Hao and H. Q. Chen, Ind. Eng. Chem. Res., 2015, 54, 2862–2867 CrossRef CAS
.
- J. C. Xu, P. H. Xin, Y. Q. Gao, B. Hong, H. X. Jin, D. F. Jin, X. L. Peng, L. Li, J. Gong, H. L. Ge and X. Q. Wang, Mater. Chem. Phys., 2014, 147, 915–919 CrossRef CAS
.
- S. W. Yuan and L. Zhao, RSC Adv., 2016, 6, 49769–49776 RSC
.
- J. Ding, B. J. Li, Y. S. Liu, X. S. Yan, S. Zeng, X. D. Zhang, L. F. Hou, Q. Cai and J. M. Zhang, J. Mater. Chem. A, 2015, 3, 832–839 CAS
.
- L. Z. Bai, Z. P. Li, Y. Zhang, T. Wang, R. H. Lu, W. F. Zhou, H. X. Gao and S. B. Zhang, Chem. Eng. J., 2015, 279, 757–766 CrossRef CAS
.
- S. P. Wu, J. C. Huang, C. H. Zhuo, F. Y. Zhang, W. C. Sheng and M. Y. Zhu, J. Inorg. Organomet. Polym. Mater., 2016, 26, 632–639 CrossRef CAS
.
- S. Bai, X. P. Shen, X. Zhong, Y. Liu, G. X. Zhu, X. Xu and K. M. Chen, Carbon, 2012, 50, 2337–2346 CrossRef CAS
.
- W. S. Hummers and R. E. Offeman, J. Am. Chem. Soc., 1958, 80, 1339 CrossRef CAS
.
- M. Moriya, M. Ito, W. Sakamoto and T. Yogo, Cryst. Growth Des., 2009, 9, 1889–1893 CAS
.
- Y. Cao, S. R. Cai, S. C. Fan, W. Q. Hu, M. S. Zheng and Q. F. Dong, Faraday Discuss., 2014, 172, 215–221 CAS
.
- S. Stankovich, D. A. Dikin, R. D. Piner, K. A. Kohlhaas, A. Kleinhammes, Y. Jia, Y. Wu, S. T. Nguyen and R. S. Ruoff, Carbon, 2007, 45, 1558 CrossRef CAS
.
- F. Tuinstra and J. L. Koenig, J. Chem. Phys., 1970, 53, 1126–1130 CrossRef CAS
.
- Q. H. Min, X. X. Zhang, X. Q. Chen, S. Y. Li and J. J. Zhu, Anal. Chem., 2014, 86, 9122–9130 CrossRef CAS PubMed
.
- J. Zhao, H. W. Lai, Z. Y. Lv, Y. F. Jiang, K. Xie, X. Z. Wang, Q. Wu, L. J. Yang, Z. Jin, Y. W. Ma, J. Liu and Z. Hu, Adv. Mater., 2015, 27, 3541–3545 CrossRef CAS PubMed
.
- J. I. Paredes, S. Villar-Rodil, P. Solís-Fernández, A. Martínez-Alonso and J. M. D. Tascón, Langmuir, 2009, 25, 5957–5968 CrossRef CAS PubMed
.
- M. Zong, Y. Huang and N. Zhang, Appl. Surf. Sci., 2015, 345, 272–278 CrossRef CAS
.
- M. Barale, G. Lefevre, F. Carrette, H. Catalette, M. Fedoroff and G. Cote, J. Colloid Interface Sci., 2008, 328, 34–40 CrossRef CAS PubMed
.
- L. Cui, X. Guo, Q. Wei, Y. Wang, L. Gao, L. Yan, T. Yan and B. Du, J. Colloid Interface Sci., 2015, 439, 112–120 CrossRef CAS PubMed
.
Footnote |
| † Electronic supplementary information (ESI) available: C/C0 versus time plots for Rh B solutions at different pH values condition was presented in Fig. S1, pseudo-first-order kinetics for adsorption of Rh B solution (220 mL, 10 μM) at pH = 7 condition was presented in Fig. S2, time-dependent removal of Rh B (220 mL, 10 μM) by CFG, GO and CFO at pH = 7 condition was presented in Fig. S3, time-dependent removal of Rh B by CFG. Inset: the images of absorb Rh B in 0 min (left) and 30 min (right) was presented in Fig. S4. See DOI: 10.1039/c6ra26948f |
| This journal is © The Royal Society of Chemistry 2017 |

