An IrRuOx catalyst supported by oxygen-vacant Ta oxide for the oxygen evolution reaction and proton exchange membrane water electrolysis†
Yanrong
Liu
abc,
Meiqi
Zhang
c,
Cong
Zhang
d,
Honghua
Zhang
c and
Hao
Wang
 *abc
*abc
aBeijing Key Laboratory of Ionic Liquids Clean Process, CAS Key Laboratory of Green Process and Engineering, State Key Laboratory of Multiphase Complex Systems, Institute of Process Engineering, Chinese Academy of Sciences, Beijing 100190, China. E-mail: haowang@ipe.ac.cn
bSchool of Chemical Engineering, University of Chinese Academy of Sciences, Beijing 100049, China
cLongzihu New Energy Laboratory, Zhengzhou Institute of Emerging Industrial Technology, Henan University, Zhengzhou 450000, China
dSINOPEC Research Institute of Petroleum Processing Co., Ltd, Beijing 100083, China
First published on 29th April 2024
Abstract
The sustainable development of proton exchange membrane water electrolysis (PEMWE) requires a dramatic reduction in Ir while maintaining good catalytic activity and stability for the oxygen evolution reaction (OER). Herein, high-surface-area Ta2O5 with abundant oxygen vacancies is synthesized via a facile process, followed by anchoring IrRuOx onto a Ta2O5 support (IrRuOx/Ta2O5). IrRuOx and Ta2O5 work synergistically to afford excellent catalytic performance for the acidic OER. At 0.3 mgIr cm−2, IrRuOx/Ta2O5 only needed an overpotential of 235 mV to deliver 10 mA cm−2 in an acidic half cell and needed a cell potential of 1.91 V to deliver 2 A cm−2 in a PEM water electrolyzer. The characterization results show that doping Ir into RuOx significantly improves the stability and the electrochemically active surface area of RuOx. In IrRuOx/Ta2O5, IrRuOx interacts with Ta2O5 through more electron-rich Ir, indicating strong synergy between the catalyst and the support. The use of a metal oxide support improves the catalyst dispersion, optimizes electronic structures, facilitates mass transport, and stabilizes active sites. This work demonstrates that compositing Ir with less expensive Ru and anchoring catalyst nanoparticles on platinum-group metal (PGM)-free metal oxide supports represents one of the most promising strategies to reduce Ir loading and achieve an activity–stability trade-off. Such a strategy can benefit future catalyst design for other energy storage and conventional processes.
1. Introduction
The development of hydrogen energy is critical for becoming a sustainable society.1 As a raw material and an energy carrier, hydrogen can be used to decarbonize many sectors, such as industry, transportation, and power.2 In hydrogen-driven scenarios, hydrogen production technology lays the foundation for determining whether hydrogen energy can be implemented at large scales.3 Water electrolysis driven by renewable electricity is promising due to its high efficiency and emission-free nature.4 In particular, proton exchange membrane water electrolysis (PEMWE) can produce highly pure hydrogen at a high current density and can work easily with intermittent renewable electricity.5 Unfortunately, the anodic oxygen evolution reaction (OER) of PEMWEs is kinetically sluggish and requires a highly oxidative and acidic environment.6 The current catalyst of choice uses a high loading of Ir, which has a lower crustal reserve than Pt and causes an extremely high cost hurdle for commercialization.7,8 Therefore, reducing the Ir loading while maintaining the OER activity and stability is necessary for the sustainable development of PEMWEs.9–11One popular strategy for developing low-Ir catalysts is alloying with Ru. Although Ru is also a platinum-group metal (PGM), it is much more affordable than Ir. In the acidic OER, Ru is more active but less stable than Ir;12 thus, precisely controlling the IrRu composition can achieve an activity–stability trade-off.13–15 However, carefully designed alloy nanoparticles always agglomerate into large clusters whose surface is unable to fully participate in the OER. To overcome this problem, catalyst supports are often introduced to better disperse nanoparticles and generate catalyst–support interactions to stabilize the active sites.16,17 In particular, the PGM-free support in the anode will significantly reduce the PGM loading, thus improving the competitiveness of the PEMWE cost. Unfortunately, the harsh conditions of the acidic OER make it impossible to use conventional PGM-free supports with good electronic conductivity, such as carbonaceous materials and transition metals.18 These supports will be oxidized or dissolved under working conditions. The dissolved transition metal ions penetrate the membrane under an electric field and block the proton transfer path. Therefore, finding stable and conductive PGM-free supports is quite meaningful but challenging.19,20
A few insightful studies have used Ti-, W-, and Sn-based oxides as PGM-free supports.21–24 These oxides are relatively stable in acids, and the main idea behind using these supports is to construct metal–metal oxide interactions to modify the electronic structures and optimize binding energies with the oxygen intermediates.25,26 Ta oxides are also attractive candidates for exploration due to their tunable electronic structures and excellent stability against corrosion and dissolution.27 Recent studies demonstrated that oxygen-induced Ta2O5![[thin space (1/6-em)]](https://www.rsc.org/images/entities/char_2009.gif) 28 and Fe-doped Ta2O5
28 and Fe-doped Ta2O5![[thin space (1/6-em)]](https://www.rsc.org/images/entities/char_2009.gif) 29 have good OER activity in alkaline media, suggesting that they are active toward water oxidation. In terms of catalyst supports for the acidic OER, Xu and co-workers30 designed an IrO2–Ta2O5 anode and found that different calcination temperatures had a great impact on the exposed crystal plane of IrO2. Amano and co-workers31 coated Ti felt with amorphous IrO2–Ta2O5 layers and found that the acidic OER activity was dependent on the calcination temperature. In a more recent study, Pak and co-workers32 supported Ir with mesoporous Ta2O5 to improve Ir utilization, electronic conductivity, and the electrochemically active surface area. Despite these insightful studies, Ir supported by Ta oxides for the acidic OER still requires an overpotential of 300 mV at 10 mA cm−2 in half cells, and the loading of Ir is still higher than 0.5 mgIr cm−2 to achieve satisfactory single cell performance. Therefore, the potential of the Ta2O5 support to reduce Ir loading and achieve high catalytic activity has not yet been fully demonstrated.
29 have good OER activity in alkaline media, suggesting that they are active toward water oxidation. In terms of catalyst supports for the acidic OER, Xu and co-workers30 designed an IrO2–Ta2O5 anode and found that different calcination temperatures had a great impact on the exposed crystal plane of IrO2. Amano and co-workers31 coated Ti felt with amorphous IrO2–Ta2O5 layers and found that the acidic OER activity was dependent on the calcination temperature. In a more recent study, Pak and co-workers32 supported Ir with mesoporous Ta2O5 to improve Ir utilization, electronic conductivity, and the electrochemically active surface area. Despite these insightful studies, Ir supported by Ta oxides for the acidic OER still requires an overpotential of 300 mV at 10 mA cm−2 in half cells, and the loading of Ir is still higher than 0.5 mgIr cm−2 to achieve satisfactory single cell performance. Therefore, the potential of the Ta2O5 support to reduce Ir loading and achieve high catalytic activity has not yet been fully demonstrated.
Herein, we composited IrRuOx with Ta2O5 to reduce Ir loading and further improved the OER and PEMWE performance. The Ta2O5 support developed in this work was confirmed to be amorphous with a high surface area and a high concentration of oxygen vacancies, and such advantageous structures resulted in uniformly distributed IrRuOx with intimate contact. In the active IrRuOx phase, Ir atoms were doped into RuOx and coupled with Ta to form strong interactions. As tested in half cells, at 0.03 mgIr cm−2, the catalyst needed only a 284 mV overpotential to deliver 10 mA cm−2. By improving to 0.3 mgIr cm−2, IrRuOx only needed an overpotential of 235 mV to deliver 10 mA cm−2 in a half cell and needed a potential of 1.91 V to deliver 2 A cm−2 in a PEM water electrolyzer. The good dispersion of the catalyst with high utilization, the close contact between IrRuOx and Ta2O5, and the modified electronic structures of the active sites are responsible for the enhanced electrochemical performance.
2. Experimental
To synthesize the samples studied in this work, dihydrogen hexachloroiridate(IV) hydrate (H2IrCl6·6H2O, Ir ≥39%) was purchased from Sigma-Aldrich. Tantalum ethoxide (C10H25O5Ta, 99.99%), ruthenium(III) chloride (RuCl3, 99.5%, Ru: 47%), sodium borohydride (NaBH4, ≥95%), ethylene glycol (C2H6O2, >99.5), and tantalum oxide (Ta2O5, 99.99%) were purchased from Adamas-Beta. Ammonium fluoride (NH4F, ≥98.0%) was purchased from Greagent. All chemicals were used as received, without further purification.2.1 Synthesis of Ta2O5
To prepare Ta2O5, 0.3 g of tantalum ethoxide was dissolved in 6 mL of 0.1 M NH4F in ethylene glycol. The resulting solution was mixed with 6 mL of water in an inner Teflon tube under rapid stirring, and the inner Teflon tube was sealed in a stainless-steel autoclave and placed in an oven. The oven was heated to 220 °C, maintained for 20 h, and naturally cooled to room temperature. The precipitate was collected by centrifugation and washed with water 3 times and then with ethanol 3 times to remove the unreacted residues. Ta2O5 powder was finally obtained after vacuum drying at 60 °C for 10 h.2.2 Synthesis of IrRuOx/Ta2O5
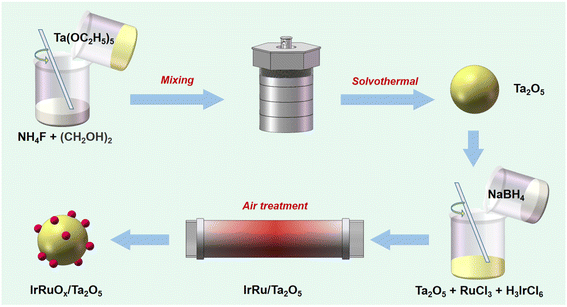
To composite IrRuOx, Ta2O5, RuCl3 hydrate, and H3IrCl6 with a mass ratio of 1/2.07/0.44 were dissolved in 10 mL of water to form solution A. In a subsequent step, 20 mg of NaBH4 was dissolved in 6 mL of ice-cold water to form solution B. Solution B was then added to solution A, and the resulting mixture was magnetically stirred for 6 h at room temperature. After the reaction, the solid sample was collected by centrifugation and washed with water 3 times and then with ethanol 3 times, followed by vacuum drying at 60 °C for 10 h. The IrRuOx/Ta2O5 catalyst was finally obtained after heat treatment in a tube furnace, which was heated to 350 °C and maintained for 2 h under an air atmosphere. The overall process of catalyst synthesis is schematically shown in Scheme 1. For comparison, IrOx/Ta2O5 and RuOx/Ta2O5 were also prepared following the same synthesis procedure except for the addition of only Ru and Ir precursors, respectively. To study the PGM loadings and their impact on the acidic OER, 0.5IrRuOx/Ta2O5 (half Ir and Ru precursors added) and 1.5IrRuOx/Ta2O5 (1.5-fold Ir and Ru precursors added) were also prepared following the same synthesis procedure. The sample-C used in this work refers to a commercially available sample.2.3 Materials characterization
The crystalline structures of the studied samples were examined using an X-ray diffractometer (XRD, Rigaku Co. Ltd, Japan) employing Cu Kα radiation (λ = 1.54056 Å) operated at 40 kV. A JEM-2100F high-resolution field-emission transmission electron microscope (FETEM, JEOL, Japan) and a SIGMA 500/VP scanning electron microscope (Zeiss, Germany) were used to observe the morphology of the samples. X-ray photoelectron spectroscopy (XPS) measurements were conducted on an EscaLab 250Xi spectrometer (Thermo Fisher Scientific, USA), and the spectra were processed by calibrating C 1s to 284.8 eV. The specific surface area was measured by N2 adsorption–desorption at 77 K with an ASAP 2460 gas sorption analyzer (Micromeritics, USA). Bulk oxygen vacancy signals were detected by low temperature electron paramagnetic resonance (EPR, Bruker, EMXplus-6/1, Germany) under liquid nitrogen conditions, and the sample dosage was approximately 10 mg.The experimental details for synchrotron and electrochemical characterization are available in the ESI.†
3. Results and discussion
3.1 Physical characterization of the catalysts
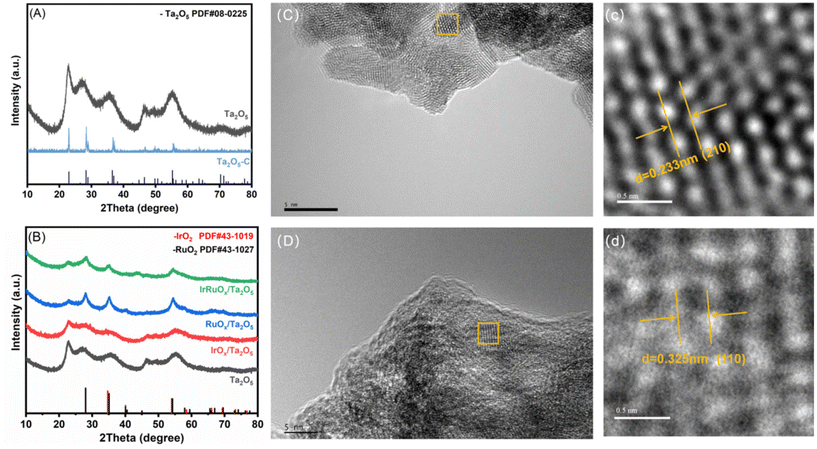
The crystalline structures of the prepared samples were determined by XRD. According to Fig. 1A, the diffraction peaks of the Ta sample developed in this work are indexed to Ta2O5 (JCPDS, PDF no. 08-0225). However, compared with commercial Ta2O5 powder (Ta2O5-C), Ta2O5 has broader diffraction peaks. After integration with the IrRuOx active species (Fig. 1B), all the Ta2O5 peaks were retained, with several new broad peaks emerging at (2θ=) 28.6°, 35.5°, and 54.5°. While IrO2 (JCPDS, PDF no. 43-1019) and RuO2 (JCPDS, PDF no. 43-1027) show similar XRD peak positions, the new peaks on Ta2O5 are closer to those of RuO2, indicating that Ir is doped into the RuOx phase.The morphologies of the studied samples were observed by TEM. The Ta2O5 sample consists of sphere-like particles agglomerated into large clusters (Fig. 1C and Fig. S1, see the ESI†). There are no other notable features on its smooth surface. HRTEM further revealed the (210) lattice plane of Ta2O5 with a lattice spacing of 0.233 nm (Fig. 1c). After introducing the IrRuOx active species, IrRuOx/Ta2O5 showed a bumpy surface, which was caused by IrRuOx growth on the Ta2O5 surface (Fig. 1D). However, no individual well-defined IrRuOx nanoparticles were observed, suggesting a uniform distribution of IrRuOx on the Ta2O5 substrate. HRTEM revealed a lattice spacing of 0.325 nm, which is assigned to the (110) lattice plane of RuO2 but is larger than the standard value of RuO2 (Fig. 1d). This was caused by Ir doping, which slightly expanded the lattice. To determine how the elements were distributed within the IrRuOx/Ta2O5 sample, EDS was performed, and the resulting elemental mapping images are shown in Fig. 2. According to the images, Ta, Ir, Ru, and O are uniformly distributed, and IrRuOx and Ta2O5 are undistinguishable, which is evidence of intimate contact and synergy. Uniform element distributions were also observed for RuOx/Ta2O5 (Fig. S2, see the ESI†) and IrOx/Ta2O5 (Fig. S3, see the ESI†). The atomic ratio of O/Ru/Ta/Ir in IrRuOx/Ta2O5 was determined to be 69.68/16.45/11.75/2.12 by EDS. This ratio was used to determine the catalyst loading on the electrodes.
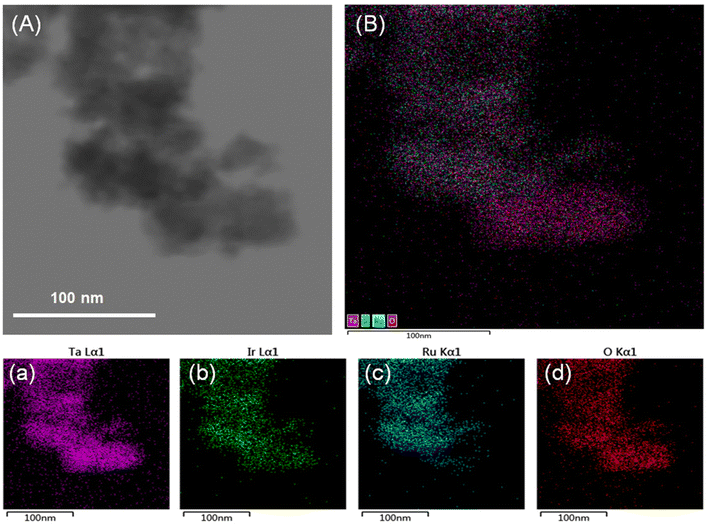 | ||
| Fig. 2 (A) TEM image of the selected area to perform EDS. (B) Element mapping image with all elements overlapped. Individual element mapping of (a) Ta, (b) Ir, (c) Ru, and (d) O. | ||
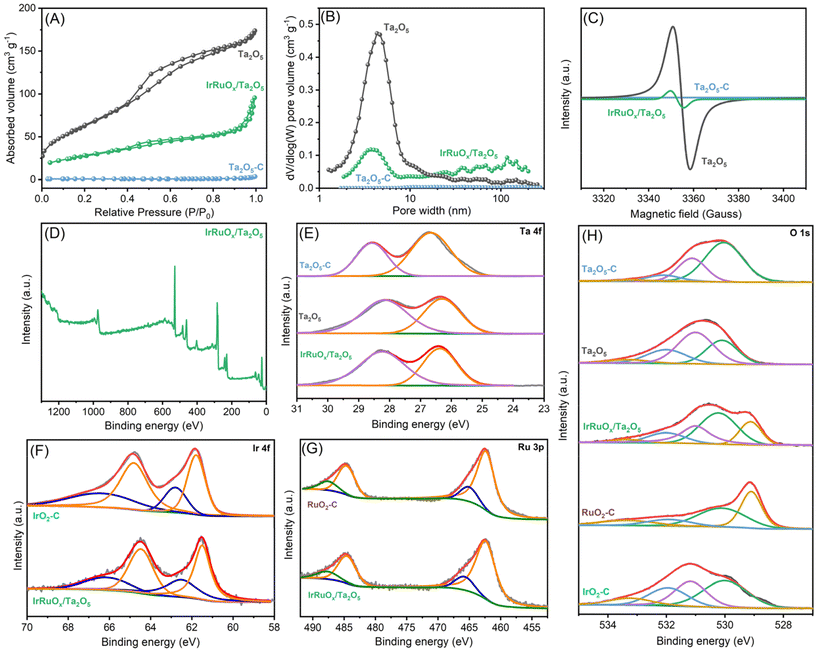
To assess the surface areas and pore structures, the studied samples were tested at 77 K for N2 adsorption–desorption behavior. The resulting isotherms are displayed in Fig. 3A, and the parameters are summarized in Table S1 (see the ESI†). Notably, Ta2O5-C has little N2 adsorption, and its BET surface area was determined to be extremely low at 2.92 m2 g−1. By using the method developed in this work, the as-prepared Ta2O5 showed a much greater N2 uptake, confirming its porous nature, and its BET surface area significantly improved to 231.56 m2 g−1. Such a high surface area is favorable for Ta2O5 to serve as a catalyst support to confine the catalyst size and improve the catalyst dispersion. After integration with IrRuOx, the IrRuOx/Ta2O5 sample shows a decreased BET surface area of 98.18 m2 g−1, suggesting that the IrRuOx nanoparticles are nonporous. Overall, owing to the highly porous Ta2O5 support, IrRuOx/Ta2O5 still possesses a high surface area as an anode catalyst. To determine the pore structures in the studied samples, pore size distributions were plotted as shown in Fig. 3B. Unsurprisingly, Ta2O5-C has no pores. Ta2O5 and IrRuOx/Ta2O5 have pores primarily distributed in widths ranging from 2 to 20 nm and 2 to 7 nm, respectively, confirming that they are both mesoporous. The pore volumes of Ta2O5 and IrRuOx/Ta2O5 were determined to be 0.097 cm3 g−1 and 0.043 cm3 g−1, respectively (Table S1, see the ESI†). IrRuOx/Ta2O5 also shows a small number of macropores with pore widths greater than 50 nm, which results from the stacking of the agglomerates. The abundant hierarchical pores of IrRuOx/Ta2O5 will facilitate mass transport during the PEMWE.33
To gain further insight into the as-prepared Ta2O5 structure, EPR was conducted to examine the Ta–O coordination environment and the unpaired electrons. Ta2O5-C was also tested as a reference. As shown in Fig. 3C, Ta2O5-C shows a flight curve without any EPR response. However, Ta2O5 synthesized in this work has a high signal density, suggesting the existence of a high concentration of oxygen vacancies in Ta2O5. Abundant oxygen vacancies are usually favorable for catalyst growth and often result in interactions between the catalyst and support. Additionally, Ta oxides with oxygen vacancies are more electronically conductive than regular oxygen-saturated Ta2O5.34 After compositing with IrRuOx, the signal intensity decreased, but vacancies were still detectable in IrRuOx/Ta2O5. Since Ta2O5 was fully covered by IrRuOx and underwent air treatment, the remaining oxygen vacancies also originated from IrRuOx clusters due to their high surface-to-volume ratios.35
The surface compositions of the studied samples were examined by XPS, and Ta, Ir, Ru, and O were all detected in the full spectrum of IrRuOx/Ta2O5 (Fig. 3D). The atomic composition obtained by XPS is in good agreement with that obtained by EDS (Table S2, see the ESI†). Fig. 3E shows the deconvoluted Ta 4f spectra and the fitted results for Ta2O5-C, Ta2O5, and IrRuOx/Ta2O5. The Ta 4f spectra for all three samples can be fitted into two peaks, with the one at a lower binding energy assigned to Ta 4f7/2 and the other to Ta 4f5/2.36 Compared to Ta2O5-C, Ta2O5 developed in this work showed lower Ta 4f binding energies, indicating a lower Ta valence in Ta2O5, and the abundant oxygen vacancies in Ta2O5 were responsible for these results, as confirmed by the EPR experiments. After integration with IrRuOx, the Ta 4f spectra of IrRuOx/Ta2O5 retained similar features but showed slightly higher binding energies than those of Ta2O5. This is an indication of interactions between the PGM catalyst and the Ta2O5 support. Fig. 3F shows the deconvoluted Ir 4f spectra and the fitted results for IrRuOx/Ta2O5 and commercial IrO2 (IrO2-C). Even though IrRuOx/Ta2O5 was fully oxidized in air during its preparation, the Ir 4f spectra of IrRuOx/Ta2O5 showed slightly lower binding energies compared to those of Ta2O5, confirming the strong interactions between the PGM catalyst and the Ta2O5 support. It can be concluded that Ir active sites were more electron-rich compared to IrO2-C.32,35 Ir with a lower valence state usually shows better sustainability with higher stability.37Fig. 3G shows the deconvoluted Ru 3p spectra and the fitted results for IrRuOx/Ta2O5 and commercial RuO2 (RuO2-C). These two samples show similar peaks, indicating similar Ru valence states. No binding energy shifts were observed, which was not expected from the Ir results, indicating that interactions mainly occur between Ta and Ir. Fig. S4 (see the ESI†) shows a comparison of the Ru 3d spectra and the fitting results for IrRuOx/Ta2O5 and RuOx/Ta2O5. In the figure, Ru 3d5/2, Ru 3d3/2, and their satellite peaks were observed. The other three peaks are related to carbon species. However, the Ru 3d5/2 and Ru 3d3/2 binding energies of IrRuOx/Ta2O5 were positively shifted (∼0.1 eV) compared to those of RuOx/Ta2O5, suggesting that the Ru in IrRuOx/Ta2O5 had a higher oxidation state. Previous studies have indicated that a higher valence state of Ru is more favorable for the OER.38,39
Since the oxygen electronic structures are critical in this study, we further fitted the deconvoluted O 1s spectra as shown in Fig. 3H, and the resulting parameters are summarized in Table S3 (see the ESI†). To understand the differences between the individual components, Ta2O5-C, IrO2-C, and RuO2-C were also tested as references. The O 1s spectra of Ta2O5-C can be fitted by four peaks centered at 530.0 eV, 531.1 eV, 532.1 eV, and 533.2 eV, which are assigned to lattice O, vacant O, water, and adventitious species, respectively. For the Ta2O5 sample developed in this work, the four peaks still exist with similar positions but different ratios compared to Ta2O5-C. One noticeable feature is that the peak at 531 eV becomes dominant in Ta2O5, which indicates a high concentration of oxygen vacancies on its surface and reconfirms the EPR results. After integration with IrRuOx, the O 1s spectra of IrRuOx/Ta2O5-C can be fitted into five peaks, centered at 529.1 eV, 530.2 eV, 531.0 eV, 532.0 eV, and 533.3 eV. By comparison with the peaks for IrO2-C and RuO2-C, it can be concluded that the peak at 529.1 eV in IrRuOx/Ta2O5-C is assigned to the lattice O of RuO2; the peak at 530.2 eV contains the lattice O of IrO2, Ta2O5, and the hydroxyl species on Ru; and the peak at 531.0 eV still refers to vacant O, as confirmed by EPR. The aforementioned results indicate strong interactions between Ta and Ir, which could be due to the similar binding energies of lattice O in IrO2 and Ta2O5.
To better understand how the loaded active species impacted the Ta2O5 support, we conducted synchrotron X-ray absorption characterization of IrRuOx/Ta2O5. The standard Ta2O5 power sample and the Ta foil were also tested as references. Fig. 4A displays the X-ray absorption near edge structure (XANES) results to show the Ta-L3 edge of the samples. The peak intensity of the white line in the IrRuOx/Ta2O5 catalyst is between Ta (Ta0) and Ta2O5 (TaV), indicating that the average Ta oxidation state of the catalyst is between Ta0 and TaV but closer to TaV. This observation agrees well with the XPS results. The Fourier transform extended X-ray absorption fine structure (EXAFS) spectra are shown in Fig. 4B–D, from which the local coordination environments of Ta can be interpreted. The bond length of Ta–O is 1.53 Å in the standard Ta2O5 sample. However, that length in IrRuOx/Ta2O5 was determined to be 1.46 Å. Similar results were also observed from the wavelet transform EXAFS as shown in Fig. 4E–G. While the coordination number of Ta–O in IrRuOx/Ta2O5 was close to 6 and similar to that in the Ta2O5 standard sample, the difference in the numbers of Ta–O in the first shell and the second shell still suggested different coordination configurations (Table S4, see the ESI†). Therefore, the decrease in the Ta–O bond length in IrRuOx/Ta2O5 was mainly due to the interactions between Ta2O5 and IrRuOx.40
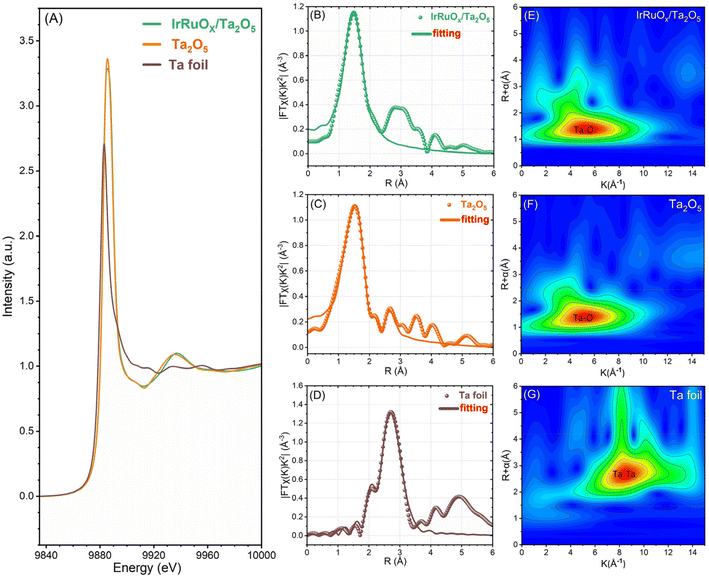 | ||
| Fig. 4 (A) Ta L3-edge XANES spectra. FT-EXAFS spectra of (B) IrRuOx/Ta2O5, (C) standard Ta2O5, and (D) Ta foil. WT-EXAFS spectra of (E) IrRuOx/Ta2O5, (F) standard Ta2O5, and (G) Ta foil. | ||
3.2 Electrochemical evaluation of the catalysts
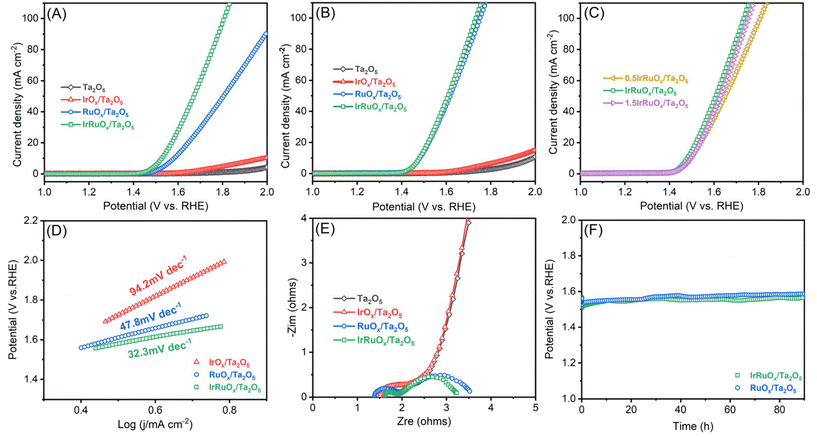
To evaluate the OER catalytic responses of the studied samples, a mixture of the catalyst and ionomer was deposited onto the electrode surface with the catalyst loading precisely controlled. Linear sweep voltammetry (LSV) was first conducted for the electrodes with a total catalyst loading of 0.4 mg cm−2 in 0.5 M H2SO4 (Fig. 5A). Ta2O5 showed negligible OER activity but displayed a slight current improvement after integration with IrOx. However, after integrating with RuOx, the RuOx/Ta2O5 sample had an excellent OER catalytic response and only needed an overpotential of 326 mV to deliver 10 mA cm−2. After integration with both Ir and Ru, the OER catalytic activity of IrRuOx/Ta2O5 significantly increased, and the overpotential decreased to 284 mV at 10 mA cm−2. To understand whether the catalyst loading had a great impact on the catalytic performance, all catalysts with a total catalyst loading of 4 mg cm−2 were also evaluated under the same test conditions. Even at a high total catalyst loading of 4 mg cm−2, the Ir loading of IrRuOx/Ta2O5 was still fairly low (ca. 0.3 mgIr cm−2). According to Fig. 5B, increasing catalyst loading did not help the Ta2O5 and IrOx/Ta2O5 samples but further improved the OER catalytic activity of RuOx/Ta2O5 and IrRuOx/Ta2O5 with overpotentials of 240 mV and 235 mV at 10 mA cm−2, respectively. We also adjusted the catalyst-to-support ratios to understand their impact on the catalytic performance of the OER. The results showed that IrRuOx/Ta2O5 was optimal, and further increasing or decreasing the ratio suppressed the OER activity (Fig. 5C). To understand the OER kinetics, Tafel curves were plotted as shown in Fig. 5D. The Tafel slopes of IrOx/Ta2O5, RuOx/Ta2O5, and IrRuOx/Ta2O5 were determined to be 94.2, 47.8, and 32.3 mV dec−1, respectively, following the same trend as the OER voltammograms. With increasing current, IrRuOx/Ta2O5, which had the smallest Tafel slope, had the smallest overpotential, confirming its excellent OER catalytic activity.The electronic conductivity of the catalyst is critical for maximizing the participation of active sites in the OER. Therefore, the four studied samples were tested by electrochemical impedance spectroscopy (EIS), and the resulting curves are displayed in Fig. 5E. All four curves showed a similar starting point, which refers to the solution and connection resistance, indicating the reliability of the electrochemical testing system. The diameter of the semicircle in the high-frequency zone refers to the charge-transfer resistance of the catalyst. The diameter was the largest for both Ta2O5 and IrOx/Ta2O5, decreased for RuOx/Ta2O5, and the smallest for IrRuOx/Ta2O5. The results suggested that IrRuOx/Ta2O5 possessed the best electronic conductivity, which explained its excellent OER activity and fast kinetics. Adding RuOx or IrRuOx actually decreased the electron transfer resistance of Ta2O5, suggesting that the catalyst was more charge conductive than the support. This also explains why the catalyst and support required an optimal ratio to afford the best catalytic activity (Fig. 5C). To understand how the loaded catalyst impacted the Ta2O5 double layer capacitance (CDL), CV curves were recorded at different scanning speeds, and the results are shown in Fig. S5 (see the ESI†). The CDL of Ta2O5 was determined to be 4.8 mF cm−2, which improved to 56.3 mF cm−2 after integration with IrRuOx, which explains the enhanced OER catalytic performance of IrRuOx/Ta2O5. To understand the OER stability of the samples with and without Ir, chronopotentiometry was conducted at 10 mA cm−2 for RuOx/Ta2O5 and IrRuOx/Ta2O5. According to Fig. 5F, IrRuOx/Ta2O5 maintained stable performance for up to 90 h, and RuOx/Ta2O5 showed a slightly greater performance decay. Both catalysts have reasonable stabilities, benefiting from catalyst–support interactions, in half cells. The IrRuOx/Ta2O5 catalyst developed in this work is among the best-performing Ta-supported catalysts reported in the literature as shown in Table S5 (see the ESI†).
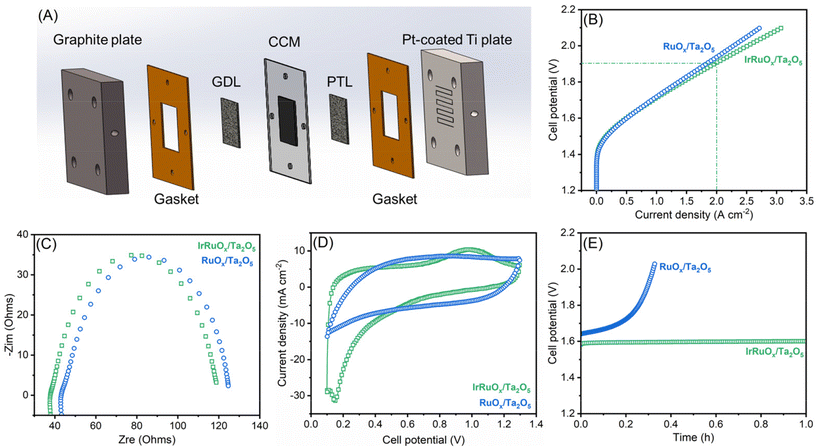
The top two samples of IrRuOx/Ta2O5 and RuOx/Ta2O5 in half-cells were further evaluated in a PEM water electrolyzer. CCM was prepared and assembled with a cathodic gas diffusion layer and an anodic Ti felt porous transport layer, as schematically shown in Fig. 6A, and a photograph of CCM with gaskets is shown in Fig. S6 (see the ESI†). The catalyst loading for IrRuOx/Ta2O5 was 4 mg cm−2 (ca. 0.3 mgIr cm−2); and for 60 wt% Pt/C, the loading was 0.2 mgPt cm−2. The V–I polarization curves were first recorded as shown in Fig. 6B. An electrolyzer with the IrRuOx/Ta2O5 catalyst only needed 1.71 V to deliver 1 A cm−2 and 1.91 V to deliver 2 A cm−2. However, the electrolyzer with the RuOx/Ta2O5 catalyst needed higher cell potentials to deliver 1 A cm−2 (1.72 V) and 2 A cm−2 (1.94 V). Therefore, RuOx/Ta2O5 showed less activity than IrRuOx/Ta2O5, following the trend observed in half-cell tests. By comparing the EIS curves (Fig. 6C), it was found that both samples have a similar starting point and diameter of the semicircle, indicating a similar ohmic resistance in MEAs. The double layer capacitance between the catalyst and ionomer in the catalyst layer is important for enabling the participation of active sites in the OER. To evaluate this, cyclic voltammetry (CV) was conducted for both MEAs, and the resulting voltammograms in Fig. 6D indicate that the doping of Ir in RuOx improved the electrochemically active surface area. The Ir dopants also improved the stability of the catalyst in MEA. Although RuOx/Ta2O5 showed decent stability in a half cell at 10 mA cm−2, it showed a fast performance decay when tested in MEA at 500 mA cm−2 (Fig. 6E).
4. Conclusion
In summary, a Ta2O5 support with an amorphous structure, a high surface area, and a high concentration of surface oxygen vacancies was synthesized by a facile method. After integration with the IrRuOx catalyst, strong interactions were found and they mainly occurred between Ir and Ta, and Ir became more electron-rich. In the IrRuOx active species, the doping of Ir in RuOx improved the electrochemically active surface area and stability of RuOx; therefore, IrRuOx/Ta2O5 outperformed IrOx/Ta2O5 and RuOx/Ta2O5 in catalytic activity and stability. All the components in IrRuOx/Ta2O5 worked synergistically to catalyze the OER so that a high loading of Ir was no longer needed. At 0.3 mgIr cm−2, IrRuOx/Ta2O5 only needed a 235 mV overpotential at 10 mA cm−2 in a half cell and a 1.91 V cell potential at 2 A cm−2 in a PEM water electrolyzer. This work opens up a new avenue for designing PEMWE catalysts supported by PGM-free metal oxides to reduce Ir loading while offering excellent activity and stability.Conflicts of interest
There are no conflicts to declare.Acknowledgements
This work was supported by the National Natural Science Foundation of China (no. 22308356), the Key R&D Program of Henan Province (no. 231111241800), Henan Provincial Science and Technology R&D Program Joint Fund (Advantageous Discipline Cultivation, no. 222301420045), Zhongke Technology Achievement Transfer and Transformation Center of Henan Province (no. 2024147), the Young Elite Scientists Sponsorship Program by CAST (no. 2021QNRC001), and the State Key Laboratory of Catalytic Materials and Reaction Engineering (RIPP, SINOPEC). The authors sincerely thank Prof. Suojiang Zhang (IPE, CAS) for his careful academic guidance and great support.References
- D. Guan, B. Wang, J. Zhang, R. Shi, K. Jiao, L. Li, Y. Wang, B. Xie, Q. Zhang, J. Yu, Y. Zhu, Z. Shao and M. Ni, Energy Environ. Sci., 2023, 16, 4926–4943 RSC.
- A. M. Oliveira, R. R. Beswick and Y. Yan, Curr. Opin. Chem. Eng., 2021, 33, 100701 CrossRef.
- B. Pivovar, N. Rustagi and S. Satyapal, Electrochem. Soc. Interface, 2018, 27, 47 CrossRef CAS.
- D. Yao, L. Gu, B. Zuo, S. Weng, S. Deng and W. Hao, Nanoscale, 2021, 13, 10624–10648 RSC.
- M. Carmo, D. L. Fritz, J. Mergel and D. Stolten, Int. J. Hydrogen Energy, 2013, 38, 4901–4934 CrossRef CAS.
- E. Fabbri and T. J. Schmidt, ACS Catal., 2018, 8, 9765–9774 CrossRef CAS.
- C. Minke, M. Suermann, B. Bensmann and R. Hanke-Rauschenbach, Int. J. Hydrogen Energy, 2021, 46, 23581–23590 CrossRef CAS.
- Z. Lin, T. Wang and Q. Li, Ind. Chem. Mater., 2023, 1, 299–311 RSC.
- K. Ayers, Curr. Opin. Chem. Eng., 2021, 33, 100719 CrossRef.
- M. A. Hubert, L. A. King and T. F. Jaramillo, ACS Energy Lett., 2022, 7, 17–23 CrossRef CAS.
- Y. Lin, Y. Dong, X. Wang and L. Chen, Adv. Mater., 2023, 35, 2210565 CrossRef CAS PubMed.
- D. Escalera-López, S. Czioska, J. Geppert, A. Boubnov, P. Röse, E. Saraçi, U. Krewer, J.-D. Grunwaldt and S. Cherevko, ACS Catal., 2021, 11, 9300–9316 CrossRef.
- J. Xu, J. Li, Z. Lian, A. Araujo, Y. Li, B. Wei, Z. Yu, O. Bondarchuk, I. Amorim, V. Tileli, B. Li and L. Liu, ACS Catal., 2021, 11, 3402–3413 CrossRef CAS.
- J. Zhang, X. Cao, Y.-F. Jiang, S.-F. Hung, W. Liu, H. B. Yang, C.-Q. Xu, D.-S. Li, T. Zhang, Y. Li, J. Li and B. Liu, Chem. Sci., 2022, 13, 12114–12121 RSC.
- Y. Zheng, F. Zhang, G. Wang, D. Lai, L. Zou, Q. Cheng, J. Li, Z. Zou and H. Yang, J. Power Sources, 2022, 528, 231189 CrossRef CAS.
- M. Bernt, A. Hartig-Weiß, M. F. Tovini, H. A. El-Sayed, C. Schramm, J. Schröter, C. Gebauer and H. A. Gasteiger, Chem. Ing. Tech., 2020, 92, 31–39 CrossRef CAS.
- A. S. Pushkarev, I. V. Pushkareva and D. G. Bessarabov, Energy Fuels, 2022, 36, 6613–6625 CrossRef CAS.
- H. Chang, Z. Liang, L. Wang and C. Wang, Nanoscale, 2022, 14, 5639–5656 RSC.
- Z. Shi, X. Wang, J. Ge, C. Liu and W. Xing, Nanoscale, 2020, 12, 13249–13275 RSC.
- Y. Xu, K. Fan, Y. Zou, H. Fu, M. Dong, Y. Dou, Y. Wang, S. Chen, H. Yin, M. Al-Mamun, P. Liu and H. Zhao, Nanoscale, 2021, 13, 20324–20353 RSC.
- S. Zhao, A. Stocks, B. Rasimick, K. More and H. Xu, J. Electrochem. Soc., 2018, 165, F82 CrossRef CAS.
- G. Jiang, H. Yu, Y. Li, D. Yao, J. Chi, S. Sun and Z. Shao, ACS Appl. Mater. Interfaces, 2021, 13, 15073–15082 CrossRef CAS PubMed.
- G. Jiang, H. Yu, D. Yao, Y. Li, J. Chi, H. Zhang and Z. Shao, J. Mater. Chem. A, 2022, 10, 11893–11903 RSC.
- T. L. Doan, H. E. Lee, M. Kim, W. C. Cho, H. S. Cho and T. Kim, J. Power Sources, 2022, 533, 231370 CrossRef CAS.
- J. Cheng, J. Yang, S. Kitano, G. Juhasz, M. Higashi, M. Sadakiyo, K. Kato, S. Yoshioka, T. Sugiyama, M. Yamauchi and N. Nakashima, ACS Catal., 2019, 9, 6974–6986 CrossRef CAS.
- J. Zhang, Q. Zhang and X. Feng, Adv. Mater., 2019, 31, 1808167 CrossRef PubMed.
- C. Han and T. Wang, Energy Fuels, 2023, 37, 13624–13644 CrossRef CAS.
- W. Xiao, X. Huang, W. Song, Y. Yang, T. S. Herng, J. M. Xue, Y. P. Feng and J. Ding, Nano Energy, 2016, 25, 60–67 CrossRef CAS.
- A. Liu, Z. Chen, X. Wei, W. Xiao and J. Ding, MRS Commun., 2017, 7, 563–569 CrossRef CAS.
- W. Xu, G. M. Haarberg, S. Sunde, F. Seland, A. P. Ratvik, E. Zimmerman, T. Shimamune, J. Gustavsson and T. Åkre, J. Electrochem. Soc., 2017, 164, F895 CrossRef CAS.
- F. Amano, Y. Furusho and Y.-M. Hwang, ACS Appl. Energy Mater., 2020, 3, 4531–4538 CrossRef CAS.
- C. Baik, J. Cho, J. I. Cha, Y. Cho, S. S. Jang and C. Pak, J. Power Sources, 2023, 575, 233174 CrossRef CAS.
- J. Islam, B. S. Yoon, P. T. Thien, C. H. Ko and S.-K. Kim, Catal. Today, 2024, 425, 114349 CrossRef CAS.
- Y. Liu, L. Xu, Y. Xin, F. Liu, J. Xuan, M. Guo and T. Duan, J. Electrochem. Soc., 2022, 169, 046516 CrossRef CAS.
- W. Li, J. Lv, D. Liu, W. Cai, X. Chen, Q. Huang, L. Wang and B. Wang, Chem. Mater., 2023, 35, 3892–3901 CrossRef CAS.
- H. Li, Y. Pan, L. Wu, R. He, Z. Qin, S. Luo, L. Yang and J. Zeng, Int. J. Hydrogen Energy, 2023, 48, 26021–26031 CrossRef CAS.
- H.-S. Oh, H. N. Nong, T. Reier, A. Bergmann, M. Gliech, J. Ferreira de Araújo, E. Willinger, R. Schlögl, D. Teschner and P. Strasser, J. Am. Chem. Soc., 2016, 138, 12552–12563 CrossRef CAS PubMed.
- Z. L. Zhao, Q. Wang, X. Huang, Q. Feng, S. Gu, Z. Zhang, H. Xu, L. Zeng, M. Gu and H. Li, Energy Environ. Sci., 2020, 13, 5143–5151 RSC.
- Z.-Y. Wu, F.-Y. Chen, B. Li, S.-W. Yu, Y. Z. Finfrock, D. M. Meira, Q.-Q. Yan, P. Zhu, M.-X. Chen, T.-W. Song, Z. Yin, H.-W. Liang, S. Zhang, G. Wang and H. Wang, Nat. Mater., 2023, 22, 100–108 CrossRef CAS PubMed.
- Y. Wang, H. Meng, M. He and H. Yu, J. Alloys Compd., 2020, 822, 153711 CrossRef CAS.
Footnote |
| † Electronic supplementary information (ESI) available: Synchrotron and electrochemical experimental details, TEM images, element mapping images, BET surface area and pore volume summary, XPS and EDS elemental content summary, XPS O 1s peak summary, XPS Ru 3d fitting results, double layer capacitance, a photograph of CCM with gaskets, and comparison of OER catalytic performance with literature reports. See DOI: https://doi.org/10.1039/d3nr06211b |
| This journal is © The Royal Society of Chemistry 2024 |


