 Open Access Article
Fluorescent labelling as a tool for identifying and quantifying nanoplastics†
P. Merdy *,
A. Bonneau,
F. Delpy and
Y. Lucas
Université de Toulon, Aix Marseille Univ., CNRS, IM2NP, Toulon, France. E-mail: patricia.merdy@univ-tln.fr
First published on 25th November 2024
Abstract
Advancements in microplastic research are progressing rapidly, yet detecting and identifying nanoplastics remain challenging, especially in natural samples. In this study, we addressed these challenges by employing fluorescent labeling on nanoparticles of six prevalent plastic types (PP, LDPE, HDPE, PS, PET, and PVC) to enable their specific detection via the analysis of 3D fluorescence spectra post-staining. Four fluorescent molecules were tested: cyanine-3 phosphoramidite, rhodamine-6G, fluorescein sodium salt, and Vat Red 15. Our observations indicated that adsorption onto nanoplastic particles resulted in peak shifts in the fluorescence signal, providing sufficient specificity for nanoplastic identification. Among the tested fluorophores, fluorescein was the most effective, successfully discriminating PP, PVC, HDPE, LDPE, and PS. Rhodamine-6G produced shifted signals for HDPE, LDPE, and PS but grouped them together. Cyanine-3 effectively distinguished PVC, PS, and PET, while Vat Red was only able to discriminate PVC.
Introduction
Plastics pose a global issue due to their extensive presence in various environmental compartments, such as soil, oceans, and surface water. They originate from diverse sources, mainly related to packaging, building and construction, textiles, consumer products, transportation and electrical–electronics.1 It is estimated that by the end of 2017, 10![[thin space (1/6-em)]](https://www.rsc.org/images/entities/char_2009.gif) 000 million metric tons (Mt) of plastic had been produced, of which 7000 Mt became plastic waste and 5300 Mt was discarded and are now found in landfills, dumps or the natural environment.2
000 million metric tons (Mt) of plastic had been produced, of which 7000 Mt became plastic waste and 5300 Mt was discarded and are now found in landfills, dumps or the natural environment.2
Over time, large plastic objects undergo degradation in the environment, resulting in the formation of smaller debris down to the microscale and nanoscale levels, primarily due to solar UV oxidation, abrasion, and biological degradation. The ecological and health risks related to the dissemination of plastics in the environment are increasingly documented, both in terrestrial and aquatic environments.3 Numerous studies have addressed different aspects of this issue. Some focus on the localization and quantification of plastics with the data stored in databases.4,5 Others investigate extraction procedures, particularly in natural samples; conduct ecotoxicity tests on various organisms such as algae, mussels, copepods, and fishes; and perform physico-chemical experiments to better understand the interactions between plastics and other pollutants like metals, polycyclic aromatic hydrocarbons (PAHs), and polychlorinated biphenyls (PCBs). Additionally, researchers aim to gain insights into the degradation mechanisms. In all of these studies, various techniques, including Fourier transform infrared spectroscopy (FTIR), Raman spectroscopy, and pyrolysis-GC-MS/MS, have been used to identify and quantify plastic particles.6 These techniques have a detection size limit of around 1 μm. Detecting plastic particles smaller than 0.1 mm remains challenging, especially when analyzing environmental samples. Successful approaches have been developed using oxidation techniques to remove natural organic matter (NOM) and densimetric separation to exclude mineral materials from the final sample. These experimental protocols have yielded numerous publications and can be applied to plastic particles larger than 1 μm. However, addressing the nanoscale fraction of plastics is much more complex as it surpasses the capabilities of conventional techniques and protocols. Nevertheless, this nanoscale fraction is of great significance as it is suspected to be the most toxic to smaller organisms as nanoplastics have the ability to penetrate cell membranes.7,8 Consequently, the environmental risk assessment in a given area requires the detection and identification of nanoplastics, even in complex natural environments such as seawater, river water, and sediments, in which many nanometric compounds such as organic matter, clay, biological organisms, and iron oxides coexist.
Fluorescent labelling offers a way for identifying and quantifying nanoplastics. Fluorescent nanoplastics are indeed widely used in medical imaging. Their labelling is achieved by the formation of covalent bonds between a fluorescent molecule and a plastic polymer. Commonly used fluorescent molecules for in vivo imaging include fluorescein isothiocyanate (FITC), indocyanine green (ICG), cyanine-5 (Cy-5), DiR, rhodamine 800, 5-TAMRA, Bodipy 6RG, methylene blue, naphtho-fluorescein, IR-dye800CW, LS479, and IR-783.9 However, the labelling methods require a first step: the introduction of chemical groups such as carboxylic acids, amine, or entities capable of undergoing click reactions onto the polymer backbone. These groups will then react with the dye molecules. Similarly, the dyes themselves must possess at least one functionality that can react with the polymer without affecting their fluorescence properties. Articles discussing the functionalization of plastic materials propose complex chemical reactions, which vary for each type of polymer and that often require drastic conditions like plasma treatment, the use of strong acids (e.g., chromic acids), or the incorporation of fluorescent molecules during polymerization.10–14 Therefore, this type of plastic labelling is inadequate for environmental samples containing various types of polymers. Alternative methods that are less intensive and better suited to the heterogeneous and complex nature of environmental samples are required.
Currently, the most commonly employed method for quantifying microplastic fragments in seawater or sediments is the Nile Red pigment marking method using non-covalent fluorescent labeling.15 This method combines the densimetry approach (using ZnCl2) with fluorescent marking.16 However, it lacks discrimination as Nile Red reacts with all plastic polymers, with the only distinction between plastic types being their varying fluorescence intensity, influenced by factors such as persistent biofilm presence and abrasion. Based on fluorescence intensity, three groups of plastic polymers are proposed:
- strong: unplasticized polyvinyl chloride (uPVC), cellulose acetate (CA), polycarbonate (PC), polyethylene terephthalate (PET), and polymethyl methacrylate (PMMA);
- medium: polyvinyl chloride (PVC), polystyrene (PS), polyamide 6 (PA6), and polyamide 12 (PA12);
- low: low density polyethylene (LDPE), polytetrafluoroethylene (PTFE), high density polyethylene (HDPE), and polypropylene (PP).
The Nile Red fluorescent labeling technique is commonly paired with stereomicroscope observation using epifluorescence. Nile Red pigment emits fluorescence ranging from yellow to dark red, depending on the hydrophobicity of the plastic surface. However, the emitted color can be affected by changes in hydrophobicity caused by environmental surface contamination. To accurately differentiate between plastic types, the incorporation of non-overlapping colorants becomes necessary. Karakolis et al. empirically explored this approach using commercially available pigments such as iDye pink, iDye blue, and Rit DyeMore Kentucky Sky.17 These findings present new possibilities for simultaneously marking plastic polymers with specific dyes. However, the presence of plastic additives, including fillers, plasticizers, flame retardants, colorants, stabilizers, lubricants, foaming agents, and antistatic agents, makes this challenging. Stabilizers can be categorized into various groups based on their specific functions, such as antioxidants, antiozonants, thermal stabilizers, UV stabilizers, and biocides. In the case of PVC or polyethylene (PE), the incorporation of additives, such as Irganox B900 as an antioxidant, during manufacturing can cause fluorescence.18 Therefore, selecting suitable fluorescent markers to differentiate the types of plastics in a natural sample is not a straightforward task. Molenaar et al. (2021)19 successfully labelled PS nanoparticles with Nile Red and employed single particle tracking (SPT) to count and size them, which demonstrated the capability of using this type of technique to detect and quantify nanoplastics.
Finally, a recent article by Liu et al. (2020)20 discussed the top-down synthesis of luminescent microplastics and nanoplastics through the incorporation of upconverting nanoparticles for environmental assessment. The disadvantage of this technique is that it requires the pre-incorporation of dyes in the plastic material during manufacturing.
In this study, we took a step further and conducted a series of tests in an aqueous medium. We used six types of plastics (PP, LDPE, HDPE, PS, PET, and PVC) and four fluorescent molecules (cyanine-3 phosphoramidite, rhodamine-6G, fluorescein sodium salt, and Vat Red 15). These molecules were selected based on their fluorescence properties and potential affinity towards plastic polymers. We then examined the fluorescence signal in 3D to determine if peak shifts could provide sufficient specificity for nanoplastic identification.
Material and methods
Nanoplastic production and analysis
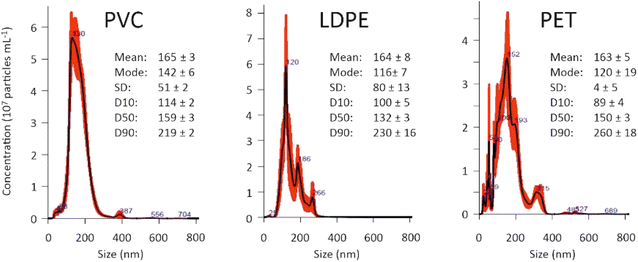
Nanoplastic suspensions were prepared according to the experimental procedure described by Merdy et al.21 Briefly, larger particles were dissolved under reflux in specific solvents: toluene for LDPE, HDPE, PVC, and PP; acetone for PS; and NaOH for PET. After the addition of NaCl and Tween80 as a surfactant, vigorous mechanical stirring was applied to create a microemulsion. Upon cooling, nanoplastic precipitation occurred within the emulsion microdroplets. Two consecutive frontal filtrations were then performed to remove the solvent and surfactant, yielding a water-based suspension of particles ranging in size from 20 nm to 200 nm. The size distribution and concentration of the nanoparticles were determined using Nanoparticle Tracking Analysis (NTA) with a Nanosight NS500 instrument (Fig. 1). This analysis confirmed that the nanoplastic suspensions used in our study contained particles within the desired size range of 20–200 nm, with concentrations ranging from 107 to 108 particles per mL.Labelling procedure
Four fluorescent dyes—cyanine-3, Vat Red 15, rhodamine 6G, and fluorescein sodium salt—were procured from Sigma-Aldrich. Stock solution of each dye was prepared by dissolving the dye in water at a concentration of 1 mg L−1.For each fluorophore and plastic type, two solutions were prepared by successively introducing the fluorophore stock solution, nanoplastic suspension and water into a test tube, in proportions of 500, 200 and 2500 μL, respectively, for solution 1 and 1000, 200 and 2000 μL, respectively, for solution 2. Both solutions had a final volume of 3.2 mL. The test tubes were sealed with stoppers and placed in a water bath at 70 °C for 2 hours. Subsequently, the samples were transferred to sealed tubes and stored at 5 °C until use.
Analysis by molecular fluorescence
The Shimadzu-F6000 spectrometer was used to acquire the 3D fluorescence excitation–emission matrix (EEM). Before conducting sample analysis, the samples underwent dispersion in an ultrasonic bath for 30 minutes. Quartz cells were employed for measuring fluorescence. To completely remove any traces of fluorescent dye from previous experiments, the quartz cells underwent a meticulous washing procedure: first with water, then ethyl acetate, and finally water again. The excitation wavelength ranged from 200 to 500 nm and the emission wavelength from 250 to 600 nm. The scanning process involved a wavelength step of 5 nm for both excitation and emission, and the window slit width was set at 5 nm for emission and 10 nm for excitation. To eliminate interference from Rayleigh and Raman water diffusion bands, the water spectrum was subtracted from the obtained spectra. The absence of fluorescence saturation was verified from solutions 1 and 2 of each fluorophore/plastic type combination by checking the proportionality of the fluorescence intensity with the dye concentration.Results and discussion
Cyanine 3
The 3D fluorescence spectrum of cyanine-3 in solution exhibited three main peaks characterized by their excitation (λex) and emission (λem) wavelengths in nm (Fig. 2). We focused on peaks 1 and 3, as peak 2 was challenging to monitor due to its proximity to the Rayleigh scattering band.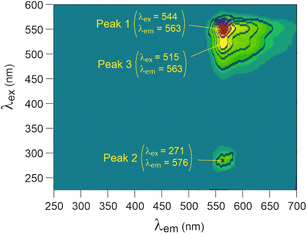 | ||
| Fig. 2 3D fluorescence spectra of cyanine-3 in solution (10 mg L−1), using arbitrary units for intensity. | ||
Neither of these two peaks (1 and 3) showed a shift in the presence of PP, HDPE or LDPE. However, both peaks exhibited significant shifts in the presence of PS, PVC and PET for both λex and λem (Fig. 3).
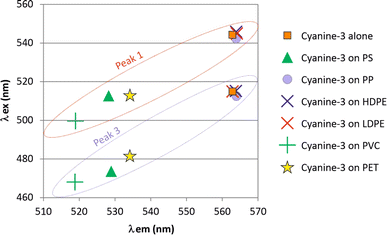 | ||
| Fig. 3 Molecular fluorescence excitation (λex) and emission (λem) wavelength of peaks observed for cyanine-3 alone and that adsorbed on the nanoplastics. | ||
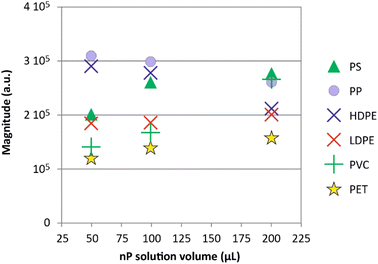
To investigate the correlation between nanoplastic (nP) concentration and fluorescence intensity, samples with increasing nP concentrations in the presence of the fluorescent probe were analyzed using 3D molecular fluorescence. First, it was verified that the excitation and emission wavelengths showed minimal fluctuations with nP concentration: a maximum 3 nm shift for excitation and a maximum 5 nm shift for emission.
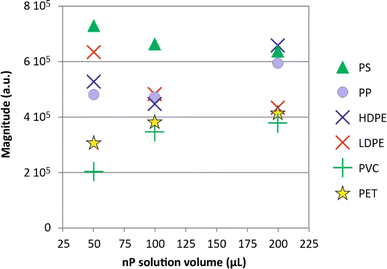
Fig. 4 illustrates the changes in fluorescence intensity for peak 3 with varying quantities of nanoplastics. Unfortunately, under the current experimental conditions, no proportional relationship was found between nP concentration and fluorescence intensity.
Fluorescein
Fluorescein exhibited a 3D fluorescent spectrum with five distinct peaks, as identified in Fig. 5. Our analysis was focused on peaks 1 and 5, which showed the most intense signals at λex and λem wavelengths of 250 and 510 nm and 488 and 515 nm, respectively. When fluorescein was adsorbed onto the nanoplastics, significant shifts of peak 1 excitation wavelength (λex) were observed for PP, PVC, and HDPE (Fig. 6). Additionally, peak 5 emission wavelength (λem) exhibited a small but significant shift for LDPE and PS (λex below 440 nm) compared to the initial fluorescein signal (488 nm). However, fluorescein was unable to differentiate PET.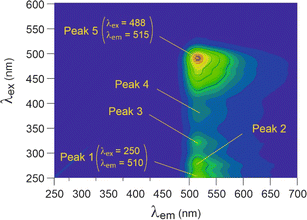 | ||
| Fig. 5 3D fluorescence spectra of fluorescein in solution (10 mg L−1), using arbitrary units for intensity. | ||
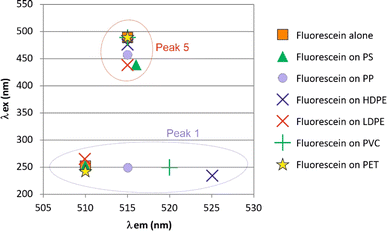 | ||
| Fig. 6 Molecular fluorescence excitation (λex) and emission (λem) wavelengths of peaks observed for fluorescein alone and that adsorbed on the nanoplastics. | ||
The characteristic wavelengths of the peaks showed minor variations with the quantity of nP. Specifically, there was a maximum shift of 9 nm for excitation (ranging from 479 to 486 nm) and a maximum shift of 2 nm for emission (ranging from 515 to 517 nm). Similar to the results with cyanine-3, no proportional relationship was found between nP concentration and fluorescence intensity under the current experimental conditions (Fig. 7).
Rhodamine-6G
The 3D fluorescent spectrum of rhodamine-6G is shown in Fig. 8, with a focus on the main peaks emitting around 550 nm. After contact with the nanoplastics (Fig. 9), rhodamine-6G exhibited shifted signals that clustered closely together for HDPE, LDPE, and PS, making it difficult to distinguish between these three plastics, although they are clearly distinct from the fluorophore alone. PVC and PP had emission and excitation wavelengths close to those of the fluorophore alone, preventing their differentiation from the fluorophore.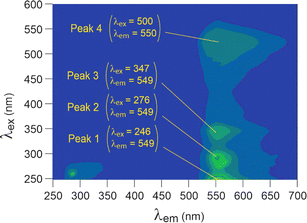 | ||
| Fig. 8 3D fluorescence spectra of rhodamine-6G in solution (10 mg L−1), using arbitrary units for intensity. | ||
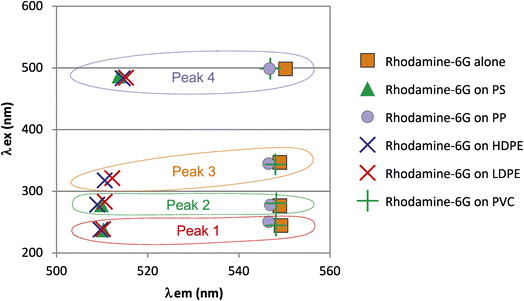 | ||
| Fig. 9 Molecular fluorescence excitation (λex) and emission (λem) wavelengths of peaks observed for rhodamine-6G alone and that adsorbed on the nanoplastics. | ||
Vat Red
The 3D fluorescence spectra of Vat Red (Fig. 10) exhibited two peaks that showed slight shifts in signals when in contact with all nanoplastic types, except for PVC, which induced a significant shift in the excitation wavelength (λex) of peak 1 (Fig. 11).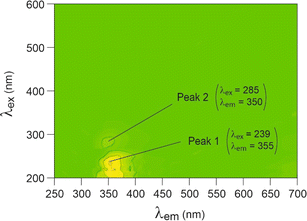 | ||
| Fig. 10 3D fluorescence spectra of Vat Red in solution (10 mg L−1), using arbitrary units for intensity. | ||
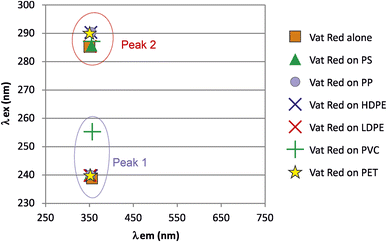 | ||
| Fig. 11 Molecular fluorescence excitation (λex) and emission (λem) wavelengths of peaks observed for Vat Red alone and that adsorbed on the nanoplastics. | ||
Dye adsorption and fluorescence peak shift and intensity
The shift in fluorescence peaks upon adsorption onto polymers can be attributed to alterations in the local microenvironment of the fluorescent dye, which affect the orientation and conformation of the adsorbed molecule. This can result in changes in intermolecular vibronic interactions,22–24 intramolecular electron density redistribution (internal Stark effect),25 or energy transfer between coupled molecules,26 leading to a shift in the fluorescence peaks.In our observations, the most significant shifts occurred approximately parallel to the line (λex = λem), resulting in only minor modifications to the Stokes shift of the fluorescence (Fig. 12). However, the shift direction and magnitude varied among dyes. Cyanine and rhodamine exhibited hypsochromic shifts (towards shorter wavelengths), whereas fluorescein and Vat Red displayed bathochromic shifts (towards longer wavelengths).
 | ||
| Fig. 12 Direction of variation of the shift of fluorescence peaks of dyes after adsorption on nanoparticles. | ||
The non-linear relationship between nanoplastic (nP) concentration and fluorescence intensity can be attributed to several mechanisms. A simple reduction in the quantum yield of the adsorbed fluorophore compared to the solvated fluorophore could explain this observation. Alternatively, more complex mechanisms could be involved if the analyzed peak is a composite of two neighboring peaks. Adsorption mechanisms may vary depending on the polymer and environmental conditions, including hydrophobicity, van der Waals bonding, hydrogen bonds, π–π bonds, and electrostatic interactions.27,28 Notably, for all the dyes studied, the direction of the peak shift was consistent regardless of the polymer, although the intensity of the shift varied from one polymer to another. This suggests a common underlying mechanism for a given dye.
Cyanine-3 exhibits a negative solvatochromism corresponding to a hypsochromic shift.29 Over a concentration ranging from 10−3 to 10−6, cyanine dyes undergo a hypsochromic dimerization.30 One might expect that adsorption would reverse these variations that turned out to be bathochromic, but this is not what was observed.
Fluorescein exhibits a hypsochromic shift with increasing hydrogen bonding in its environment.31 Therefore, when the dye, dissolved in an aqueous solvent, absorbs onto a hydrogen-rich surface, a shift can be expected. However, the direction of this shift cannot be predicted beforehand. Fluorescein fluorescence, however, can be quenched when adsorbed on a hydrophobic polymer surface because of energy transfer in regular 2D arrangement derived from self-organization.32
Rhodamine-6-G, like fluorescein, exhibits hypsochromic shift with an increasing hydrogen bonding environment.33 It exhibits a bathochromic shift when adsorbed onto a thin polymer film [poly(methyl methacrylate)] because of the formation of homoaggregates and significant quenching when adsorption increases.34 A similar behaviour is observed after adsorption on mineral surfaces.35 In water, dimers form with a bathochromic shift when the Rhodamine-6-G concentration is greater than 30 μM, and quenching due to collisional mechanisms occurs at concentrations greater than 60 μM.36
To our knowledge, there are no studies on fluorescence variations of Vat Red depending on its chemical environment.
In future studies, the effect of the curvature of nanoplastics on adsorption should be taken into account, as has been shown for organic compounds.37 Elucidating the precise mechanism(s) at play will necessitate further investigations, particularly by ensuring the complete removal of residual free fluorophores through ultrafiltration.
Conclusion
The data presented indicate that the adsorption of fluorescent molecules onto nanoplastics can cause significant shifts in the emission and/or excitation wavelengths of these molecules' fluorescence peaks. These shifts are specific to the type of plastic, enabling its identification. Among the four fluorescent molecules tested on six types of nanoplastics (PS, PP, HDPE, LDPE, PVC, and PET), fluorescein was the most discriminating. Its peak shifts allowed for the differentiation of PP, PVC, HDPE, LDPE, and PS. Cyanine-3 enabled the discrimination between PS, PVC, and PET. Rhodamine-6G showed shifted signals for HDPE, LDPE, and PS, but the signals remained too clustered to differentiate between these plastics. Vat Red only differentiated PVC.Under our current experimental conditions, we have not yet achieved proportionality between nanoplastic (nP) concentration and fluorescence intensity, which is necessary to quantify nP from these molecular fluorescence spectra. Experimental conditions need to be optimized to achieve this goal. One potential research direction is to establish the relationship between dye concentration, number of nanoparticles, and fluorescence intensity. In future studies, mixing different types of nanoplastics and observing if they can still be identified when labeled with one of the best labeling fluorophores will be essential. This procedure can then be tested on environmental samples. Kinetics of labeling, variation in temperature, and monitoring the fluorescence intensity during the labeling experiment are additional prospective work to develop as well.
The proposed methodology has the potential to expand the scope of scientific research on nanoplastics. Our method can be used to observe the differences in the behavior of various types of nanoplastics in interaction experiments with living organisms or under simulated environmental conditions. It can also be applied to environmental samples following pretreatment steps, such as the oxidation of natural organic matter to suppress its fluorescence. Finally, our study paves the way for the development of specialized instruments for the identification of nanoplastics.
Data availability
The data supporting this article have been included as ESI.†Conflicts of interest
The authors declare that they have no known competing financial interests or personal relationships that could have appeared to influence the work reported in this paper.Acknowledgements
Agence de l'Eau AERMC (Water Agency of Rhône Mediterranée Corse) and Veolia Foundation financed this project. We would like to thank in particular Pierre Boissery (AERMC), Emmanuel Plessis, Gilles Baratto and Marie-Pierre Denieul (Véolia) for their support in the global project Meditplast.References
- R. Geyer, J. R. Jambeck and K. L. Law, Production, use, and fate of all plastics ever made, Sci. Adv., 2017, 3, 1700782 CrossRef PubMed
.
- R. Geyer, Production, use, and fate of synthetic polymers, in Plastic Waste and Recycling, Academic Press, 2020, pp. 13–32 Search PubMed
.
- S. Saud, A. Yang, Z. Jiang, D. Ning and S. Fahad, New insights into the environmental behavior and ecological toxicity of microplastics, J. Hazard. Mater. Adv., 2023, 10, 100298 CrossRef CAS
.
- M. A. Browne, P. Crump, S. J. Niven, E. Teuten, A. Tonkin, T. Galloway and R. Thompson, Accumulation of microplastic on shorelines worldwide: sources and sinks, Environ. Sci. Technol., 2011, 45, 9175–9179 CrossRef CAS PubMed
.
- R. Thompson, Y. Olsen, R. P. Mitchell, A. Davis, S. J. Rowland, A. W. G. John, D. McGonigle and A. E. Russell, Lost at sea: Where is all the plastic?, Science, 2004, 304, 83 CrossRef PubMed
.
- N. P. Ivleva, Chemical Analysis of Microplastics and Nanoplastics: Challenges, Advanced Methods, and Perspectives, Chem. Rev., 2021, 121, 11886–11936 CrossRef CAS PubMed
.
- A. Banerjee and W. L. Shelver, Micro- and nanoplastic induced cellular toxicity in mammals: a review, Sci. Total Environ., 2021, 755, 142518 CrossRef CAS PubMed
.
- T. Kögel, O. Bjoroy, B. Toto, A. M. Bienfait and M. Sanden, Micro- and nanoplastic toxicity on aquatic life: determining factors, Sci. Total Environ., 2020, 709, 136050 CrossRef PubMed
.
- A. Vollrath, S. Schubert and U. S. Schubert, Fluorescence imaging of cancer tissue based on metal-free polymeric nanoparticles – a review, J. Mater. Chem. B, 2013, 1, 1994–2007 RSC
.
- M. Hennecke, I. Schneider and J. Fuhrmann, Characterization of carboxylate sites in surface oxidized polyethylene films by fluorescence techniques, Eur. Polym. J., 1986, 22, 949–953 CrossRef CAS
.
- D. W. Fong, Tagged polymers and their synthesis by post-polymerization (trans)amidation reaction, European Patent, 95102339.9, 1995
.
- K. Aslan, P. Holley and C. D. Geddes, Metal-enhanced fluorescence from silver nanoparticle-deposited polycarbonate substrates, J. Mater. Chem., 2006, 16, 2846–2852 RSC
.
- M. Beija, M.-T. Charreyre and J. M. G. Martinho, Dye-labelled polymer chains at specific sites: synthesis by living/controlled polymerization, Prog. Polym. Sci., 2011, 36, 568–602 CrossRef CAS
.
- A. Reisch and A. S. Klymchenko, Fluorescent Polymer Nanoparticles Based on Dyes: Seeking Brighter Tools for Bioimaging, Small, 2016, 12, 1968–1992 CrossRef CAS PubMed
.
- T. Maes, R. Jessop, N. Wellner, K. Haupt and A. G. Mayes, A rapid-screening approach to detect and quantify microplastics based on fluorescent tagging with Nile Red, Sci. Rep., 2017, 7, 44501 CrossRef CAS PubMed
, https://www.nature.com/scientificreports.
- H. K. Imhof, J. Schmid, R. Niessner, N. P. Ivleva and C. Laforsch, A novel, highly efficient method for the separation and quantification of plastic particles in sediments of aquatic environments, Limnol. Oceanogr.: Methods, 2012, 10, 524–537 CrossRef CAS
.
- E. G. Karakolis, B. Nguyen, J. B. You, C. M. Rochman and D. Sinton, Fluorescent Dyes for Visualizing Microplastic Particles and Fibers in Laboratory-Based Studies, Environ. Sci. Technol. Lett., 2019, 6, 334–340 CrossRef CAS
.
- A. Arenas, F. R. Beltrán, V. Alcázar, M. U. de la Orden and J. Martínez Urreaga, Fluorescence labeling of high density polyethylene for identification and separation of selected containers in plastics waste streams. Comparison of thermal and photochemical stability of different fluorescent tracers, Mater. Today Commun., 2017, 12, 125–132 CrossRef
.
- R. Molenaar, S. Chatterjee, B. Kamphuis, I. M. Segers-Nolten, M. M. Claessens and C. Blum, Nanoplastic sizes and numbers: quantification by single particle tracking, Environ.
Sci.: Nano, 2021, 8, 723–730 RSC
.
- B. Liu, J. Zhuang and G. Wei, Recent advances in the design of colorimetric sensors for environmental monitoring, Environ. Sci.: Nano, 2020, 7, 2195–2213 RSC
.
- P. Merdy, F. Delpy, A. Bonneau, S. Villain, L. Iordachescu, J. Vollertsen and Y. Lucas, Nanoplastic production procedure for scientific purpose: PP, PVC, PE-LD, PE-HD and PS, Heliyon, 2023, 9, 183872023 CrossRef
.
- K. Char, C. W. Frank and A. P. Gast, Fluorescence studies of polymer adsorption. 3. Adsorption of pyrene-end-labeled poly (ethylene glycol) on colloidal polystyrene particles, Langmuir, 1989, 5, 1335–1340 CrossRef CAS
.
- B.-K. An, S.-K. Kwon, S.-D. Jung and S. Y. Park, Enhanced Emission and Its Switching in Fluorescent Organic Nanoparticles, J. Am. Chem. Soc., 2002, 124, 14410–14415 CrossRef CAS PubMed
.
- J. Kerfoot, V. V. Korolkov, A. S. Nizovtsev, R. Jones, T. Taniguchi, K. Watanabe and P. H. Beton, Substrate-induced shifts and screening in the fluorescence spectra of supramolecular adsorbed organic monolayers, J. Chem. Phys., 2018, 149, 5 CrossRef PubMed
.
- J. T. Vivian and P. R. Callis, Mechanisms of tryptophan fluorescence shifts in proteins, Biophys. J., 2019, 80, 2093–2109 CrossRef PubMed
.
- H. Imada, K. Miwa, M. Imai-Imada, S. Kawahara, K. Kimura and Y. Kim, Real-space investigation of energy transfer in heterogeneous molecular dimers, Nature, 2016, 538(7625), 364–367 CrossRef CAS PubMed
.
- O. D. Agboola and N. U. Benson, Physisorption and chemisorption mechanisms influencing micro (nano) plastics-organic chemical contaminants interactions: a review, Front. Environ. Sci., 2021, 9, 678574 CrossRef
.
- V. A. Tikhomirov, A. V. Odinokov, A. A. Bagatur'yants and M. V. Alfimov, Modeling the surface of polystyrene and the adsorption of dye molecules on this surface, Theor. Exp. Chem., 2011, 46, 342–349 CrossRef CAS
.
- A. C. Yu, C. A. Tolbert, D. A. Farrow and D. M. Jonas, Solvatochromism and solvation dynamics of structurally related cyanine dyes, J. Phys. Chem. A, 2002, 106, 9407–9419 CrossRef
.
- W. West and S. Pearce, The dimeric state of cyanine dyes, J. Phys. Chem., 1965, 69, 1894–1903 CrossRef CAS
.
- N. Klonis, A. H. A. Clayton, E. W. Voss and W. H. Sawyer, Spectral Properties of Fluorescein in Solvent-Water Mixtures: Applications as a Probe of Hydrogen Bonding Environments in Biological Systems, J. Photochem. Photobiol., 1998, 67, 500–510 CAS
.
- K. Mitsuya, S. Goto, Y. Kurosawa, H. Yokoyama and T. Hanawa, Fluorescence changes of dyes/NSAIDs adsorbed on fluorocarbon polymers, Mater. Chem. Phys., 2022, 290, 126552 CrossRef CAS
.
- D. A. Hinckley, P. G. Seybold and D. P. Borris, Solvatochromism and thermochromism of rhodamine solutions, Spectrochim. Acta Part A, 1986, 42, 747–754 CrossRef
.
- M. Chapman, N. Chapman and W. B. Euler, Interfacial effects of the photophysics of rhodamine 6G Ultra-Thin Films on a Poly(methylmethacrylate) Surface, J. Phys. Chem. C, 2022, 126, 8938–8946 CrossRef CAS
.
- V. Martínez Martínez, F. López Arbeloa, J. Bañuelos Prieto and I. López Arbeloa, Characterization of rhodamine 6G aggregates intercalated in solid thin films of laponite clay. 2 Fluorescence spectroscopy, J. Phys. Chem. B, 2005, 109, 7443–7450 CrossRef
.
- M. Barzan and F. Hajiesmaeilbaigi, Investigation the concentration effect on the absorption and fluorescence properties of Rhodamine 6G dye, Optik, 2018, 159, 157–161 CrossRef CAS
.
- Z. Zhao, J. Yao, H. Li, J. Lan, H. Hollert and X. Zhao, Interaction of polystyrene nanoplastics and hemoglobin is determined by both particle curvature and available surface area, Sci. Total Environ., 2023, 899, 165617 CrossRef CAS PubMed
.
Footnote |
| † Electronic supplementary information (ESI) available. See DOI: https://doi.org/10.1039/d4ra04526b |
| This journal is © The Royal Society of Chemistry 2024 |

