 Open Access Article
Titania nanotubes modified with copper enhance osteogenic differentiation of adipose derived stem cells
Aniruddha Vijay
Savargaonkar
 *a,
Liszt Coutinho
Madruga
b,
Amit H.
Munshi
 a and
Ketul C.
Popat
 ab
ab
aDepartment of Mechanical Engineering, Colorado State University, Fort Collins, CO 80523, USA. E-mail: ketul.popat@colostate.edu
bDepartment of Bioengineering, George Mason University, Fairfax, VA 22030, USA. E-mail: kpopat@gmu.edu
First published on 29th October 2024
Abstract
To achieve long term success of orthopedic implants, it is critical to have a successful integration of bone and implant material. To accomplish this, various surface modifications have been investigated in research. Even though titania nanotubes and copper have individually demonstrated successful stem cell adhesion, proliferation and differentiation, these modifications have not yet been investigated together. In this study, we fabricated copper-modified titania nanotubes and evaluated the adhesion, proliferation and osteogenic differentiation of adipose derived stem cells on these surfaces. Implant surfaces also have to interact with blood after insertion in the body. Several studies have shown the importance of blood clots on material surfaces and their influence in differentiation of cells. Hence, blood clotting properties of modified surfaces were also investigated through whole blood clotting, and platelet adhesion and activation. The copper-modified titania nanotube surfaces demonstrated increased differentiation of adipose derived stem cells towards osteogenic lineage as well as enhanced blood clotting properties, thus they can be used as a potential surface for orthopedic implants.
1. Introduction
Due to their excellent biocompatibility, good corrosion resistance, inertness and high specific strength, titanium and its alloys have been established as a gold standard for orthopedic biomaterials.1–3 Titanium, when exposed to air or water forms an oxide layer that is inert and prevents further corrosion making it as an ideal choice for orthopedic implants. It is important for these implants to integrate appropriately with the living bone as this will determine their long-term success. However, their inertness sometimes inhibits sufficient osseointegration that can lead to failure and formation of fibrous tissue around the implant.4 Osseointegration is the structural and functional connection between living bone and the loading surface of the implant.5 Several surface modification strategies have been explored including but not limited to modifying the surface chemistry, and/or surface topography to enhance osseointegration.6–9 As bone has a hierarchical structure that ranges from the micro- to the nanoscale, a multi-scale structure has shown greater promise as it is biomimetic and provides a favorable environment for growth and differentiation of mesenchymal stem cells as well as enables nutrient transport.10 Hence, different nanoscale topographies have been investigated, such as nanowires, nanotubes, nanoflowers, nanorods, and nanoribbons11–15 at the nano scale, as well as microscale topographies such as honeycomb-shape, parallel groove formation, and micro-pits.16–18 Implant surfaces modified with nanoparticle layers have also shown a higher growth of mesenchymal stem cells.19,20 In addition to surface topography, the surface wettability also affects the behavior of mesenchymal stem cells. Hydrophilic acid-etched surfaces demonstrated an increase in mesenchymal stem cell proliferation.21 Surface chemistry is a property which can drastically change the material–cell interactions and can have a very versatile effect on cell adhesion, proliferation and differentiation. Therefore, incorporating trace elements like silver (Ag), copper (Cu), strontium (Sr) and zinc (Zn), compounds like hydroxyapatite and groups like carboxyl (–COOH) and amino (–NH2) as well as effect of incorporating proteins like bone morphogenic protein and peptides on the osteogenic differentiation of stem cells have been explored.22–28 Some of the above-mentioned surface modifications have also been combined to fabricate multifunctional surfaces which resist bacteria adhesion, whilst encouraging cell adhesion and growth.29Additionally, osseointegration is also influenced by the blood clot formation on the implant surface when it comes in contact with the biological environment.30,31 This blood clot is the first step towards wound healing process. Platelets are the first cells to contact the implant surface that eventually helps in clot formation after their activation on the surface. Surface topography and chemistry also plays a critical role in modulating the rate of the platelet activation, thus influencing the blood clot formation and initiation of wound healing process.32,33 Blood clot has shown to influence the bone regeneration process with delayed bone growth observed in animal studies when blood clot was removed.34 As the clot constitutes biodegradable materials, it works as an important source signalling molecules and growth factors. Additionally, the clot also provides a three-dimensional matrix for cell adhesion and migration.32 The clot also provides space for supporting cell infiltration, proliferation and differentiation.34 In addition to contributing towards clot formation, platelets in the form of platelet rich plasma (PRP) have also shown to provide growth factors and support faster differentiation of mesenchymal stem cells to osteoblasts.35 Presence of clot also allows for contact osteogenesis which is a superior healing method as compared to distant osteogenesis.35 Surface topography and chemistry, therefore, are critical in influencing not only the osseointegration but also the blood clot formation. Research has shown that acid – etched, hydrophilic surfaces and surfaces with nanostructured topography or increased roughness have shown enhanced blood clot formation.36–39
In this study, copper modified titania nanotube surfaces were fabricated as a potential surface for orthopedic implants. Titania nanotube surfaces are easy to fabricate, and previous research has shown enhanced biocompatibility, improved antibacterial properties and higher adhesion & differentiation of stem cells.1,40–44 Copper (Cu) is the third most abundant trace element found in the human body and plays an important role in wound healing and maintaining bone volume in addition to preventing cell damage and resisting bacterial infections.45 Cu has also shown to enhance the osteogenic differentiation of mesenchymal stem cells (MSCs).46 Deficiency of Cu has also been shown to be a cause of osteoporosis in humans.47 Previous studies have shown that presence of copper leads to higher expression of osteogenic proteins like osteocalcin (OCN) and alkaline phosphatase (ALP) as well as enhanced calcium deposition in vitro.45,48,49 Thus, in this study the favorable topography of titania nanotube surfaces was modified with copper and the interaction of these surfaces with adipose derived stem cells (ADSCs) was investigated. ADSCs adhesion, proliferation and differentiation were investigated using fluorescence & immunofluorescence microscopy, scanning electron microscopy and protein expression assays. To understand the blood clotting properties of these surfaces, platelet adhesion and activation, and whole blood clotting was also investigated. The results of the study indicate that copper modified titania nanotube surfaces demonstrate enhanced osteogenesis as well as blood clotting, thus making them a possible surface for orthopedic implants.
2. Material and methods
Fabrication of copper modified titania nanotube surfaces
Titania nanotube surfaces were fabricated from commercial grade titanium (Ti) foils using an anodization and annealing process as discussed elsewhere.44,50 Ti foils were cut into a size of 25 mm × 25 mm × 0.5 mm and mechanically polished and cleaned before anodizing in an electrolyte solution of 95% diethylene glycol (DEG), 3% DI water, 2% hydrofluoric acid for 22 h at 55 V. Following the anodization, surfaces were rinsed with DI water and isopropyl alcohol before annealing at 530 °C for 3 h in an oxygen ambient environment with temperature increment rate at 15 °C min−1 at the beginning of the process. Copper modification was carried out through a novel one-step physical vapor deposition process (PVD) under a high vacuum of 40–60 mTorr with argon as the carrier gas. A copper chloride (CuCl2) source was used for copper deposition. The surfaces were annealed at 200 °C after deposition to allow for copper diffusion onto the surfaces. To understand the effect of nanotube surface topography as well as the copper modification, we used the following surface combinations: titanium (Ti), titania nanotube surfaces (NT), titanium with copper modification (TiCu), and copper modified titania nanotube surfaces (NTCu).Surface characterization
Surface topography and morphology were characterized for the different surfaces using a JEOL 6500 field emission scanning electron microscope (SEM). Surfaces were coated with a 10 nm layer of chromium (Cr) before imaging using a quorum coater to enhance the conductivity. The SEM parameters were chosen as follows: accelerating voltage of 15 kV, working distance of 10 mm, and vacuum pressure below 3 × 10⁻⁴ Pa.Surface chemistry was characterized to evaluate the composition of copper on different surfaces using a PHI-5600 X-ray photoelectron spectroscopy (XPS) probe equipped with Al Kα X-ray source. Survey spectra was collected at a pass energy of 187 eV and a 0.05 eV step for 16 cycles. The data was analyzed, and percentage of elements present on the surface was calculated using CASA XPS software.
Adipose derived stem cell (ADSC) culture
Human ADSCs were obtained from Late Dr Kimberly Cox-York's laboratory at Colorado State University. The ADSC isolation protocol was approved by the Colorado State University Institutional Review Board. The cells were cultured in a growth media composing of α – MEM media with 10% (v/v) Fetal Bovine Serum (FBS) and 1% (v/v) penicillin/streptomycin1 at 37 °C and 5% CO2. The cells were cultured, and media was changed every other day till they reached >80% confluence. Following expansion, cells were detached using TrypLE and suspended in growth media. All cells used in these studies were below passage 4. Prior to seeding of cells, all the surfaces were sterilized by incubating for 10 min in 70% ethanol solution and kept under ultraviolet light for 30 min before being rinsed three times with phosphate buffer saline (PBS). The surfaces were then kept in 48-well plates with the final volume of cells seeded on each surface being 2.0 × 10⁴ cells per well.ADSC adhesion and proliferation on different surfaces
Cell adhesion and proliferation were evaluated through fluorescence microscopy. After days 4 and 7 of culture, the media was removed, and the surfaces were rinsed three times with PBS. The cells were then fixed using a 3.7% (v/v) solution of formaldehyde in PBS for 15 min. Following three rinses with PBS, the surfaces were kept in a 1% Triton X-100 solution in PBS for 3 min and rinsed twice with PBS. Then the cells were stained with rhodamine phalloidin in PBS for 20 min for cytoskeleton and DAPI was added in the last 5 min for staining the nucleus. The surfaces were then rinsed twice in PBS and left in PBS till imaging under a fluorescence microscope. The amount of ADSCs adhered on surfaces was determined by counting the stained nucleus on the surfaces. The ADSC proliferation was also evaluated using a CellTiter-Blue assay (Promega) after 4 and 7 days of culture. The manufacturer's protocol was followed.51The cell morphology was evaluated using SEM. After the incubation period, the cell growth media was removed, and the surfaces were rinsed with PBS. Cells on the surfaces were fixed by immersing the surfaces in a fixative solution containing 3% glutaraldehyde, 0.1 M sucrose and 0.1 M sodium cacodylate in DI water for 45 min. Once the cells were fixed, they were allowed to sit in a buffer solution (fixative solution without glutaraldehyde) for 10 min. The surfaces were immersed subsequently in 35%, 50%, 70%, and 100% ethanol solutions for 10 min each. Finally, the surfaces were stored inside a desiccator before taking SEM images. Prior to imaging, the surfaces were coated with 10 nm chromium (Cr) to increase the conductivity. SEM images were captured at different magnifications from 500× to 5000×. The following imaging parameters were chosen: accelerating voltage of 3 kV, working distance of 10 mm, and vacuum pressure below 3 × 10⁻⁴ Pa.
ADSC differentiation on different surfaces
After 7 days of culture, the cells were exposed to differentiation media that included growth media plus 10−8 M dexamethasone, 50 μg mL−1 β-glycerol phosphate and 6 mM ascorbic acid to induce osteogenesis. The differentiation media was changed every other day from day 7 to day 28. After days 14 and 28 of culture, the media was removed and 500 μL of 0.2% (w/v) Triton X-100 in sterile DI was added to the wells. The surfaces were shaken for 20 min at 150 rpm to remove all the proteins from the cells. The differentiation was then evaluated through the following quantitative assays: total protein content, alkaline phosphatase (ALP) activity and calcium concentration:• To determine total protein content, 150 μL of Triton–protein mixture was added to a 96-well plate and 150 μL of working reagent made from micro-BCA protein assay kit. The well plate was then covered with foil and incubated for 2 hours at 37 °C and 5% CO2. The absorbance was read at 562 nm. The total protein content was determined from a standard absorbance curve versus known concentration of albumin standard provided by the manufacturer.
• To determine ALP activity, 50 μL of the Triton–protein mixture from each well was added to a 96-well plate and 150 μL of working reagent made from QuantiChrom™ Alkaline Phosphatase Assay Kit. The absorbance was read at 405 nm and repeated after 4 min. The absorbance was converted to concentration using ALP standard and data was normalized using the total protein content.
• To determine calcium deposition on each surface, a commercially available calcium reagent test (Teco Diagnostics) was used. The Triton–protein mixture was removed and a 6 M HCL (hydrochloric acid) concentration was added to the wells and the well plate was left in the shaker overnight to ensure all the calcium was dissolved into the solution. After 12 hours, 20 μL of calcium-acid solution was added to 1 mL of working reagent and absorbance was read at 570 nm and was converted to concentration using a calcium standard provided by the manufacturer.
The differentiation of the cells was also evaluated through immunofluorescence microscopy for osteocalcin. After 14 and 28 days of culture, the media was removed, and the surfaces were rinsed three times with PBS. The cells were then fixed using a 3.7% (v/v) solution of formaldehyde in PBS for 15 min. Following three rinses with PBS, the surfaces were kept in a 1% Triton X-100 solution in PBS for 3 min and rinsed twice with PBS. Following the Triton X-100, surfaces were immersed in a 10% solution of bovine serum albumin (BSA, Sigma) for 30 min to blocks non-specific binding sites in the cells. After removing BSA, the surfaces were rinsed with PBS and osteocalcin primary antibody (Santa Cruz Biotechnology) was added at a dilution of 1![[thin space (1/6-em)]](https://www.rsc.org/images/entities/char_2009.gif) :
:![[thin space (1/6-em)]](https://www.rsc.org/images/entities/char_2009.gif) 100 in 1% BSA for 60 min. The surfaces were again washed with PBS three times, followed by adding of the secondary antibody, FITC (Santa Cruz Biotechnology) at a dilution of 1
100 in 1% BSA for 60 min. The surfaces were again washed with PBS three times, followed by adding of the secondary antibody, FITC (Santa Cruz Biotechnology) at a dilution of 1![[thin space (1/6-em)]](https://www.rsc.org/images/entities/char_2009.gif) :
:![[thin space (1/6-em)]](https://www.rsc.org/images/entities/char_2009.gif) 200 in 1% BSA for 45 min. The surfaces were then washed with PBS which was followed by the staining with rhodamine phalloidin and DAPI, process for which has been explained in the previously. The surfaces were then rinsed twice in PBS and left in PBS till imaging under a fluorescence microscope.
200 in 1% BSA for 45 min. The surfaces were then washed with PBS which was followed by the staining with rhodamine phalloidin and DAPI, process for which has been explained in the previously. The surfaces were then rinsed twice in PBS and left in PBS till imaging under a fluorescence microscope.
Platelet adhesion and activation
Whole human blood was drawn from healthy individuals with formal consent by a trained phlebotomist. The protocol was approved by the Colorado State University Institutional Review Board, which follows the National Institutes of Health's “Guiding Principles for Ethical Research”. Whole blood was obtained in 10 mL vacuum tubes coated with ethylenediaminetetraacetic acid (EDTA) to avoid clotting. Platelet Rich Plasma (PRP) was obtained by centrifuging whole blood at 150 g for 15 min. The surfaces were placed in a 48 well plate and incubated in 500 μL PRP for 2 hours at 37 °C and 5% CO2.Platelet adhesion was investigated using fluorescence microscopy. After the incubation period, surfaces were rinsed twice with PBS to remove unadhered platelets and incubated in a 5 μM solution of calcein for 20 min at room temperature in a dark environment to stain the platelets. After the incubation period, the surfaces were rinsed once with PBS and stored in PBS before being imaged using a fluorescence microscope. ImageJ was used to quantify the adhered platelets on different surfaces. Platelet activation was investigated using SEM. The surfaces were rinsed with PBS and fixed using a similar process as described earlier. The surfaces were coated with chromium and imaged in SEM with the similar parameters.52,53
Whole blood clotting
Human blood was drawn from healthy individuals by a trained phlebotomist in 3 mL vacuum tubes without anticoagulants. To evaluate whole blood clotting, 7 μL of blood was placed on different surfaces in a 24 well plate. The blood was allowed clot for 15, 30 and 45 min. After the specific time interval, 700 μL DI water was added to the wells and the surfaces were gently agitated for 5 min on a shaker to lyse the red blood cells and release hemoglobin. Blood that was not exposed to any surface was used as control (100% hemoglobin release). The absorbance of hemoglobin was measured using a plate reader at 540 nm. The control was read immediately after collection (0 min).53,54Statistical analysis
Surface characterization was repeated for at least six different samples of each surface. Cell studies were performed two times with at least three different samples in each group (nmin = 6). Blood studies were performed three times with at least three different samples in each group (nmin = 9). The quantitative results were analyzed by two-way analysis of variance (ANOVA) and Tukey's honestly significant difference (HSD) test using the JMP software with significant results considered when p < 0.05. The data presented here is from one study and similar trends were observed from other cell studies as well.3. Results and discussion
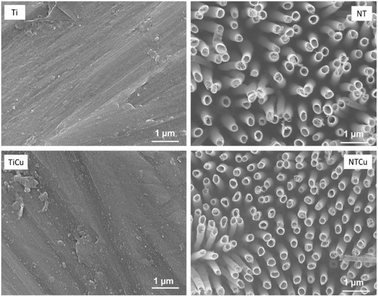
In previous study, copper modified titania nanotube surfaces were fabricated and evaluated for their antibacterial and antifouling properties against Gram-positive and Gram-negative bacteria.44 The adhesion, growth and morphology of bacteria was evaluated. The results indicated that NTCu surfaces displayed significantly lower bacteria adhesion, growth as well as biofilm formation (p < 0.05). Against Gram-positive bacteria, NTCu surfaces displayed around 15–20% less bacteria adhesion and growth in comparison to all other surfaces which was similar to the Gram-negative bacteria where a 10–15% reduction was observed.44 This reduction was observed due to the nano-topography of the surface and the presence of copper on the surface. Incidentally, these properties also influence cell adhesion, proliferation and differentiation. Hence, in this study, we investigated the ability of these surfaces towards the cell viability, adhesion, proliferation and differentiation of ADSCs towards osteogenic lineage. As blood clotting also plays a critical role in the osteogenic differentiation, the interaction of surfaces with platelet rich plasma and the clotting properties with whole blood were evaluated.Surface topography of all the surfaces (Fig. 1) was characterized in detail and is discussed elsewhere.44 In brief, as expected, Ti surfaces did not have any distinctive features and NT surfaces displayed vertically oriented, uniform nanotube surfaces. However, after copper modification, there were no significant changes observed in the surface topography of NTCu when compared with NT, indicating that the modification process did not alter the surface topography at nanoscale. For long term success of implants, the modification strategies should maintain the topography of the original surface as it is critical in affecting cell adhesion, proliferation and differentiation as well as in blood clot formation.
Surface chemistry for all the surfaces was characterized and explained in detail elsewhere using XPS (Table 1).44 In brief, as expected, the XPS survey scans for all surfaces showed peaks for titanium (Ti 2p), carbon (C 1s), and oxygen (O 1s). Presence of carbon can be attributed to the impurities on the surfaces as well as possible to carbon contamination of the XPS chamber. However, there was lower carbon concentration on NT and NTCu surfaces as compared to Ti surfaces since some of the surface impurities were removed in the etching process as part of anodization. Higher amount of oxygen present on NT and NTCu surfaces can be attributed to anodization that results in formation of more oxide on the surface. As expected, TiCu and NTCu surfaces show the presence of Cu 2p peaks but also Cl 2p peaks due to CuCl2 as a source to deposit Cu on surfaces. NTCu surfaces have a higher copper content compared to TiCu surfaces that can be attributed to the difference in surface topography and surface area.
| % Ti 2p | % C 1s | % O 1s | % Cu 2p | % Cl 2p | |
|---|---|---|---|---|---|
| Ti | 32.72 | 53.58 | 6.88 | — | — |
| NT | 29.49 | 16.94 | 48.07 | — | — |
| TiCu | 8.42 | 34.89 | 29.96 | 3.31 | 1.90 |
| NTCu | 24.30 | 20.17 | 43.19 | 0.69 | 0.94 |
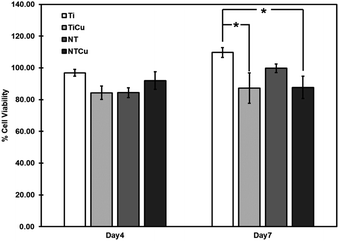
Initial cell viability, attachment and proliferation is important as that will affect their long-term stability and cell differentiation.55 The cell viability was evaluated using a commercially available CellTiter-Blue assay (Promega) after 4 and 7 days of cell culture (Fig. 2). Cell viability was calculated using the reduction percentage of CellTiter-Blue. Living cells reduce resazurin to resorufin through dehydrogenase enzymes. Hence, the higher the expressed resorufin, greater the cell viability.56 The cell viability results for the surfaces were normalized using a positive control (cells on tissue culture polystyrene). All the surfaces displayed equivalent reduction of CellTiter-Blue with no significant difference after 4 days of culture. After 7 days, the copper modified surfaces (TiCu, NTCu) showed a slight decrease in the viability as compared to the non-modified surfaces (Ti, NT) indicating ADSCs had a higher metabolic activity on these surfaces (Ti, NT).
 | ||
| Fig. 2 Cell viability after 4 and 7 days of cell culture. Results are normalized using the positive control. | ||
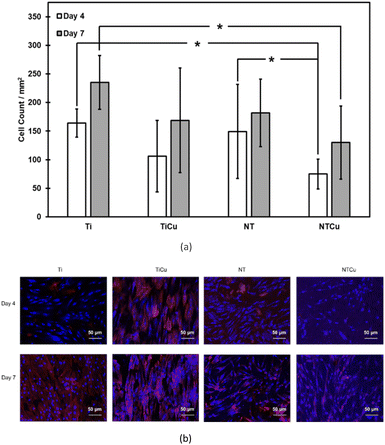
The adhesion, proliferation, and growth of ADSCs on surfaces were investigated through fluorescence microscopy. After 4 and 7 days of culture (Fig. 3), Ti surfaces had the highest cell proliferation followed by NT, TiCu and NTCu respectively. There was a significant difference between cell proliferation for NT and NTCu surfaces. Between day 4 and day 7, all the surfaces displayed an increase in proliferation as seen by the higher cell counts. The cell growth on NT and NTCu surfaces is elongated as compared to spherical on the Ti and TiCu surfaces. The cell adhesion was highest on Ti surfaces as compared to all other surfaces. However, for long term stability of the implants, the functionality of adhered cells on the surface is important. This decrease could be attributed to the presence of copper on the surfaces. Previous studies have shown lower proliferation but enhanced differentiation due to the presence of copper.45 As expected, the cell adhesion on nanotubes is similar to what has been reported in previous studies.40,43,57 Though NT and NTCu surfaces display lower cell density, the nanotubular topography has been well established as a topography which promotes osteogenic differentiation as well as communication between cells. Copper has also demonstrated enhanced osteogenic differentiation. However, while each of these modifications have been extensively researched, the combined effect of these modifications towards cell adhesion, proliferation and differentiation has not yet been investigated.
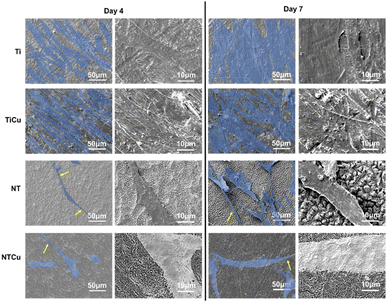
Cell morphology was investigated using SEM (Fig. 4). As expected, cell morphology was similar to that reported by other studies on Ti and NT surfaces.1,40,43,57 As seen on the fluorescence microscopy images, there was an increase in the cell proliferation on SEM images as well from day 4 to day 7 of culture. As seen on fluorescence microscopy, cell growth on the nanotubular surfaces (NT and NTCu) are elongated. These elongations are called filopodia which were clearer in the SEM images and protruding across the surfaces. Filopodia are actin-based cell protrusions which are critical in the cell adhesion and sensing the environment around for contact guidance.58 Filopodia have been associated and are deemed important for cellular response to nano-topography.40,43,59
After 7 days of ADSC culture on surfaces, osteogenesis was induced by providing osteogenic media to cells for differentiation to osteoblasts. Osteogenic media comprised of growth media plus dexamethasone, β-glycerophosphate, and ascorbic acid. The additives have to be added to the growth media because the α – MEM media allows for rapid proliferation but depresses the differentiation markers.60 Each additive plays a key role to induce osteogenic differentiation, dexamethasone induces and regulates the expression of Runx2 protein which is a key transcription factor associated with osteoblast differentiation. β-Glycerophosphate provides the phosphate for bone mineral i.e. hydroxyapatite and ascorbic acid ensures osteogenic differentiation via increasing the secretion of collagen type 1.61 Osteogenesis is critical in long-term stability of orthopedic implants which plays an important role in preventing device failure.1 The ability of the ADSCs to differentiate towards osteogenic lineage was characterized after 1- and 3 weeks of providing differentiation media using immunofluorescence microscopy of a marker protein, osteocalcin as well as through cell functions which are associated with osteoblast differentiation – ALP activity, and calcium deposition.
ALP is a key component of bone matrix due to the role it plays in mineralization and is an early indicator of immature osteoblast activity.55 The expression of ALP is at its peak typically during the early differentiation of cells to mature osteoblasts, then it decreases before increasing again.62 The results of ALP normalized as part of total proteins (Fig. 5) show that there is an increase in the ALP content from week 1 to week 3 of culture, with TiCu surfaces showing the highest level of ALP within the surfaces at the end of culture after 3 weeks. Lower ALP expression after week 1 is expected as the cells have not been exposed to the differentiation media for an extended duration of time. Hence, the differentiation is in its initial stages. However, at week 3, we can see a higher ALP expression which shows that cells are differentiating on all the surfaces. Difference of ALP between TiCu and NTCu surfaces can be attributed to the cyclical nature of ALP expression. ALP expression might be higher for NTCu surfaces on week 2 and is now in a decline whereas it is on the peak for TiCu surfaces. Presence of copper and nanotube topography have individually shown earlier differentiation and higher ALP expression.43,63 Hence, it could be possible that when these two modifications are combined, the maximum ALP expression happens earlier.
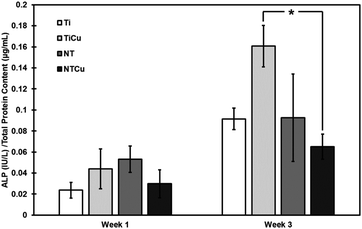 | ||
| Fig. 5 Normalized ALP activity on surfaces after weeks 1 and 3 after culture. [* represents p < 0.05]. | ||
As calcium is one of the main components of hydroxyapatite, which is produced during the mineralization process, it is necessary to quantify it.1 Mineralization process is the process through which cells produce hydroxyapatite which is the principle inorganic component of the bone.1 Calcium and phosphorous are the main components of hydroxyapatite. Phosphorous is already produced by cells in form of ALP. Cells deposit hydroxyapatite crystals on the surfaces. Calcium deposited on surfaces was dissolved in HCL and quantified using a colorimetric assay (Fig. 6). All the surfaces have similar calcium deposition and have increase between weeks 1 and 3 of induced osteogenesis. Thus, showing that differentiation is happening. NTCu surfaces have higher calcium deposition normalized by total protein content as compared to all other surfaces after week 1 and compared to NT and TiCu surfaces after week 3. The lower calcium content shown on TiCu surfaces also supports the high ALP expression as it means that cells are still in the early differentiation phase for TiCu surfaces at week 3 of culture.
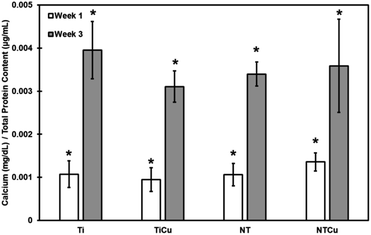 | ||
| Fig. 6 Normalized calcium deposition on surfaces after weeks 1 and 3 of culture. [* represents p < 0.05]. | ||
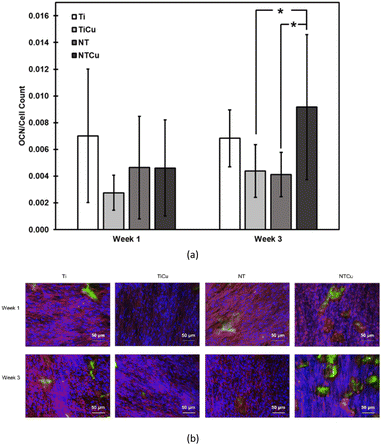
As stem cells differentiate to osteoblasts, matrix proteins are secreted which are necessary for mineralization. Osteocalcin (OCN) is one protein which is a late marker for osteoblasts differentiation and is involved in bone matrix formation.40 Osteocalcin is the most abundant non-collagenous protein found in bone.64 Immunofluorescence microscopy was used in this study to evaluate the OCN deposition for different surfaces after weeks 1 and 3 after culture (Fig. 7(b)). Immunofluorescence images show that OCN is present on all the surfaces and increase from week 1 to week 3 of culture. The area covered by OCN was analyzed using ImageJ software and the area was calculated and normalized by the number of nuclei (Fig. 7(a)). As expected, all the surfaces display an enhanced OCN expression from week 1 to 3 after culture. Despite having a lower cell count, NTCu surfaces displayed higher OCN expression which has also been observed in other studies with copper-based surfaces.45,48 These images correspond to the ALP and calcium deposition results which show an increase of osteogenic differentiation between week 1 and 3 of culture. The significant lower OCN expression of TiCu surfaces as compared to NTCu surfaces also shows that copper as a modification by itself does not prove to be a significant improvement in the osteogenic differentiation. However, when combined with nanotube, it demonstrated a significant increase in the differentiation of ADSCs to osteogenic lineage.
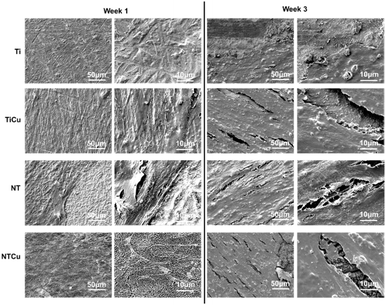
To evaluate the morphology of ADSCs on surfaces, SEM was used (Fig. 8). As expected, all the surfaces were covered with cells and the extracellular matrix deposited by cells after 3 weeks of culture. Similar growth has been observed on nanotube surfaces in other studies as well.1,40 Covering of the surface is important as that will allow for new tissue formation. Cu modified surfaces have a higher cell coverage as compared to non-modified surfaces. This is especially true for NTCu and NT surfaces. SEM results agree with calcium and OCN outcomes, hence confirming that NTCu surfaces demonstrate a higher level of cell differentiation from ADSCs to osteogenic lineages.
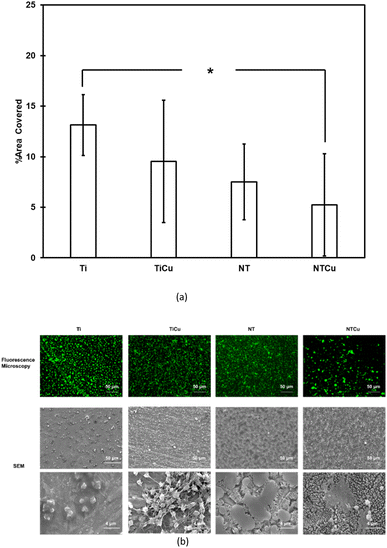
Platelet adhesion and activation on surfaces was characterized using fluorescence and SEM respectively (Fig. 9). Platelet adhesion is an indicator of thrombogenicity of the material and is a precursor to platelet activation which can initiate the coagulation cascade.53 All the surfaces have platelet adhesion (green) on surfaces after 2 h incubation in PRP (Fig. 9(b)). Surfaces modified with copper i.e., TiCu and NTCu, have lower platelet adhesion as compared to Ti and NT surfaces respectively. Similar behavior from copper has been observed in other studies as well.65,66 Additionally, nanotubular surfaces, NT and NTCu also have lower adhesion as compared to Ti and TiCu surfaces. This behavior of nanotube topography has also been observed in previous studies.67 This decreased adhesion has been attributed to Vroman effect in the literature as it replaces the protein contributing to platelet adhesion, fibrinogen with another plasma protein.67 The area covered by platelets in the fluorescence microscopy images was analyzed using ImageJ software and results are in agreement with the images which show that as the modifications increase, the platelet adhesion decreases. NTCu surfaces had a significantly lower adhesion as compared to Ti.
Platelet adhesion to surfaces leads to rapid activation. Platelet activation leads to change of morphology of the adhered platelets, which can include spreading, dendrite formation and aggregation of platelets.53,68 Activation of platelets also changes their shape from a round (un-activated) to an activated morphology which has finger-like extensions.53 All the surfaces show activated platelets with very low number showing the round morphology. The platelet morphology on the NT surfaces is different from the one observed on NTCu surfaces, with NT surfaces showing a morphology which has been observed in other studies as well.69 NTCu surfaces have a platelet morphology which is between that of TiCu and NT. Hence, showing the difference brought by Cu on the platelet activation. This clearly shows that each surface modification, surface chemistry as well as surface topography influences the platelet adhesion cascade.
Whole blood clotting was characterized by a hemolysis assay.54 Whole blood clotting offers an accurate thrombogenicity index and presents the combined effects of all components.53,54 Human blood droplets were applied on the surfaces and clot formation was analyzed after 15, 30 and 45 min by absorbance measurements. Free hemoglobin released from un-clotted blood at time 0 was used as a control (Fig. 10). A reduction in the absorbance value indicates an increase in the procoagulant activity. As expected, all the surfaces show an increased coagulation over time. However, as seen in platelet adhesion, TiCu and NTCu show a delay in the coagulation process as compared to Ti and NT surfaces over time. Similarly, NT and NTCu surfaces show an increase in the coagulation process over Ti and TiCu. Therefore, as seen in previous studies, chemical modification as well surface topography influences the coagulation.53
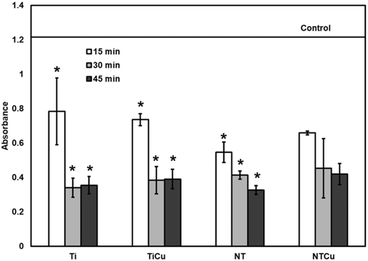 | ||
| Fig. 10 Whole blood clotting data for surfaces after incubation for 15, 30 and 45 min. [* represents p < 0.05]. | ||
4. Conclusion
In this work, NTCu surfaces were fabricated and ADSC adhesion, proliferation and differentiation to osteogenic lineage was evaluated. The NTCu surfaces were characterized using SEM and XPS for their surface topography and surface morphology respectively. The SEM displayed vertically oriented nanotube arrays across the NT and NTCu surfaces. There was also no visible change in the surface topography after copper modification. XPS survey scans showed the presence of copper on the TiCu and NTCu surfaces. ADSCs were seeded on the surfaces to evaluate the adhesion and proliferation. NTCu surfaces demonstrated increased cell density after 7 days of culture. After 7 days, osteogenic media was added to induce differentiation. NTCu surfaces demonstrated the highest OCN expression as well as higher calcium expression among all the groups. Hence, demonstrating the osteogenic differentiation on the surfaces after 28 days of culture. Blood clotting characteristics were evaluated through a whole blood clotting and platelet adhesion and activation on the surfaces. NTCu surfaces displayed platelet adhesion as well as activation and also displayed whole blood clotting over time. These results show that copper modified nanotube surfaces demonstrate enhanced differentiation of ADSCs to osteogenic lineages and have a potential of being used for fabrication of orthopedic implants.Data availability
All relevant data are within the paper. All data supporting the findings of this study are available within the paper.Author contributions
Aniruddha Vijay Savargaonkar: conceptualization, methodology, validation, formal analysis, investigation, writing – original draft, project administration, visualization. Liszt Coutinho Madruga: investigation, validation, supervision. Amit H. Munshi: conceptualization, resources, supervision. Ketul C. Popat: conceptualization, methodology, resources, writing – review & editing, supervision, project administration, resources, funding acquisition.Conflicts of interest
All the authors declare no conflict of interest.Acknowledgements
The authors would like to thank Late Dr Kimberly Cox-York for isolating and donating the human ADSCs. Research in this publication was supported by National Institute of Biomedical Imaging and Bioengineering of the National Institutes of Health under the award number R21EB033511.References
- R. M. Sabino, G. Mondini, M. J. Kipper, A. F. Martins and K. C. Popat, Carbohydr. Polym., 2021, 251, 117079 CAS.
- M. Ting, S. R. Jefferies, W. Xia, H. Engqvist and J. B. Suzuki, Journal of Oral Implantology, 2017, 43, 58–83 CrossRef PubMed.
- C. Y. Zhao, X. D. Zhu, T. Yuan, H. S. Fan and X. D. Zhang, Mater. Sci. Eng., C, 2010, 30, 98–104 CrossRef CAS.
- L. Jonášová, F. A. Müller, A. Helebrant, J. Strnad and P. Greil, Biomaterials, 2004, 25, 1187–1194 CrossRef PubMed.
- P. I. Brånemark, J. Prosthet. Dent., 1983, 50, 399–410 CrossRef PubMed.
- S. Shrestha and S. Joshi, Sci. Res., 2014, 2(1), 7–12 CrossRef CAS.
- Y. Sul, Y. Jeong, C. Johansson and T. Albrektsson, Clin. Oral Implants Res., 2006, 17, 521–526 CrossRef PubMed.
- R. Rodriguez, K. Kim and J. L. Ong, J. Biomed. Mater. Res., Part A, 2003, 65, 352–358 Search PubMed.
- P. S. Kumar, S. Kumar KS, V. V. Grandhi and V. Gupta, JMIR Biomedical Engineering, 2019, 4(1), e13237 CrossRef , https://biomedeng.jmir.org/2019/1/e13237..
- C. Gao, S. Peng, P. Feng and C. Shuai, Bone Res., 2017, 5, 1–33 Search PubMed.
- C. Yao, E. B. Slamovich and T. J. Webster, J. Biomed. Mater. Res., Part A, 2008, 85, 157–166 CrossRef PubMed.
- J. R. Porter, A. Henson and K. C. Popat, Biomaterials, 2009, 30, 780–788 CrossRef CAS PubMed.
- J. K. Park, Y. J. Kim, J. Yeom, J. H. Jeon, G. C. Yi, J. H. Je and S. K. Hahn, Adv. Mater., 2010, 22, 4857–4861 CrossRef CAS PubMed.
- B. Li, P. Gao, H. Zhang, Z. Guo, Y. Zheng and Y. Han, Biomater. Sci., 2018, 6, 3202–3218 RSC.
- F. C. Oliveira, O. Carvalho, S. Batista, S. Gusmão, L. De, S. Gonçalves, L. Martha, S. Mendes, S. Antonio, P. Freitas, G. Oliveira, M. Gusmão, C. Viana, F. R. Marciano, A. Oliveira Lobo, F. Carvalho Oliveira, J. Oliveira Carvalho, B. Soares, L. De Sousa, M. Soares Mendes, G. Oliveira De Meira, B. Cruz Viana and F. Roberta Marciano, Int. J. Nanomed., 2019, 14, 865–874 CrossRef CAS PubMed.
- H. Maleki, M. A. Shahbazi, S. Montes, S. H. Hosseini, M. R. Eskandari, S. Zaunschirm, T. Verwanger, S. Mathur, B. Milow, B. Krammer and N. Hüsing, ACS Appl. Mater. Interfaces, 2019, 11, 17256–17269 CrossRef CAS PubMed.
- H. Kenar, G. T. Köse and V. Hasirci, Biomaterials, 2006, 27, 885–895 CrossRef CAS PubMed.
- A. Wilkinson, R. N. Hewitt, L. E. McNamara, D. McCloy, R. M. Dominic Meek and M. J. Dalby, Acta Biomater., 2011, 7, 2919–2925 CrossRef CAS PubMed.
- D. S. Kommireddy, S. M. Sriram, Y. M. Lvov and D. K. Mills, Biomaterials, 2006, 27, 4296–4303 CrossRef CAS PubMed.
- L. Damiati, M. G. Eales, A. H. Nobbs, B. Su, P. M. Tsimbouri, M. Salmeron-Sanchez and M. J. Dalby, J. Tissue Eng., 2018, 9, 2041731418790694 Search PubMed.
- X. Rausch-fan, Z. Qu, M. Wieland, M. Matejka and A. Schedle, Dent. Mater., 2008, 24, 102–110 CAS.
- T. T. Yu, F. Z. Cui, Q. Y. Meng, J. Wang, D. C. Wu, J. Zhang, X. X. Kou, R. L. Yang, Y. Liu, Y. S. Zhang, F. Yang and Y. H. Zhou, ACS Biomater. Sci. Eng., 2017, 3, 1119–1128 CAS.
- R. J. Lu, X. Wang, H. X. He, E. Ling-Ling, Y. Li, G. L. Zhang, C. J. Li, C. Y. Ning and H. C. Liu, J. Mater. Sci.: Mater. Med., 2019, 30, 1–14 CAS.
- A. Rajendran, U. Kapoor, N. Jothinarayanan, N. Lenka and D. K. Pattanayak, ACS Appl. Bio Mater., 2019, 2, 3808–3819 CAS.
- J. Wen, J. Li, H. Pan, W. Zhang, D. Zeng, L. Xu, Q. Wu, X. Zhang, X. Liu and X. Jiang, J. Mater. Chem. B, 2015, 3, 4790–4804 CAS.
- C. Wolf-Brandstetter, R. Beutner, R. Hess, S. Bierbaum, K. Wagner, D. Scharnweber, U. Gbureck and C. Moseke, Biomed. Mater., 2020, 15, 025006 CAS.
- J. Chen, G. Hu, T. Li, Y. Chen, M. Gao, Q. Li, L. Hao, Y. Jia, L. Wang and Y. Wang, Biomaterials, 2021, 264, 120446 CAS.
- N. López-Valverde, J. Aragoneses, C. Rodríguez and J. M. Aragoneses, Frontiers in Bioengineering and Biotechnology, 2023, 11, 1244667 Search PubMed.
- A. Bian, Y. Sun, J. Guan, L. Xie, H. Yang, P. Han, H. Lin, H. Qiao, X. Zhang and Y. Huang, J. Ind. Eng. Chem., 2024, 135, 94–109 CAS.
- H. T. Shiu, B. Goss, C. Lutton, R. Crawford and Y. Xiao, Tissue Eng., Part B, 2014, 20(6), 697–712 CAS.
- L. Milillo, F. Cinone, F. Lo Presti, D. Lauritano and M. Petruzzi, Materials, 2021, 14, 6642 CAS.
- P. R. T. Kuzyk and E. H. Schemitsch, Indian Journal of Orthopaedics, 2011, 45, 108 Search PubMed.
- J. E. Davies, Journal of Dental Education, 2003, 67, 932–949 Search PubMed.
- X. Wang, T. Friis, V. Glatt, R. Crawford and Y. Xiao, J. Tissue Eng. Regener. Med., 2017, 11, 2864–2875 CAS.
- H. T. Shiu, B. Goss, C. Lutton, R. Crawford and Y. Xiao, Tissue Eng., Part B, 2014, 20, 697–712 CAS.
- B. S. Kopf, S. Ruch, S. Berner, N. D. Spencer and K. Maniura-Weber, J. Biomed. Mater. Res., Part A, 2015, 103, 2661–2672 CrossRef CAS PubMed.
- L. Bai, Y. Zhao, P. Chen, X. Zhang, X. Huang, Z. Du, R. Crawford, X. Yao, B. Tang, R. Hang, Y. Xiao, L. Bai, Z. Du, R. Crawford, Y. Xiao, Y. Zhao, X. Zhang, X. Huang, X. Yao, B. Tang, R. Hang and P. Chen, Small, 2021, 17, 2006287 Search PubMed.
- J. Hong, J. Andersson, K. N. Ekdahl, G. Elgue, N. Axén, R. Larsson and B. Nilsson, Thromb. Haemostasis, 1999, 82, 58–64 CrossRef CAS.
- H. Nygren, C. Eriksson and J. Lausmaa, J. Lab. Clin. Med., 1997, 129, 35–46 CAS.
- K. Cowden, M. F. Dias-Netipanyj and K. C. Popat, Nanomedicine, 2019, 17, 380–390 CAS.
- A. Pozio, A. Palmieri, A. Girardi, F. Cura and F. Carinci, Dent. Res. J., 2012, 9, S169 Search PubMed.
- L. Salou, A. Hoornaert, G. Louarn and P. Layrolle, Acta Biomater., 2015, 11, 494–502 Search PubMed.
- K. C. Popat, L. Leoni, C. A. Grimes and T. A. Desai, Biomaterials, 2007, 28, 3188–3197 CAS.
- A. V. Savargaonkar, A. H. Munshi, P. Soares and K. C. Popat, J. Funct. Biomater., 2023, 14, 413 CrossRef CAS PubMed.
- Y. Wang, W. Zhang and Q. Yao, Journal of Orthopaedic Translation, 2021, 29, 60 Search PubMed.
- A. Ali, M. Ershad, V. K. Vyas, S. K. Hira, P. P. Manna, B. N. Singh, S. Yadav, P. Srivastava, S. P. Singh and R. Pyare, Mater. Sci. Eng., C, 2018, 93, 341–355 CAS.
- H. H. A. Dollwet and J. R. J. Sorenson, Biol. Trace Elem. Res., 1988, 18, 39–48 CAS.
- W. Zhang, Q. Chang, L. Xu, G. Li, G. Yang, X. Ding, X. Wang, D. Cui and X. Jiang, Adv. Healthcare Mater., 2016, 5, 1299–1309 CAS.
- L. Ren, H. M. Wong, C. H. Yan, K. W. K. Yeung and K. Yang, J. Biomed. Mater. Res., Part B, 2015, 103, 1433–1444 CAS.
- B. S. Smith, S. Yoriya, L. Grissom, C. A. Grimes and K. C. Popat, J. Biomed. Mater. Res., Part A, 2010, 95, 350–360 Search PubMed.
- CellTiter-Blue® Cell Viability Assay, https://www.promega.com/products/cell-health-assays/cell-viability-and-cytotoxicity-assays/celltiter_blue-cell-viability-assay/?catNum=G8080, accessed 26 October 2023.
- R. M. Sabino, K. Kauk, L. Y. C. Madruga, M. J. Kipper, A. F. Martins and K. C. Popat, J. Biomed. Mater. Res., Part A, 2020, 108, 992–1005 CAS.
- L. Y. C. Madruga, K. C. Popat, R. C. Balaban and M. J. Kipper, Carbohydr. Polym., 2021, 273, 118541 CAS.
- R. M. Sabino and K. C. Popat, Bio-Protoc., 2020, 10(3), e3505 Search PubMed.
- R. F. Bombaldi de Souza, F. C. Bombaldi de Souza, A. Thorpe, D. Mantovani, K. C. Popat and Â. M. Moraes, Int. J. Biol. Macromol., 2020, 143, 619–632 CAS.
- L. Y. C. Madruga, R. M. Sabino, E. C. G. Santos, K. C. Popat, R. d. C. Balaban and M. J. Kipper, Int. J. Biol. Macromol., 2020, 152, 483–491 CAS.
- M. F. Dias-Netipanyj, K. Cowden, L. Sopchenski, S. C. Cogo, S. Elifio-Esposito, K. C. Popat and P. Soares, Mater. Sci. Eng., C, 2019, 103, 109850 CrossRef CAS PubMed.
- J. Albuschies and V. Vogel, Sci. Rep., 2013, 3, 1–9 Search PubMed.
- L. E. McNamara, T. Sjöström, K. Seunarine, R. D. Meek, B. Su and M. J. Dalby, J. Tissue Eng., 2014, 5, 2041731414536177 CrossRef PubMed.
- K. Watchrarat, W. Korchunjit, S. Buranasinsup, J. Taylor, P. Ritruechai and T. Wongtawan, Journal of Equine Veterinary Science, 2017, 50, 8–14 CrossRef.
- F. Langenbach and J. Handschel, Stem Cell Res. Ther., 2013, 4, 1–7 CrossRef PubMed.
- Z. Huang, E. R. Nelson, R. L. Smith and S. B. Goodman, Tissue Eng., 2007, 13(9), 2311–2320 CrossRef CAS PubMed.
- J. Pablo Rodrguez, S. Ros and M. Gonzlez, J. Cell. Biochem., 2002, 85, 92–100 Search PubMed.
- T. Komori, J. Oral Biosci., 2020, 62, 223–227 Search PubMed.
- Z. Mrozińska, M. Ponczek, A. Kaczmarek, M. Boguń, E. Sulak and M. H. Kudzin, Mar. Drugs, 2023, 21, 625 Search PubMed.
- E. Jelis, D. Kristol, R. R. Arora and C. R. Spillert, Proceedings of the IEEE Annual Northeast Bioengineering Conference, NEBEC, 2004, vol. 30, p. 127 Search PubMed.
- R. M. Sabino, K. Kauk, S. Movafaghi, A. Kota and K. C. Popat, Nanomedicine, 2019, 21, 102046 CAS.
- P. C. F. da Câmara, L. Y. C. Madruga, R. M. Sabino, J. Vlcek, R. C. Balaban, K. C. Popat, A. F. Martins and M. J. Kipper, Mater. Sci. Eng., C, 2020, 112, 110919 Search PubMed.
- L. Zhang, X. Liao, A. Fok, C. Ning, P. Ng and Y. Wang, Mater. Sci. Eng., C, 2018, 82, 91–101 CAS.
| This journal is © The Royal Society of Chemistry 2024 |

