Exploiting graph theory in MD simulations for extracting chemical and physical properties of materials
Sana
Bougueroua
 *a,
Alexander A.
Kolganov
b,
Chloé
Helain
c,
Coralie
Zens
 c,
Dominique
Barth
c,
Evgeny A.
Pidko
c,
Dominique
Barth
c,
Evgeny A.
Pidko
 b and
Marie-Pierre
Gaigeot
 *ad
*ad
aUniversité Paris-Saclay, Univ Evry, CY Cergy Paris Université, CNRS, LAMBE UMR8587, 91025 Evry-Courcouronnes, France. E-mail: sana.bougueroua@univ-evry.fr; mgaigeot@univ-evry.fr
bInorganic Systems Engineering, Department of Chemical Engineering, Faculty of Applied Sciences, Delft University of Technology, 2629 HZ Delft, The Netherlands
cUniversité Paris-Saclay, Univ Versailles Saint Quentin, DAVID, 78035, Versailles, France
dInstitut Universitaire de France (IUF), 75005 Paris, France
First published on 17th October 2024
Abstract
Some of our recent developments and applications of algorithmic graph theory for extracting the physical and chemical properties of materials from molecular dynamics simulations are presented. From the chemical viewpoint, the power of graph theory is illustrated in the search for a catalyst's active sites at a silica solid surface. From the physical viewpoint, we present graph algorithms that recognize the structural motifs that exist at the silica/liquid water interface. Statistical analyses of the instances of these surface–water motifs provide a detailed understanding of the structures and dynamics at the aqueous interface.
1 Introduction
Extracting knowledge of the chemical structures that are sampled in molecular dynamics (MD) trajectories is not an easy task. Following in time the changes in the 3D structure of (bio)molecules and ions embedded in solvent, or the changes in the connectivity between water molecules in the condensed phase, is typically non-trivial to achieve from conventional analyses of the time evolution of the cartesian coordinates of the atoms in the MD trajectories. Characterizing the time evolution of structures in heterogeneous interfaces, such as e.g. solid–liquid or biomolecule–liquid interfaces, is also a challenging task.Algorithmic graph theory based on topological graphs is a good methodology to employ in order to obtain such knowledge in the time domain and for generating global statistics. As stated by Balaban,1 graphs are fundamental and constitutional to chemistry and to structure theory in particular. A graph indeed encodes topological properties of matter at the molecular level by means of vertices and edges that reflect the specific interactions between vertices. At the molecular level of representation, the vertices are usually associated with atoms while the edges report on the interactions between the atoms, e.g. chemical bonds and intermolecular interactions. Most graphs are defined in 2-dimensions (2D-graphs), any information related to e.g. distances and angles, are usually not encoded into topological 2D-graphs unless vertices/nodes are specifically labeled with such information. Graphs can, however, be also three-dimensional, with an indication of the coordinates in space that would hence encode intra- and inter-molecular interactions between the atoms. Easier to obtain or to predict than 3D-graphs, 2D-graphs carry information on the structure, the functional properties and even the 3D shape of the materials they model. Examples include the classification of similar molecules according to their topology,2,3 the prediction of patterns in biological molecules,4 the prediction of the 3D structure of small molecules,5etc. Graphs (with different definitions of vertices/edges) have been implemented for the analysis of the evolution with time of conformations of various materials in molecular dynamics simulations, see for instance ref. 6–16.
One essential key component of the mathematical analysis of molecular graphs is the concept of isomorphism that provides the constitutional isomeric forms of a given molecular system.1
In bio-/chemo-/material-informatics, the challenge is to identify or design algorithms capable of obtaining molecular properties from input graphs and to follow these properties in time. We have developed a series of 2D-graphs, at various levels of granularity of representation,17,18 and developed the associated algorithms in order to analyze physical and chemical properties from atomistic molecular dynamics (MD) simulations (DFT-based MD, semi-empirical MD and classical force field FF-MD). In these developments, our aim was to ensure that the 2D-graphs and algorithms could be applied without any modification to “simple” isolated molecules, as well as to assemblies of molecules and to more complex liquid and solid states of matter, including e.g. inhomogeneous solid/liquid and biomolecules/liquid interfaces.17–23
Here we briefly review the definitions that we have developed for the construction of molecular graphs at the atomistic level of representation that indeed ensure that these 2D-MolGraphs can be applied and transferred without any modification from gas phase molecular states to more complex condensed matter states. The concept of isomorphism is included in our algorithms. 2D-MolGraphs are encoded in the GaTewaY software.24 Two applications of the 2D-MolGraphs are presented, both related to solids, either at the interface with the vacuum (Section 3) or at the interface with liquid water (Section 4). Section 3 shows how the 2D-MolGraphs are inserted into theoretical workflows that can extract the knowledge of active sites in heterogeneous catalysts. The methodology follows some of our previous works,21,23 hereby applied to surface organometallic catalysts. In Section 4, 2D-MolGraphs are dissected to extract the knowledge of the structural patterns/motifs that exist between the sites located at an oxide's top-surface and the water molecules that are in contact with the oxide surface at the solid–liquid water interface. The structural and dynamical organization of the oxide–liquid interface is hence revealed, as well as the spatial location and possible repetition(s) of oxide-water motifs over the top-surface in the binding interfacial layer (BIL).25,26 Such patterns are of utmost importance for an understanding of the chemical reactivity that can occur at aqueous interfaces. This information could certainly also be used to design catalysts.
2 Transformation of a 3D-structure into a topological 2D-MolGraph
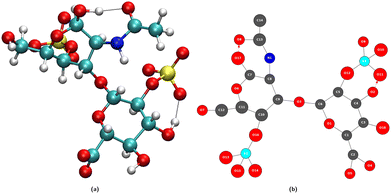
At the atomic level of description, we have developed graph theory based methods for analyzing/post-processing atomistic molecular dynamics (MD) simulations (obtained from DFT-based MD or classical force field FF-MD). This gave rise to 2D-molecular graphs (labelled 2D-MolGraph) and associated algorithms, aiming at automatically analyzing the conformational dynamics of molecules and their assemblies from molecular dynamics simulations.17 Some achievements have been presented in ref. 19, 20 and 27 showing the capabilities of the 2D-MolGraphs for describing isolated molecules, as well as liquids and inhomogeneous aqueous interfaces to solids or to the air, without the need for changing any definition in the topological graphs. Below we summarize the main elements in the definitions of the 2D-MolGraphs, all details can be found in ref. 17 and 19.A molecular system is defined in a 2D-MolGraph, in which the vertices represent atoms and the edges represent the bonds formed between them. One crucial step in our method is to define a topological model that can represent any molecular conformation with the right level of granularity that can be transferred without any modification from gas phase molecules and clusters to the condensed phase (solids, liquids, and interfaces between solids and liquids). Hence, we define any molecular conformation by a colored mixed graph G = (V, EC, AH, EI, EO), that contains both (directed) arcs and (undirected) edges. Each vertex represents an atom with a color coding that is associated with its chemical type (for example, oxygen and carbon have two different colors), while the edges represent either covalent bonds (EC), or hydrogen bonds (AH, directed arcs), or electrostatic interactions (EI) typically between cationic/anionic atoms and other atoms, or organometallic interactions (EO) between metallic atoms and their surrounding. In the current version of the 2D-MolGraphs, only the hydrogen bonds are associated to directed edges (between the heavy atoms, from the donor to the acceptor atoms). The hydrogen atoms in a molecular system are not included in vertices of the 2D-MolGraph. Instead, their presence is solely known by the directed edges whenever H-bonds exist. Fig. 1 illustrates the passage from one 3D structure to a 2D-MolGraph.
Given a MD trajectory, the exploration of the different conformations that are sampled over time can be seen as the exploration of different graph topologies. Using the isomorphism algorithm, one is hence able to recognize which graphs are identical to each other and which ones are different from each other amongst the whole sequence of 2D-MolGraphs/snapshots. Isomorphism keeps the information of the chemical nature of the atoms (i.e. color coding of the vertices), which is a key component for the identification of conformations over time in MD trajectories. The changes in the 3D conformations are hence followed over time by scanning the trajectories for the changes in the bonding patterns (among hydrogen bonds, proton transfers, coordination numbers, covalent bonds and organometallic interactions), and by preserving the chemical types of atoms (carbon, oxygen, hydrogen, etc.). Graph isomorphism28 allows representing each conformer with a fingerprint molecular graph and to compare it with other species along the simulation trajectory.
The main steps of our algorithm for post-processing a molecular dynamics simulation are as follows. The details are given in ref. 17, 19 and 20 and the algorithms have been implemented into the GaTewAY software.24
1. Read the first snapshot I0 and define the associated 2D-MolGraph G0.
2. Read the next snapshots i one by one, subsequently, and define the associated 2D-MolGraph Gi.
3. At time-step i, test if Gi is isomorphic to any other Gj already identified at previous snapshots j < i.
4. If yes, assign Gi to the set of conformations already identified; else, assign Gi to the set of non-isomorphic conformations;
5. Continue with step (i + 1) in order to read the subsequent snapshot.
Fig. 2 schematically shows the different steps of the method.
First the algorithm converts the xyz coordinates into the time sequence of 2D-MolGraphs (Fig. 2(a)), then the isomorsphism algorithm is applied to the whole sequence of 2D-MolGraphs in order to get the unique set of non-redundant conformations/non-isomorphic graphs (Fig. 2(b)). With these non-isomorphic graphs and the time periods of their appearance/disappearance, a graph of transitions can hence be generated as illustrated in Fig. 2(c). This graph has its vertices composed of the (non-isomorphic) conformations that have been identified along the trajectory, while its edges are composed by the transitions found between these conformations (these are directed edges by construction). Both vertices and edges in the graph of transitions contain statistical information. The percentage of existence (over the duration of the trajectory) of an identified conformation is reported in the vertices of the graph of transitions, while the percentage of times a transition between two vertices/conformations has been observed is reported in the edges.
In one glance, one hence has the summary of the MD simulation. The whole network of relationships between the conformations and the statistical view over the whole time-scale of the trajectory and over the whole bunch of conformations being explored are all given in one graph. Statistics are crucial for the detailed knowledge of the dynamics of isolated molecules as well as for the dynamics of molecules in the liquid state, as shown for instance in ref. 19–22.
In the next sections, we present some applications of the 2D-MolGraphs and associated graph algorithms to recent investigations in heterogeneous catalysis (Section 3) and in the recognition of motifs at the interface of an oxide surface in contact with liquid water (Section 4.1). These investigations are presented here as proofs-of-concept.
Computational details of the DFT-based molecular dynamics simulations
The methodology of the 2D-MolGraphs is applied to the structural analysis of molecular dynamics simulations, computational details of which are reported below. All simulations are DFT-based molecular dynamics simulations (DFT-MD) carried out using the CP2K package,29,30 using a combination of mixed Gaussian/plane wave (PW) basis sets and GTH pseudopotentials.31 In Section 3, the PBE(D3BJ) functional32–34 was used to account for the exchange–correlation energy term. The energy cutoff of the plane-wave basis set was set at 450 Ry. The Gaussian DZVP-MOLOPT-SR-GTH basis set was employed to describe valence electrons of Si, O, and H atoms while the TZVP-MOLOPT-SR-GTH basis set was used for the valence electrons of Zr. Each ab initio molecular dynamics simulation was integrated over a 5 ps period within the NVT ensemble (T = 353 K), with a time step of 0.5 fs. The computational details in Section 4 are identical to the ones of ref. 26. The DFT-BLYP35,36 functional augmented by D2 Grimme corrections37,38 was used, a cutoff of 280 Ry for the PW combined with a TZV2P Gaussian basis set for O, H, Si were chosen. Born–Oppenheimer molecular dynamics are performed with a time-step of 0.4 fs, the average temperature is 320 K. An equilibration dynamics is firstly studied for a duration of 5 ps (NVE ensemble, with possible rescaling of velocities) followed by a 10 ps NVE production run on which the graph structural analyses are achieved. As described in ref. 17, hydrogen bonds are identified by the geometrical criteria of G. Galli,39i.e. 3.2 Å distance between the two heavy atoms and 140° for the H-bond angle. Ref. 17 has shown that the use of a different geometrical criterion does not change the conclusions.3 2D-MolGraphs for rational catalyst design
As already emphasized in this text, the graph-theory-based method outlined in this paper can be applied to gas phase molecules, clusters, liquids, solids, and inhomogeneous interfaces between solids and liquids. In this section, we illustrate the application of our method for exploring the configurational space of catalytic surfaces in heterogeneous catalysis. Specifically, we have explored its application for the exploration of reactive intermediates and active surface species in organometallic catalysts (SOMCs), which uniquely integrate all bonding types representing thus an opportunity for tuning their properties and reactivity and, at the same time, a challenge for their computational analysis. Furthermore, SOMCs are particularly attractive as model systems for less resolved conventional supported catalysts.Understanding the atomic-level structure of a catalyst's active site and its correlation with performance is essential for rational catalyst design.40 Typically, it is assumed that a catalyst's behavior can be expressed through the properties of its most thermodynamically stable state of the active site. However, this reductionist model often fails to explain the behavior of complex “real-world” systems.41,42 Therefore, it is more accurate to view the catalyst as a dynamic-ensemble system, with performance defined by an ensemble of states, each contributing to the catalyst's activity and selectivity.41 This could be particularly evident in single-site organometallic fragments supported on amorphous materials, where the support's strained and inhomogeneous nature can create a multitude of possible micro coordination environments and active site configurations.43
Conventional methods for exploring the active sites of heterogeneous catalysts such as genetic algorithms44 are generally inadequate here, as the strong localized bonds of organic ligands prevent the “juggling” of atoms during search, which is possible for metallic nanosized clusters and metal-oxo clusters.41 In our previous research, we proposed an exhaustive configurational search method, utilizing molecular dynamic simulations and extracting distinct structures through clustering of aligned active site coordinates.45 However, for SOMC systems characterized by numerous identical conformers post molecular dynamics (MD) trajectories processing, this approach proves less effective. In these cases, a graph-theory-based analysis of MD trajectories is notably more appropriate.
We would like to highlight here our current development of an automatic configurational space exploration method for surface organometallic catalysts. This method combines ab initio molecular dynamics (MD) and post-processing tools for MD trajectories. Our focus is on zirconocene hydride supported on amorphous silica surfaces. These systems, typically used as olefin polymerization catalysts,46 can also act as catalysts for plastic degradation under certain conditions, potentially offering an elegant and sustainable solution to the plastic waste problem.47
The general workflow for exploring the SOMC active site configurational space is illustrated in Fig. 3. We employed standard ab initio molecular dynamics (aiMD) and CP2K-implemented velocity-softening aiMD methods.48 The latter technique allows MD trajectories to rapidly cross over small energy barriers to sample a wider chemical space.45 Since multiple molecular dynamics frames may lie on a ‘valley slope’ of the same local minimum, extracted conformers were further optimized using DFT, and the resulting framework was used to map the journey of the catalyst's active site.
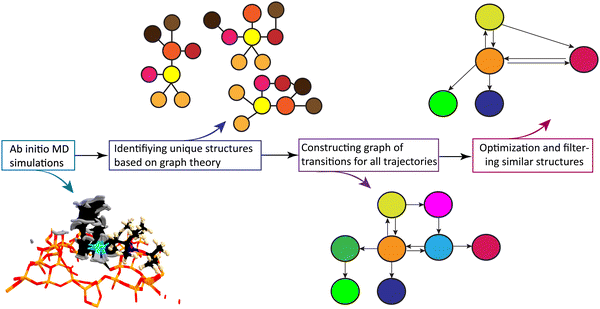 | ||
| Fig. 3 The generalized workflow for the autonomous exploration of the organometallic catalyst active site. | ||
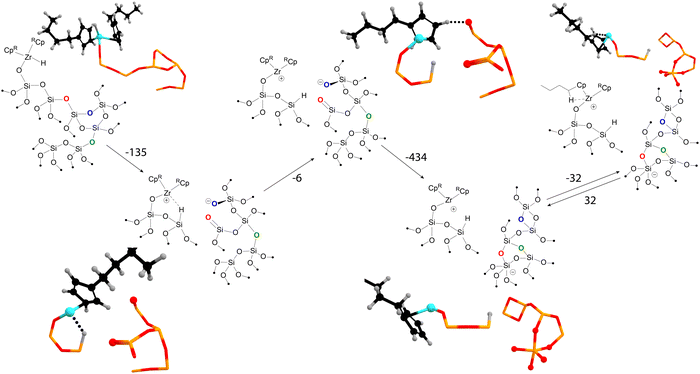
We briefly highlight our molecular dynamics study on the transformations of amorphous silica-supported zirconocene-based catalysts.49 The graph-theory-based analysis of the molecular dynamics trajectories revealed a large network of states, indicating that a simplistic “static” model could be insufficient to describe the catalyst's active site. Fig. 4 highlights some of the some of the interactions between the organometallic precatalyst and strained surface features discovered by using our method. The reaction is initiated by hydride migration to the surface silicon, coupled with the Si–O bond breaking, resulting in the formation of Si–H and Zr+⋯O− frustrated pair. Subsequently, the hydride leaves the coordination sphere of zirconium. The next steps involve the reconstruction of the surface, leading to the formation of new three- and two-membered rings and five-coordinated negatively charged silicon. These transformations stabilize the system by reducing the overall strain of the amorphous silica surface.
Thus, MD and graph theory have been instrumental in mapping the pathway from the initial state to a charge-separated Zr–O pair, which may exhibit different activity from the starting active site model. The use of Gateway software has been crucial in mapping the reconstruction of the amorphous silica surface, a task that would be challenging with the use of other methods.
The current methodology can also be applied to identify reactive events within reactive dynamics trajectories, such as those produced by reactive force-fields (e.g., ReaxFF50) or by our previously implemented codes (HiRex23/REnegate21) using RMSD-based metadynamics as implemented in CREST.51 Herein we have highlighted that the applicability of 2D graphs can be further extended to studying complex inter-conversions on solid surfaces probed using velocity-softening ab initio MD simulations,52 which allows escaping the local minima basins by ‘pushing’ the MD trajectory along the low-curvature soft vibrational modes.53
4 2D-MolGraphs for the recognition of motifs/patterns at solid/liquid interfaces
4.1 From 2D-MolGraphs to 2D-Motifs
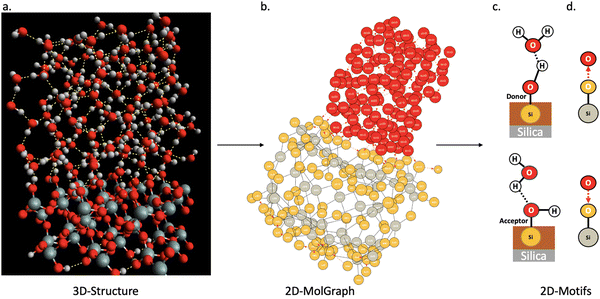
In this section, we show how the topological 2D-MolGraphs are used in order to extract the knowledge of the structural motifs26,54 that exist at the interface between a solid and liquid water. Such motifs reflect the geometrical and intermolecular binding organization of the water molecules that are located at the direct interface with the top surface of the solid in the binding interfacial layer (BIL).25 The contribution of these motifs to the vibrational signatures of the interface in the SFG (sum frequency generation) spectroscopy has also been shown.26,54 The recognition of the types of motifs that exist at the interface hence reveals the geometrical mapping of the BIL, leading to the comprehension and prediction of structural, dynamical, spectroscopic and reactivity properties of aqueous interfaces.Fig. 5 illustrates the strategy based on topological graphs, developed in this section. Each snapshot of a solid–liquid water MD simulation (Fig. 5(a)) is transformed into a 2D-MolGraph (Fig. 5(b)), over which the recognition of a set of pre-established topological 2D-Motifs will be achieved (Fig. 5(c) and (d)). For our proof-of-concept hereby, applications on the (110)-quartz/liquid water interface are taken from our ab initio MD simulations. The end-product of this graph analysis is the statistical knowledge of the presence of the motifs, quantified by their number of occurrences (or instances), and their spatial distribution over the surface, as will be shown and discussed in Section 4.2. A schematic atomistic view of the two motifs that are recognized in the BIL of the (110)-quartz/liquid water interface is shown in Fig. 5(c), and their associated 2D-MolGraphs are reported in Fig. 5(d).
The aim is to identify a series of pre-established 2D-Motifs, i.e. a set of sub-graphs, within the 2D-MolGraph molecular (non-isomorphic) conformations extracted from the MD trajectory. To that end, a first stage consists in generating all possible combinations of topological 2D-Motifs/sub-graphs from size 3 to size n, n being defined by the user (for instance, the subgraphs in Fig. 5 are of size 3). This stage is done for each non-isomorphic 2D-MolGraph that has been extracted from the graph analysis of the trajectory (see Section 2 and ref. 17 and 19). Once generated, these 2D-Motifs are saved into a database of topological motifs from which the search for specific 2D-Motifs can be performed during a second stage. As a motif is defined by the chemical elements of the atoms (vertices in a 2D-MolGraph) and the types of bonds between these atoms (edges in a 2D-MolGraph), a motif (2D-Motif) is a sub-graph in a 2D-MolGraph. Connected and induced sub-graphs are solely considered here. The occurrences of a given motif are identified when sub-graphs of distinct combinations of vertices are found to be isomorphic. The isomorphism algorithm used for comparing the graphs of the motifs is the same as the one used to compare 2D-MolGraphs with each other as described in Section 2 above, see also for instance ref. 20. Each motif is characterized by its unique signature or certificate, which is calculated based on the set of vertices and edges. For each motif, its number of occurrences (instances) and coverage rate are calculated for the series of 2D-MolGraphs (non-isomorphic conformations) under scrutiny.
Given a 2D-MolGraph G, the set of occurrences of a given 2D-Motif M in the graph G, denoted Occ(M), is defined as follows:
Occ(M) = {g ∈ Sub![[thin space (1/6-em)]](https://www.rsc.org/images/entities/char_2009.gif) g|V(M)|(G): g isomorphic to M} g|V(M)|(G): g isomorphic to M} |
![[thin space (1/6-em)]](https://www.rsc.org/images/entities/char_2009.gif) g|V(M)|(G) represents the connected induced sub-graphs of G.
g|V(M)|(G) represents the connected induced sub-graphs of G.
Once the occurrences of a given 2D-Motif M in the graph G have been found, one can calculate the coverage rate of this sub-graph within a given 2D-MolGraph G or within a series of 2D-MolGraphs. The coverage rate τcovG(M) quantifies the degree of overlap between the vertices of each 2D-Motif within the 2D-MolGraph G/within a series of 2D-MolGraphs. It is calculated using the equation
| ωG(v,M) = |{g ∈ OccG(M): v ∈ V(g)}| |
A coverage rate equal to 1 means that the instances of a given 2D-Motif within a given 2D-MolGraph/series of 2D-MolGraphs share no vertex/vertices in common, i.e. the occurrences of the 2D-Motif that are recognized within the 2D-MolGraph(s) are disjoint. As soon as the coverage rate becomes larger than 1 it means that there is overlap between the vertices in the occurrences of the 2D-Motif being recognized within the 2D-MolGraph(s) under scrutiny. The actual value of τcovG(M) has to be compared to the size (i.e. number of vertices) of the 2D-Motif. Typically, a coverage rate τcovG(M) larger than n/2 that would be found for a 2D-Motif of size n would mean that more than half of the vertices of the 2D-Motif overlap in the instances of this motif within the 2D-MolGraph(s). That would represent a rather large value of coverage rate. Any τcovG(M) value close or equal to the size n of the 2D-Motif represents the maximum possible overlap between the vertices of the 2D-Motif in the instances of this motif within the 2D-MolGraph(s). All vertices of this motif would hence be shared between the instances of the motif. The coverage value hence gives very good information on the geometric complexities and periodicities of the conformation(s) being analyzed.
Let us illustrate these concepts in Fig. 6 where the 2D-Motif of size 5 (i.e. 5 vertices) reported on the left side has to be recognized within the 2D-MolGraph of size 8 reported on the right side.
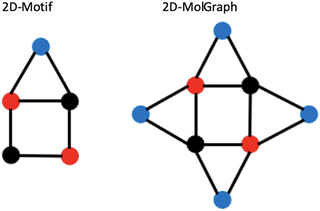 | ||
| Fig. 6 Illustration of concepts for the coverage of occurrences of a given 2D-Motif (left) within a 2D-MolGraph (right). See text for details. | ||
One can immediately see that there are four occurrences of this 2D-Motif in the 2D-MolGraph. In these 4 instances, one can immediately see that 4 vertices are commonly shared, i.e. the 2 vertices in black color and the 2 in red, while the blue vertex is never shared (i.e. disjoint). There will therefore be an overlap of these 4 instances of the 2D-Motif via the black and red vertices that will give rise to a coverage rate larger than 1. For this 2D-MolGraph configuration,  . The value of 8 in the denominator in τcovG(M) corresponds to the number of vertices in the 2D-MolGraph that participate to at least one occurrence of the 2D-Motif: all the 8 vertices of the 2D-MolGraph indeed participate. The numerator in τcovG(M) is ωG(v,M), i.e. the total number of occurrences of the 2D-Motif in the 2D-MolGraph where the vertex v appears. Hence, each of the blue vertices in the 2D-MolGraph participate in one occurrence only, thus ωG(v-blue,M) = 1. Each of the red vertices in the 2D-MolGraph participate in the 4 occurrences of the 2D-Motif, and thus ωG(v-red,M) = 4. Similarly for the black vertices of the 2D-MolGraph, ωG(v-black,M) = 4. When added up one gets ωG(v,M) = 1 + 1 + 1 + 1 + 4 + 4 + 4 + 4 = 20, for the series blue, red and black.
A coverage rate of 2.5 for this 2D-Motif, that is half of its size, is hence obtained, which represents a large overlap between the instances of the 2D-Motif that were found within the 2D-MolGraph, as could be easily seen in the picture in Fig. 6.
The proposed algorithms for finding 2D-Motifs and associated measures described above were implemented in the Graphetarium code, a series of scripts written in Python language. The code will be available on request from the authors.
4.2 Motifs between top-surface silanols and water molecules in the BIL of the (110)-quartz/liquid water interface
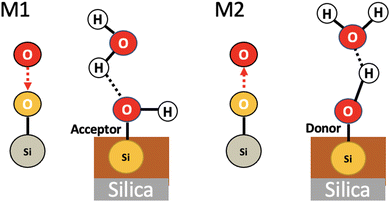
We applied the concepts described in the previous section to the motifs that can exist between the top-surface silanols and the water molecules in the BIL of the (110)-quartz/liquid water interface (AIMD simulations performed at PZC conditions, i.e. surface fully hydroxylated). The two simple motifs (with their chemical scheme and associated 2D-Motif graph) shown in Fig. 7 are chosen to be recognized within the 2D-MolGraphs recorded along the trajectory. These motifs were shown in our previous works to be dominantly present at the (0001)-quartz/liquid water interface.26,54 Both motifs can be called 2-partner motifs: they are composed of one silanol (1st partner) belonging to the top-surface of silica and one water molecule located in the BIL (second partner). Both partners are hydrogen bonded together. The motif denoted M1 is composed of an in-plane (IP) silanol that accepts an H-bond from a water molecule, while M2 has an out-of-plane (OP) silanol that is donating a H-bond to a water molecule.The Graphetarium method for the recognition of these two sub-graphs has been applied to an AIMD trajectory of ∼10 ps duration, in which one every 100 fs snapshot has been analyzed by graphs. The whole simulation box is composed of 549 atoms (189 solid atoms and 120 water molecules), including 18 Si–OH sites at the top surface of silica and 27 water molecules in the BIL (interface).25Fig. 8 shows the number of occurrences/instances that were obtained over the 10 ps trajectory, respectively for the 2D-Motif M1 (left) and 2D-Motif M2 (right).
 | ||
| Fig. 8 Distribution of the number of occurrences/instances of the 2D-Motifs M1 (left) and M2 (right) for the set of 2D-MolGraphs/conformations/snapshots analyzed over a 10 ps trajectory of the (110)-quartz/liquid water interface (analyses performed every 250 snapshots). See Fig. 7 for the description of the 2D-Motifs M1 and M2. | ||
The immediate information is that the number of instances found for motifs M1 and M2 is rather constant over the whole trajectory, with a slightly greater presence of motif M1 (for which instance values are roughly varying from ∼8 to 12) over motif M2 (instance value almost constant at ∼9). This small dynamics in the number of M1 motifs might be more the result of room temperature fluctuations in distance and angular criteria for the H-bond definition in this water HB-donor motif rather than the actual result of the dynamical (formation/breakage of motifs) and diffusive behaviour of the water molecules in the BIL. With the small asymmetry in the number of instances for M1 and M2 motifs, one can also observe that the α-(110) silica oxide surface is a slightly greater acceptor of H-bonds from water in the BIL than a donator of H-bonds to BIL-water. Interestingly, when adding the number of instances for both motifs per snapshot, one can see that all 18 silanols at the top-surface are, on average, systematically involved in hydrogen bonding with water molecules in the BIL through these two M1 and M2 motifs. On average, one therefore observes a 1-to-1 coverage of the silanols by water molecules in the BIL. Geometrically, this 1-to-1 coverage can be viewed as a rather static geometrical mapping of water and silanols in the BIL, with the formation of a ‘patterned carpet’ made of roughly half M1 and half M2 motifs. The actual distribution of motifs M1 and M2 in space over the lateral dimensions of the top-surface is however not known at that stage.
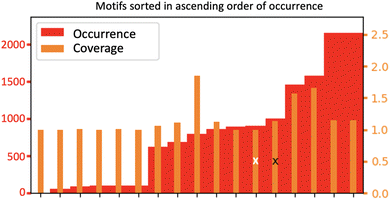
Fig. 9 shows a statistical analysis of all the 2D-Motifs of size 3 (i.e. the same size as the 2D-Motifs M1 and M2 analyzed here) formed in the BIL.
In the enumeration of size 3 2D-Motifs, we imposed that these motifs feature at least one hydrogen bond and at least one oxygen atom originating from the upper surface of the silica, as is the case for the motifs M1 and M2. The figure sorts these 2D-Motifs by their increasing order of occurrence, from the left to the right side of the figure. The ranking goes from the lowest number of occurrences on the left side of the plot to the maximum number of occurrences on the right side, respectively, corresponding to minor 2D-Motif(s) to predominant 2D-Motif(s) of size 3. The red bars are the number of occurrences per motif over the whole trajectory (scale on the left), the orange bars are the coverage values per motif (scale on the right). The two crosses in the figure indicate the ranking of the 2D-Motif M1 (black) and 2D-Motif M2 (white). There are 17 different 2D-Motifs of size 3 corresponding to the two criteria of selection. Among them, M1 and M2 2D-Motifs are found respectively in 5th and 6th position in the ranking below the most predominant 2D-Motif (reported on the right side of the plot). Note that some size 3 2D-Motifs are found with a very low value of occurrence (6 motifs ranked on the left side of the figures), only the motifs ranked from 7 to 17 have a substantial number of occurrences over the whole trajectory. Among these latter, the 4 predominant motifs that are ranked higher than motifs M1 and M2 have one-half more and even the double of occurrences than M1 and M2. The number of occurrences for motif M1 is slightly higher than the one of motif M2, as already discussed from Fig. 8.
The 6 finalists at the top ranking, including motifs M1 (5th) and M2 (6th), have roughly an equal coverage rate value of ∼1 to ∼1.5. One observes that the two motifs ranked 3rd and 4th from the top-ranking have slightly higher coverage values than M1 and M2. Considering that the coverage rates of motif M1 and M2 are very close to 1, this means that each instance of motif M1 (respectively of motif M2) is disjoint from the other instances of motif M1 (resp. of motif M2), i.e. there is no overlap between the vertices in the occurrences of the 2D-Motif-1 (resp. 2D-Motif-2). The instances of motif M1 (resp. motif M2) are hence separated in space over the lateral dimensions of the silica surface, while the two motifs do not share water molecules in the BIL. This conclusion is also true for the two motifs ranked 1st and 2nd in the maximum values of occurrences, while the instances of the two motifs ranked 3rd and 4th share 50% of their vertices (giving rise to the 1.5 coverage value to be compared to size 3 of these motifs), showing that the occurrences of these two latter motifs thus overlap quite strongly.
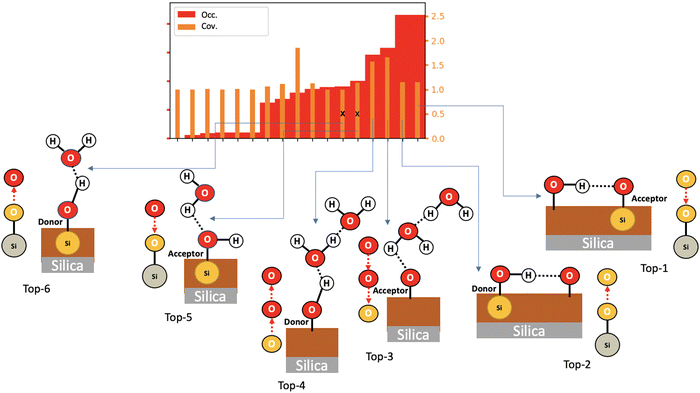
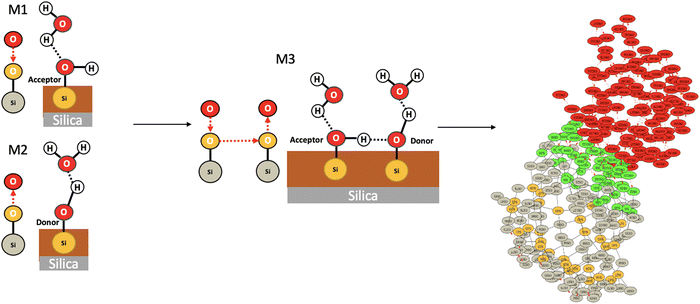
Fig. 10 now provides information on the structures that are adopted by the 4 dominant motifs (M1 and M2 motifs are also reported in the figure, resp. labelled Top-5 and Top-6). It is no surprise to find out that the two top-ranked motifs (labelled Top-1 and Top-2 in Fig. 10) are composed of neighboring silanols being hydrogen bonded together. The top-ranking in the number of occurrences of these two motifs thus give us two pieces of information of importance for understanding the structure of the BIL. One point is that silanol⋯silanol H-bonds are present in a high amount over the surface, which gives indirect structural information of the proximity of top-surface silanols and of the chemical capacity (i.e. pKa value) of these silanols for hydrogen bonding together. The second point is that 4-partner motifs might actually be formed in the BIL, resulting from the union of motifs M1 and M2, with the in-plane silanol (in M1) and the out-of-plane silanol (in M2) being H-bonded. Such 4-partner motifs would be of size 6, composed of two silica atoms, two oxygens from the silica top-surface and two oxygens from two water molecules. This would require in-plane and out-of-plane silanols to be located next to each other over the (110) silica surface and alternating in these respective orientations over the whole surface. Such alternation in in-plane/out-of-plane silanols has for instance been shown at the (0001) silica surface.54
There are two other motifs of size 3 in Fig. 10 which occurrences are ranked higher than the ones of motifs M1 and M2, respectively labelled Top-3 and Top-4. They are composed of one oxygen atom from the silica top-surface and two water molecules, one of them is H-bonded to the top-surface while the two water are H-bonded together. One can see that the two motifs differ by the H-bonding patterns between the two water molecules and with the oxygen top-surface. Top-4 motif is clearly associated with water dimers being H-bonded to out-of-plane silanols, as the figure shows. At this stage, it is, however, impossible to confirm whether the silica oxygens in motif Top-3 (labelled ‘acceptor’ in the figure) is associated with in-plane silanols or with siloxane bridges. This information is absent from the graphs of this 2D-Motif. However, the knowledge that we acquired above of a 1-to-1 coverage of the silanols of the surface by motifs M1 and M2 leads us to surmise that Top-3 motif should be associated with in-plane silanols rather than to siloxane oxygens. As already discussed above with 4-partner motifs, this knowledge also tells us that motif M1 might be more complex than being just a 2-partner motif, it might actually be totally or partially involved in motifs of the type Top-3, that include a H-bonded network of water molecules. The same conclusion is true for motif M2 that might be partially/completely included in the Top-4 motif. One could also imagine that the 4-partner motifs that were discussed above include two water molecules being H-bonded together, on top of the two silanols being H-bonded. Furthermore, Top-3 and Top-4 motifs have a coverage rate of 1.5, i.e. half of their size. These two motifs thus share vertices and/or edges with other motifs of size 3, one can easily imagine that they share vertices with motifs M1 and M2.
Taking as an example one snapshot among the whole trajectory, we now verify in Fig. 11 that the 4-partner motif M3 made of the union of one M1 and one M2 by one silanol⋯silanol hydrogen bond is indeed present over the surface of the (110) silica in contact with liquid water. The green vertices in the 2D-MolGraph of the snapshot are now presenting the instances that were found for motif M3 in this snapshot. In this specific snapshot, 4-partner motifs such as M3 are indeed found to be present over the whole surface. Note that the two water molecules in M3 are not H-bonded together.
5 Conclusions and perspectives
This paper aimed at showing the strength of topological graphs for the analysis of molecular dynamics simulations of complex inhomogeneous solid interfaces. As shown here, the 2D-MolGraphs can easily be included in theoretical workflows for the discovery of active sites at the surface of a catalyst, as shown in Section 3. In particular, the graphs of transitions provide crucial information on the pathways connecting minima on the potential energy surface. Such information is much more challenging to extract from the MD simulations without using topological graphs for the analysis of the structures sampled along the trajectories. We believe that this shows that our methodology can be applied broadly to the design of heterogeneous catalysts, as well as for homogeneous catalysts (see our previous works21,23). The second part of this investigation showed how to extract further structural information (in the time domain and in statistics over the whole trajectory) from the 2D-MolGraphs, by the recognition of sub-graphs that are contained within the 2D-MolGraphs. We applied such a strategy to the identification of the motifs that exist between the silanols (Si–OH) that are located at the top surface of silica and the water molecules in the binding interfacial layer (BIL). As a proof-of-principle, solid–water motifs made of 2-partners, one partner being a silanol site and one partner being a water molecule in the BIL, were identified in this work. The time evolution of their occurrences was recorded, showing few differences in stability between the two identified solid–water motifs, whether water is the donor or the acceptor of H-bond with the top-surface silanols. These 2-partner motifs were shown to be homogeneously distributed in position all over the silica top-surface in a ‘1-to-1’ general patterning, i.e. each top-surface silanol being H-bonded on average to a water molecule over the whole trajectory. Also very interesting was the preliminary statistical analysis of the occurrences of all possible 2-partner motifs of size 3 (in terms of the size of the associated 2D-MolGraph of the motif that includes one oxygen of the silica top-surface and one water molecule) that showed that 4-partner motifs made of 2 H-bonded silanols and two water molecules are the most likely repeated motif over the silica surface.Overall, this investigation lays the foundations for the use of 2D-MolGraphs at heterogeneous solid interfaces with applications in the structural characterization of the aqueous interface and in chemical reactivity at the interface. More globally it lays the foundations for the possible design of materials through graphs. Indeed, in our current era of artificial intelligence, one can easily imagine recording these graphs and subgraphs in databases that could be used in conjunction with machine learning techniques to design new materials of targeted properties. This is our current research direction.
Author contributions
S. Bougueroua: programming, software development; implementation of the computer code and supporting algorithms; conceptualization; investigation; writing original draft (equal); writing – review & editing (equal). A. A. Kolganov: investigation; acquire data; formal analysis of data; writing original draft (equal); writing – review & editing (equal). C. Helain, C. Zens: programming, software development; implementation of the computer code and supporting algorithms. D. Barth: conceptualization; funding acquisition; writing – review & editing (equal). E. A. Pidko: conceptualization; funding acquisition; writing – review & editing (equal). M. P. Gaigeot: conceptualization; funding acquisition; writing original draft (lead); writing – review & editing (lead).Data availability
Data for this article will be made available at a repository https://github.com/TheorieModelisationLAMBE/bouguerouaetal_PCCP_2024_data.git. These data will include trajectories, files for the graphs, python codes that were used in order to extract the properties of the graphs discussed in the paper.Conflicts of interest
There are no conflicts to declare.Acknowledgements
E. A. P. and A. A. K. acknowledge that this work was sponsored by NWO Domain Science for the use of the national computer facilities. This work was performed using HPC resources from GENCI-France Grant 072484 (CINES/IDRIS/TGCC). C. Z., C. H., S. B., D. B., M. P. G. acknowledge financial support from the ‘Fond pour le Rayonnement de la Recherche’ (FRR) from the University of Evry Paris-Saclay.Notes and references
- A. Balaban, J. Chem. Inf. Comput. Sci., 1985, 25, 334–343 CrossRef CAS
.
- S. N. Ilemo, D. Barth, O. David, F. Quessette, M.-A. Weisser and D. Wate, PLoS One, 2019, 14, e0226680 CrossRef PubMed
.
- C. Gianfrotta, V. Reinharz, D. Barth and A. Denise, Proceedings of the 19th International Symposium on Experimental Algorithms (SEA 2021), 2021, pp. 19:1–19:18.
- D. Barth, O. David, F. Quessette, V. Reinhard, Y. Strozecki and S. Vial, 14th International Symposium on Experimental Algorithms (SEA 2015), 2015, pp. 235–246.
- A. Lamiable, F. Quessette, S. Vial, D. Barth and A. Denise, IEEE/ACM Trans. Comput. Biol. Bioinf., 2013, 10, 193–199 Search PubMed
.
- B. L. Mooney, L. R. Corrales and A. E. Clark, J. Comput. Chem., 2012, 33, 853–860 CrossRef CAS PubMed
.
- A. Ozkanlar and A. E. Clark, J. Comput. Chem., 2014, 35, 495–505 CrossRef CAS PubMed
.
- H. Lee, J. Choi, P. Verma and M. Cho, J. Phys. Chem. B, 2015, 119, 14402–14412 CrossRef CAS PubMed
.
- M. J. Servis and A. E. Clark, J. Phys. Chem. A, 2021, 125, 3986–3993 CrossRef CAS
.
- J.-H. Choi, H. Lee, H. R. Choi and M. Cho, Annu. Rev. Phys. Chem., 2018, 69, 125–149 CrossRef CAS PubMed
.
- A. E. Clark, H. Adams, R. Hernandez, A. I. Krylov, A. M. Niklasson, S. Sarupria, Y. Wang, S. M. Wild and Q. Yang, The middle science: Traversing scale in complex many-body systems, ACS Cent. Sci., 2021, 7(8), 1271–1287 CrossRef CAS
.
- Y. Wei, E. T. Nienhuis, S. T. Mergelsberg, T. R. Graham, Q. Guo, G. K. Schenter, C. I. Pearce and A. E. Clark, Chem. Commun., 2023, 59, 10400–10403 RSC
.
- D. Cole, L. Mones and G. Czanyi, Faraday Discuss., 2020, 224, 247–265 RSC
.
- M. Veit, D. Wilkins, Y. Yang, R. DiStasio and M. Ceriotti, J. Chem. Phys., 2020, 153, 024113 CrossRef CAS PubMed
.
- A. Jindal, V. Arunachalam and S. Vasudevan, J. Phys. Chem. B, 2021, 125, 5909–5919 CrossRef CAS
.
- F. Pietrucci and W. Andreoni, Phys. Rev. Lett., 2011, 107, 085504 CrossRef PubMed
.
- S. Bougueroua, R. Spezia, S. Pezzotti, S. Vial, F. Quessette, D. Barth and M.-P. Gaigeot, J. Chem. Phys., 2018, 149, 184102 CrossRef CAS PubMed
.
- Y. Aboulfath, S. Bougueroua, A. Cimas, D. Barth and M.-P. Gaigeot, J. Chem. Theor. Comput., 2024, 20, 1019–1035 CrossRef CAS PubMed
.
- S. Bougueroua, M. Bricage, Y. Aboulfath, D. Barth and M.-P. Gaigeot, Molecules, 2023, 28, 2892 CrossRef CAS
.
- S. Bougueroua, Y. Aboulfath, D. Barth and M.-P. Gaigeot, J. Mol. Phys., 2023, e2162456 CrossRef
.
- A. Hashemi, S. Bougueroua, M.-P. Gaigeot and E. A. Pidko, J. Chem. Theor. Comput., 2022, 18, 7470–7482 CrossRef CAS PubMed
.
- A. Serva, S. Pezzotti, S. Bougueroua, D. R. Galimberti and M.-P. Gaigeot, J. Mol. Struct., 2018, 1165, 71–78 CrossRef CAS
.
- A. Hashemi, S. Bougueroua, M.-P. Gaigeot and E. A. Pidko, J. Chem. Inf. Model., 2023, 63, 6081–6094 CrossRef CAS PubMed
.
- S. Bougueroua, F. Quessette, D. Barth and M.-P. Gaigeot, ChemRxiv, 2022, preprint DOI:10.26434/chemrxiv-2022-1d5x8.
- S. Pezzotti, D. Galimberti, Y. Shen and M.-P. Gaigeot, Phys. Chem. Chem. Phys., 2018, 20, 5190–5199 RSC
.
- S. Pezzotti, D. R. Galimberti and M.-P. Gaigeot, Phys. Chem. Chem. Phys., 2019, 21, 22188–22202 RSC
.
- S. Bougueroua, Y. Aboulfath, A. Cimas, A. Hashemi, A. E. Pidko, D. Barth and M.-P. Gaigeot, C. R. Chim, 2024 DOI:10.5802/crchim.317
.
-
B. D. McKay, Practical graph isomorphism, Department of Computer Science, Vanderbilt University Tennessee, US, 1981, vol. 30, ch. 2, pp. 47–87 Search PubMed
.
- J. Hutter, M. Iannuzzi, F. Schiffmann and J. VandeVondele, Wiley Interdiscip. Rev.: Comput. Mol. Sci., 2014, 4, 15–25 CAS
.
- J. VandeVondele, M. Krack, F. Mohamed, M. Parrinello, T. Chassaing and J. Hutter, Comput. Phys. Commun., 2005, 167, 103–128 CrossRef CAS
.
- S. Goedecker, M. Teter and J. Hutter, Phys. Rev. B: Condens. Matter Mater. Phys., 1996, 54, 1703–1710 CrossRef CAS PubMed
.
- J. P. Perdew, K. Burke and M. Ernzerhof, Phys. Rev. Lett., 1996, 77, 3865–3868 CrossRef CAS PubMed
.
- S. Grimme, S. Ehrlich and L. Goerigk, J. Comput. Chem., 2011, 32, 1456–1465 CrossRef CAS
.
- S. Grimme, J. Antony, S. Ehrlich and H. Krieg, J. Chem. Phys., 2010, 132, 154104 CrossRef
.
- A. D. Becke, Phys. Rev. A: At., Mol., Opt. Phys., 1988, 38, 3098–3100 CrossRef CAS PubMed
.
- C. Lee, W. Yang and R. G. Parr, Phys. Rev. B: Condens. Matter Mater. Phys., 1988, 37, 785–789 CrossRef CAS
.
- S. Grimme, J. Comput. Chem., 2006, 27, 1787–1799 CrossRef CAS
.
- S. Grimme, J. Comput. Chem., 2004, 25, 1463–1473 CrossRef CAS
.
- J. A. White, E. Schwegler, G. Galli and F. Gygi, J. Chem. Phys., 2000, 113, 4668–4673 CrossRef CAS
.
- C. Vogt and B. M. Weckhuysen, Nat. Rev. Chem., 2022, 6, 89–111 CrossRef
.
- Z. Zhang, B. Zandkarimi and A. N. Alexandrova, Acc. Chem. Res., 2020, 53, 447–458 CrossRef CAS PubMed
.
- S. R. Gathmann, M. A. Ardagh and P. J. Dauenhauer, Chem. Catal., 2022, 2, 140–163 CrossRef CAS
.
- B. R. Goldsmith, B. Peters, J. K. Johnson, B. C. Gates and S. L. Scott, ACS Catal., 2017, 7, 7543–7557 CrossRef CAS
.
- A. N. Alexandrova and A. I. Boldyrev, J. Chem. Theor. Comput., 2005, 1, 566–580 CrossRef CAS
.
- E. V. Khramenkova, M. G. Medvedev, G. Li and E. A. Pidko, J. Phys. Chem. Lett., 2021, 12, 10906–10913 CrossRef CAS
.
- D. B. Culver, R. W. Dorn, A. Venkatesh, J. Meeprasert, A. J. Rossini, E. A. Pidko, A. S. Lipton, G. R. Lief and M. P. Conley, ACS Cent. Sci., 2021, 7, 1225–1231 CrossRef CAS
.
- F. D. Cannavacciuolo, R. Yadav, A. Esper, A. Vittoria, G. Antinucci, F. Zaccaria, R. Cipullo, P. H. Budzelaar, V. Busico and G. P. Goryunov,
et al.
, Angew. Chem., Int. Ed., 2022, 61, e202202258 CrossRef CAS
.
- T. D. Kühne, M. Iannuzzi, M. Del Ben, V. V. Rybkin, P. Seewald, F. Stein, T. Laino, R. Z. Khaliullin, O. Schütt and F. Schiffmann,
et al.
, J. Chem. Phys., 2020, 152, 194103 CrossRef PubMed
.
- A. Comas-Vives, Phys. Chem. Chem. Phys., 2016, 18, 7475–7482 RSC
.
- T. P. Senftle, S. Hong, M. Islam, S. Kylasa, Y. Zheng, Y. Shin, C. Junkermeier, R. Engel-Herbert, M. Janik, H. Aktulga, T. Verstraelen, A. Grama and A. Duin, npj Comput. Mater., 2016, 54, 15011–15024 CrossRef
.
- P. Pracht, F. F. Bohle and S. Grimme, Phys. Chem. Chem. Phys., 2020, 22, 7169–7192 RSC
.
- S. Schönborn, S. Goedecker, S. Roy and A. R. Oganov, J. Chem. Phys., 2009, 130, 144108 CrossRef
.
- S. Roy, S. Goedecker and V. Hellmann, Phys. Rev. E: Stat., Nonlinear, Soft Matter Phys., 2008, 77, 056707 CrossRef PubMed
.
- M. Sulpizi, M.-P. Gaigeot and M. Sprik, J. Chem. Theor. Comput., 2012, 8, 1037–1047 CrossRef CAS PubMed
.
| This journal is © the Owner Societies 2025 |

