Kinetic insights into structure sensitivity of Ru catalyzed L-alanine hydrogenation to alaninol†
Rui
Song
a,
Chang
Yao
a,
Wenhua
Li
a,
Nihong
An
b,
Yafeng
Shen
*b,
Nina
Fei
a,
Xiaohu
Ge
a,
Yueqiang
Cao
 *ac,
Xuezhi
Duan
 a and
Xinggui
Zhou
a
aState Key Laboratory of Chemical Engineering, School of Chemical Engineering, East China University of Science and Technology, 130 Meilong Road, Shanghai 200237, China. E-mail: yqcao@ecust.edu.cn
bSino-Platinum Industrial Catalyst (Yunnan) Co., Ltd., 988 Keji Road, Kunming 650106, Yunnan, China. E-mail: shenyf@ipm.com.cn
cEngineering Research Center of Resource Utilization of Carbon-containing Waste with Carbon Neutrality, Ministry of Education, Shanghai 200237, China
First published on 17th October 2024
Abstract
Hydrogenation achieved on supported metal catalysts is normally structure sensitive, and comprehensive understanding of such sensitivity is pivotal for gaining insights into the active sites as well as the design of catalysts. Herein, a series of differently sized Ru nanoparticles supported on carbon nanotube (CNT) were prepared and employed as catalysts for L-alanine hydrogenation to examine the structure sensitivity of amino acid hydrogenation. The reaction rates for L-alanine conversion and the formation of alaninol are demonstrated to be strongly dependent on the sizes of Ru nanoparticles, highlighting the structure sensitivity of the L-alanine hydrogenation. The activation energies extracted from kinetic studies are insensitive to the sizes of Ru nanoparticles on the Ru catalysts sized ≥1.3 nm with similar electronic properties, pointing to a predominant type of active site for L-alanine hydrogenation. By further combining model calculations with the shape of Ru nanoparticles determined by transmission electron microscopy, the Ru(101) sites are identified as the dominant active sites for L-alanine conversion and alaninol formation, which is further rationalized by density functional theory calculations. The kinetic insights into such structure sensitivity are believed to be important for the design and optimization of catalysts for the reaction.
1 Introduction
Selective hydrogenation of amino acids to produce amino alcohols is a crucial process widely used in various fields such as the synthesis of chiral compounds and the development of nitrogen-containing ligands.1–5 Over the past two decades, selective hydrogenation of amino acids has emerged as a significant topic in the field of organic carboxylic acid hydrogenation.6–8 Intensive efforts have been devoted to optimizing process conditions and developing various catalysts to achieve high activity and selectivity.9–16 Despite these efforts, the hydrogenation of amino acids still requires relatively harsh hydrogen pressure conditions (>6 MPa), and the by-products such as amines inevitably form together with the target amino alcohols under such harsh conditions.15 These dilemma can be addressed by designing high-performance catalysts that facilitate selective hydrogenation of amino acids under milder conditions while maintaining high selectivity. Mechanistic understanding of the catalytic hydrogenation of amino acids, especially insights from the active sites, is essential for the design of high-performance catalysts but rarely seen in previous studies.14,16 Accordingly, it is highly necessary to carry out investigations on the mechanism of the hydrogenation of amino acids from the perspective of active sites.The particle size of active metals normally affects their catalytic performance, which is also known as the size effect.17–20 Such effects can be explained by the fact that the changes in particle size alter the geometric and electronic structures of the active sites.21–24 For instance, it was reported that Rh/CeO2 catalysts with smaller Rh particle sizes exhibit higher conversion of CO2 but lower selectivity to methane for CO2 hydrogenation,25 which was attributed to fewer Rh sites for H2 adsorption and activation as compared with those of larger sized Rh catalysts. Another example is the Ir-catalyzed n-butane dehydrogenation, which is also demonstrated to be highly sensitive to the size of Ir species.26 Downsizing the active Ir species is favorable for the adsorption/activation of butane and the desorption of butene and thus remarkably enhances the activity and butene selectivity in n-butane dehydrogenation. These understandings of structure sensitivity provide insightful guidance for designing high-performance catalysts for reactions.
As Prof. Boudart, a pioneer in kinetics, asserted, catalysis is fundamentally a kinetic phenomenon.27 Therefore, a comprehensive understanding of structure sensitivity from a kinetics perspective can provide deeper insights into the correlation between structure and kinetic behavior.25,26,28–32 As inspired, a kinetics-assisted method was proposed in our previous studies to understand the structure sensitivities for various catalytic reactions, including the selective oxidation of glycerol as well as the hydrogenation of acetylene and dimethyl oxalate.33–40 These kinetic understandings of the structure sensitivity gained considerable insights into the catalysis at the level of active sites, which are of significance for the design and optimization of catalysts. Following these previous studies, it is meaningful to try this method aiming to understand the hydrogenation of amino acids at the level of active sites. However, a careful survey on the literature for the hydrogenation of amino acids shows that the structure sensitivity was rarely reported.
Herein, a series of carbon nanotube (CNT) supported Ru nanoparticles with different particle sizes but similar electronic properties were synthesized via the incipient wetness impregnation method by adjusting the Ru loadings and employed as catalysts for the hydrogenation of amino acids to amino alcohols, which is exemplified here with the hydrogenation of L-alanine to alaninol. Catalytic performance tests and kinetic experiments reveal that the hydrogenation of L-alanine is a typical structure-sensitive reaction. Kinetic parameters were subsequently extracted from the time sequence plots of L-alanine and alaninol at different temperatures to reveal the size-dependent kinetic behaviors according to the kinetics-assisted method. By further combining model calculations with the shape of Ru nanoparticles determined by transmission electron microscopy, the dominant active sites for the hydrogenation of L-alanine to alaninol were identified for the Ru/CNT catalysts. Density functional theory calculations were finally carried out to rationalize the dominant active sites for the reaction. These kinetic insights into the size-dependent catalytic performance for L-alanine hydrogenation to alaninol are believed to provide valuable guidance for the design and optimization of metal catalysts for the hydrogenation of amino acids.
2 Experimental section
2.1 Materials
The CNT (Beijing Cnano Technology Ltd.) was utilized as the catalyst support, while ruthenium(III) chloride (99.95%, Shanghai Macklin Biochemical Co., Ltd.) served as the active metal precursor. L-Alanine (>99%, Shanghai Aladdin Biochemical Technology Co., Ltd.) and ultrapure water were employed as the reactant and solvent, respectively. The ultrapure water, characterized by a resistivity of 18.4 MΩ cm, was produced using the Hitech Master Touch-S system. Sodium acetate (99.99%, Shanghai Boer Chemical Reagent Co., Ltd.), acetonitrile (99.9%, HPLC grade, Beijing Vokai Biotechnology Co., Ltd.), methanol (99.9%, HPLC grade, Thermo-Fisher), and ultrapure water were used as mobile phase additives.2.2 Preparation of Ru/CNT catalysts
Ru/CNT catalysts were prepared using the incipient wetness impregnation method. Prior to impregnation, the CNT was boiled in deionized water for 12 hours. After boiling, the water was removed by filtration, and the resulting filter cake was dried at 120 °C for 12 hours. The saturated water absorption capacity of the CNT was determined as follows: 1 g of CNT was placed in a crucible, and the combined mass of the crucible, CNT, and a stirring glass rod was recorded as m1. Ultrapure water was then added incrementally to the crucible with continuous stirring, allowing the water to penetrate and adsorb onto the CNT. The saturated water absorption point was identified when the CNT exhibited a slight sheen. The total mass after stirring was recorded as m2, and the saturated water absorption capacity of the CNT was calculated as m2 − m1. Ruthenium(III) chloride was dissolved in ultrapure water to prepare a ruthenium precursor solution of the desired concentration. The solution, adjusted to achieve nominal loadings of 1, 3, 5, and 10 wt%, was further diluted with ultrapure water to match the saturated water absorption capacity of the CNT. Typically, 1 g of pretreated CNT was placed into a crucible, and the diluted precursor solution was added dropwise while continuously stirring with a glass rod to ensure complete dispersion of the CNT. The impregnated CNT were then aged at room temperature for 12 hours and subsequently dried at 120 °C for 12 hours. Following this, all the samples were reduced using H2 at a flow rate of 50 mL min−1 and a temperature of 250 °C for 2 hours according to the hydrogen temperature-programmed reduction (H2-TPR) results (Fig. S1†).2.3 Characterization
Transmission electron microscopy (TEM) and high-angle annular dark-field scanning transmission electron microscopy (HAADF-STEM) images were acquired using a JEOL JEM-F200. High-resolution transmission electron microscopy (HRTEM) was employed to observe the morphology and lattice fringes of Ru particles. X-ray photoelectron spectroscopy (XPS) data were acquired with a Thermo Fisher ESCALAB 250Xi equipped with an Al Kα source. X-ray powder diffraction (XRD) patterns were measured using a Rigaku 2500 VB/PC with a Cu Kα radiation source (λ = 1.541 Å) at a scanning rate of 12° min−1 over a 2θ range of 10–80°. Hydrogen temperature-programmed reduction (H2-TPR) was performed on a Micromeritics Autochem 2920 chemisorption instrument, equipped with a thermal conductivity detector. 0.1 g of the catalyst sample was placed in a quartz U-tube reactor and reduced under a 5% v/v H2/Ar mixture at a flow rate of 30 mL min−1, with the temperature increasing from 50 °C to 800 °C at a rate of 10 °C min−1.2.4 L-Alanine hydrogenation tests
The hydrogenation of L-alanine was carried out in a high-pressure reactor equipped with a 100 mL Teflon liner. The reactor was charged with 30 mL of ultrapure aqueous L-alanine solution and a specified amount of catalyst. The reactor was then purged with argon several times to remove residual air. Once the reactor temperature stabilized at the target value, hydrogen (H2) was introduced to a pressure of 4 MPa, and stirring was initiated at a rate of 800 rpm to ensure efficient mass transfer (Fig. S2†). At predetermined intervals (120, 180, 240, 300, 360, 420, and 480 minutes), stirring was stopped, hydrogen was vented, and the reactor was purged with argon to protect the reaction mixture. After cooling to room temperature, 1.0 mL samples were extracted for analysis using a Waters ultrahigh-performance liquid chromatograph equipped with a photodiode array (PDA) detector. Prior to detection, the reaction solution was derivatized with phenyl isothiocyanate (PITC) to facilitate the detection of reactants and products. The chromatography was performed on an Agilent ZORBAX SB-C18 column with a mobile phase consisting of sodium acetate aqueous solution (25 mM)![[thin space (1/6-em)]](https://www.rsc.org/images/entities/char_2009.gif) :
:![[thin space (1/6-em)]](https://www.rsc.org/images/entities/char_2009.gif) acetonitrile
acetonitrile![[thin space (1/6-em)]](https://www.rsc.org/images/entities/char_2009.gif) :
:![[thin space (1/6-em)]](https://www.rsc.org/images/entities/char_2009.gif) methanol in a ratio of 75
methanol in a ratio of 75![[thin space (1/6-em)]](https://www.rsc.org/images/entities/char_2009.gif) :
:![[thin space (1/6-em)]](https://www.rsc.org/images/entities/char_2009.gif) 15
15![[thin space (1/6-em)]](https://www.rsc.org/images/entities/char_2009.gif) :
:![[thin space (1/6-em)]](https://www.rsc.org/images/entities/char_2009.gif) 10, a flow rate of 0.6 mL min−1, and a detection wavelength of 254 nm.
10, a flow rate of 0.6 mL min−1, and a detection wavelength of 254 nm.
2.5 Theoretical calculations
All density functional theory (DFT) calculations were conducted using the Vienna ab initio simulation package (VASP) with a cut-off energy of 450 eV projector-augmented wave (PAW).41 The exchange–correlation functionals were described by the generalized gradient approximation (GGA) proposed by Perdew–Burke–Ernzerhof (PBE).42 The Ru(101), Ru(001), and Ru(111) surfaces were modelled using a p(2 × 2) supercell with four atomic layers. The top two layers were relaxed, while the bottom two layers were fixed. A 20 Å of vacuum layer was built to separate each slab surface from the next one in the z-direction to rule out the possible interaction between them. A 3 × 3 × 1 K-point grid was employed for Brillouin zone integration. Geometry optimization was carried out until the forces on each atom were reduced below 0.05 eV Å−1 and the total energy differences were less than 10−5 eV. The adsorption energy of the adsorbate on the surface is calculated as:| Eads = Eadsorbate/surface − Eadsorbate − Esurface | (1) |
3 Results and discussion
3.1 Structure of differently sized Ru/CNT catalysts
The Ru/CNT catalysts were prepared using the incipient wetness impregnation method, where Ru loadings were adjusted from 1 wt% to 10 wt% to tune the sizes of Ru nanoparticles. The morphologies of the as-prepared Ru/CNT catalysts with various Ru loadings were characterized by using HAADF-STEM. As shown in Fig. 1a–d, the Ru nanoparticles are well dispersed on the supports, but the particle sizes are clearly different for these synthesized Ru/CNT catalysts with Ru loadings ranging from 1 wt% to 10 wt%. To quantitatively analyze the difference in the sizes of Ru nanoparticles, over 200 nanoparticles were counted and measured to yield histograms of particle size distributions for these Ru/CNT catalysts. As reported in the insets of Fig. 1a–d, the average sizes of Ru nanoparticles are determined to be 1.3, 1.7, 2.2 and 2.5 nm, based on which these catalysts are named as 1.3-Ru/CNT, 1.7-Ru/CNT, 2.2-Ru/CNT and 2.5-Ru/CNT, respectively.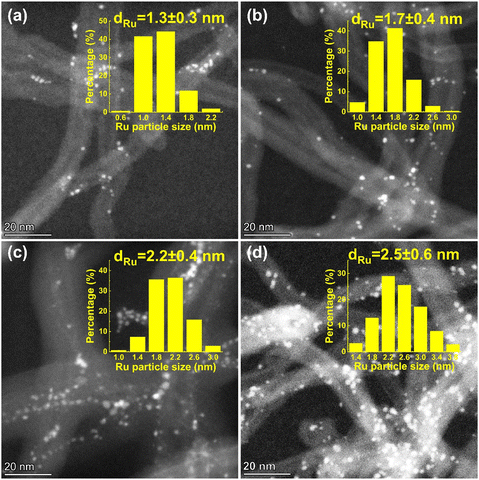 | ||
| Fig. 1 Typical HAADF-STEM images of (a) 1.3-Ru/CNT, (b) 1.7-Ru/CNT, (c) 2.2-Ru/CNT and (d) 2.5-Ru/CNT catalysts. The corresponding histograms of particle size distributions are shown in the insets. | ||
In addition, the crystallographic structures of these catalysts were further explored by XRD techniques. The XRD patterns of the 1.3-Ru/CNT, 1.7-Ru/CNT and 2.2-Ru/CNT catalysts in Fig. 2a only show two diffraction peaks at 26.6° and 44.0° attributed to the diffraction peaks of the (002) and (101) planes of the CNT support (JCPDS No. 65-6212), respectively, and the peaks of the Ru phase are absent, suggesting a high dispersion of tiny Ru nanoparticles on the CNT support. In contrast, the XRD pattern of the 2.5-Ru/CNT catalyst exhibits a subtle peak located at 38.4° corresponding to the (100) plane of the hexagonal close-packed (hcp) Ru phase (JCPDS No. 06-0663) in addition to the peaks of CNT, which could be associated with the presence of some large sized Ru nanoparticle on the 2.5-Ru/CNT catalyst as revealed by the HAADF-STEM image in Fig. 1d. The electronic properties of these differently sized Ru/CNT catalysts were further investigated by XPS measurements. It should be noted that the XPS spectrum of Ru 3d is overlapped with that of C 1s,43,44 and thus the Ru 3p XPS spectra are selected here for analyzing the electronic properties of these Ru/CNT catalysts to avoid the interference from such overlap. As illustrated in Fig. 2b, the Ru 3p spectra exhibit signals from Ru0 and Ru4+ species, and the intensities of these signals become stronger with increasing Ru loading. Notably, the Ru 3p XPS spectra of these differently sized Ru/CNT catalysts almost locate at similar positions. Deconvolutions were also performed for these collected Ru 3p XPS spectra, and four peaks were deconvoluted from the original spectrum for each catalyst. The peaks located at 462.6 and 467.6 eV correspond to Ru0 3p3/2 and Ru4+ 3p3/2, respectively, while those at 484.9 and 488.9 eV are assigned to Ru0 3p1/2 and Ru4+ 3p1/2.43 The presence of minor Ru4+ species in the XPS spectra could be caused by the ex situ measurements that partially re-oxidized some surface Ru0 of Ru nanoparticles. Clearly, these XPS peaks of Ru species all locate at similar positions, which unequivocally indicate the similar electronic properties of these differently sized Ru/CNT catalysts.
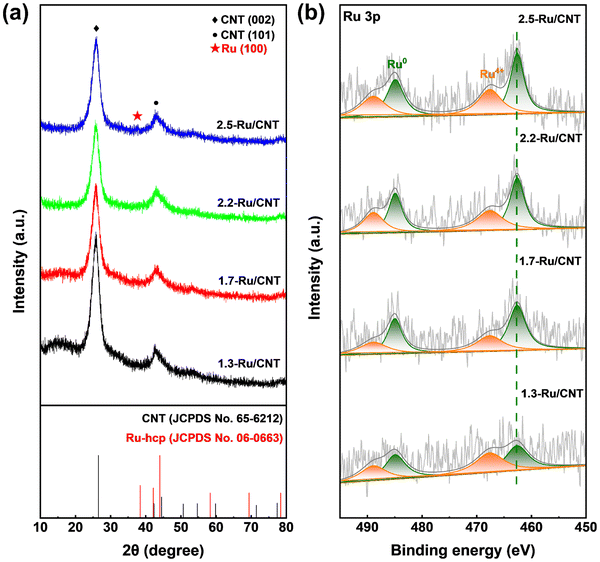 | ||
| Fig. 2 (a) XRD patterns and (b) Ru 3p XPS spectra of 1.3-Ru/CNT, 1.7-Ru/CNT,2.2-Ru/CNT and 2.5-Ru/CNT catalysts. | ||
3.2 Kinetics of L-alanine hydrogenation to alaninol
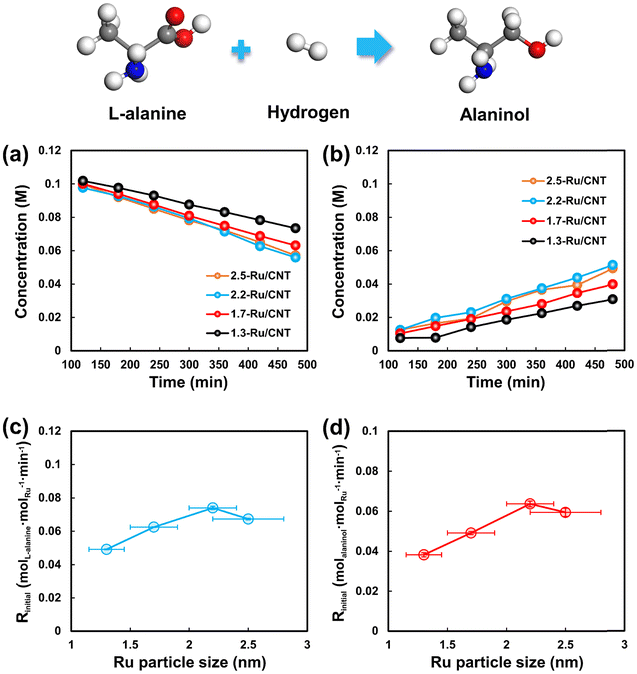
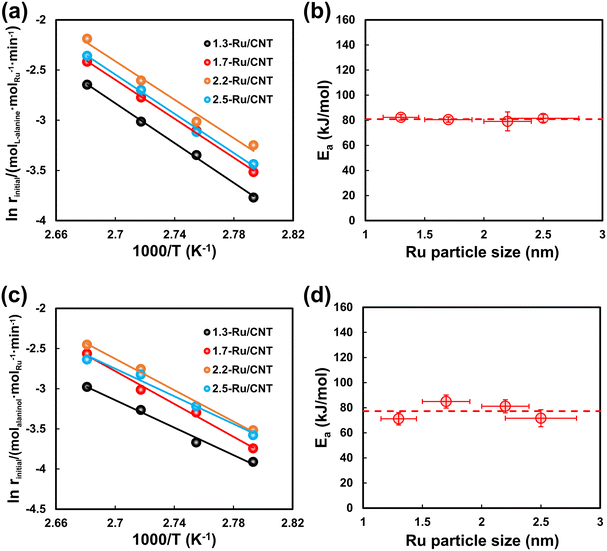
Kinetic tests for L-alanine hydrogenation on Ru/CNT catalysts with different sizes of Ru nanoparticles were carried out at different temperatures under 4 MPa of H2. The evolution of L-alanine and alaninol with the reaction time at 95 °C is selected as an example scenario to show in Fig. 3a and b. The concentration of L-alanine decreases gradually with time over the differently sized Ru/CNT catalysts, and that of alaninol increases with time. Notably, the concentrations of L-alanine and alaninol show linear relationships with the reaction time during the initial period, especially at the L-alanine conversion less than 30%. Further linear fitting analysis for the varying concentration of L-alanine yields the conversion rate of L-alanine on these catalysts, and the results reported in Fig. 3c demonstrate that the conversion rate of L-alanine decreases in the order of 2.2-Ru/CNT > 2.5-Ru/CNT > 1.7-Ru/CNT > 1.3-Ru/CNT. Also, the formation rates of alaninol were also obtained by the linear fitting analysis for the alaninol concentration varying with time. As shown in Fig. 3d, the obtained formation rate of alaninol also decreases in the order of 2.2-Ru/CNT > 2.5-Ru/CNT > 1.7-Ru/CNT > 1.3-Ru/CNT. The evolution of L-alanine and alaninol at 85, 90 and 100 °C is further shown in Fig. S3–S7,† which demonstrate similar results over the differently sized Ru/CNT catalysts. The determined reaction rates for L-alanine conversion and alaninol formation at these temperatures exhibit similar trends seen at 95 °C (Tables S1 and S2†). These strongly dependent performances for L-alanine hydrogenation on the Ru particle size indicate that the hydrogenation of L-alanine is structure sensitive.The calculated reaction rates for L-alanine conversion, i.e., Rinitial, at different temperatures were then plotted as a function of temperature in Fig. S8.† Clearly, the Rinitial values for L-alanine conversion on all these Ru/CNT catalysts almost linearly increase with increasing temperature. Further correlation of the Rinitial values with the reciprocal of absolute temperature (1/T) demonstrates a good linear relationship, which is known as the Arrhenius plot (Fig. 4a). Based on these plots, the activation energy (Ea) for L-alanine conversion over these catalysts is derived via linear regression, and then plotted against the Ru particle size in Fig. 4b. The activation energies for L-alanine conversion on the 1.3-Ru/CNT, 1.7-Ru/CNT, 2.2-Ru/CNT and 2.5-Ru/CNT catalysts are determined to be 82.3, 80.5, 79.1 and 81.6 kJ mol−1, respectively, which shows that the activation energies are very close. Furthermore, the Arrhenius plots for alaninol formation were also obtained as those for the L-alanine conversion (Fig. 4c). The activation energies for the alaninol formation over these Ru/CNT catalysts were derived from these plots and shown as a function of the Ru particle size in Fig. 4d. The activation energies for the formation of alaninol on the 1.3-Ru/CNT, 1.7-Ru/CNT, 2.2-Ru/CNT and 2.5-Ru/CNT catalysts are 71.2, 84.9, 81.1 and 71.6 kJ mol−1, respectively, which show very little difference. These close values seen with the differently sized Ru/CNT catalysts indicate that the activation energies for the L-alanine conversion and alaninol formation are nearly size insensitive.
3.3 Active sites for L-alanine hydrogenation to alaninol
The above kinetic results clearly show that the Ru-catalyzed hydrogenation of L-alanine to alaninol is a structure-sensitive reaction. Explanation for structure sensitivity typically arises from changes in the electronic and geometric structures associated with variations in Ru particle size. As revealed by the XPS analysis, the electronic structures of these differently sized Ru/CNT catalysts are very similar (Fig. 2b), and thus the structure sensitivity should be mainly caused by the geometric structures. Indeed, the variation in Ru particle size would change the fraction of different types of sites exposed on the surface of the Ru nanoparticle, such as the edge, corner and terrace sites. These different types of sites distinguish the coordination number and thus would exhibit different catalytic performances. In principle, the catalytic performance of the Ru catalysts depends on the overall contribution of these different types of sites. Correspondingly, the activation energy for L-alanine conversion can be calculated with the following equation which considers the overall contribution of each type of active site,33,35,37,39 | (2) |
 | (3) |
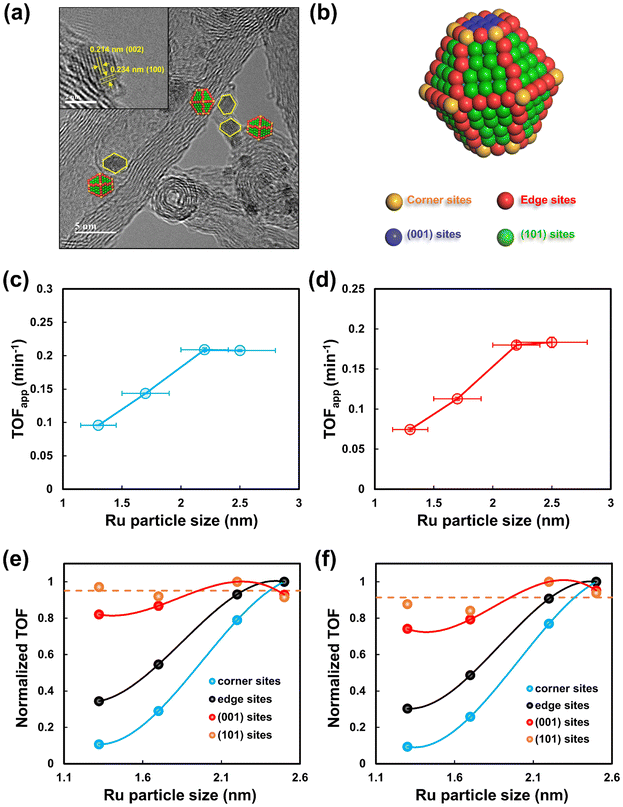
To further gain insights into the dominant active sites for the hydrogenation of L-alanine to alaninol, the types and numbers of surface Ru sites were quantified for these differently sized Ru/CNT catalysts. Based on the method proposed in our previous studies,33–37,39 the morphologies of Ru nanoparticles supported on CNT were characterized by HRTEM measurements. As depicted in Fig. 5a, two types of lattice fringes with lattice spacings of 0.214 and 0.234 nm corresponding to the (002) and (100) planes of the Ru hexagonal close-packed phase, respectively, are clearly seen from the typical HRTEM image. The shape of Ru nanoparticles is demonstrated to be a truncated hexagonal bipyramid, as schematically illustrated in Fig. 5b, which was also reported in other studies.34,45 The Ru nanoparticles shaped in truncated hexagonal bipyramids expose corner, edge, (001) and (101) sites. According to the shape model, the fractions and numbers of these sites were calculated with the method proposed by Van Hardeveld and Hartog.46 Detailed computations and modeling are presented in the ESI.† Fig. S9† shows the plots of calculated fractions of different types of sites with the Ru particle size, where the fractions of corner and edge sites decrease gradually while the fractions of terrace sites, i.e., the (001) and (101) increase with increasing Ru particle size. The numbers of each type of active site per mole of Ru exhibit similar trends with increasing Ru particle sizes (Fig. S10†).
Based on the calculated number of all the types of surface Ru sites, the apparent turnover frequencies (TOFapp) for the L-alanine conversion and alaninol formation over differently sized Ru/CNT catalysts were derived from the initial reaction rates. The plots of calculated TOFapp values as a function of the Ru particle size are presented in Fig. 5c and d. The TOFapp for the conversion of L-alanine increases from 0.096 min−1 to 0.209 min−1 with the Ru particle size increasing from 1.3 to 2.2 nm, and slightly decreases subsequently with the Ru particle size further increasing to 2.5 nm. The TOFapp for the alaninol formation shows a similar variation trend with the Ru particle size. The observed correlation between the TOFapp and Ru particle size is similar to the variation of the number of the (101) sites with the Ru particle size, implying that this type of terrace site may serve as the dominant active site for the hydrogenation of L-alanine.
Considering that if one type of active site dominates the reaction, the reaction rate in terms of TOF should remain constant for the differently sized Ru/CNT catalysts. Along this line, the TOFs based on the estimated number of each type of surface site were calculated for these Ru/CNT catalysts, and then the TOFs based on each type of surface site were normalized according to the corresponding maximum by
 | (4) |
DFT calculations were further performed to gain theoretical evidence for the discriminated active sites dominating the hydrogenation of L-alanine to alaninol. Since the adsorption behaviors of the reactant normally dominate the activity and selectivity of hydrogenation,47,48 the adsorption of L-alanine and alaninol was studied by DFT calculations here. As schematically shown in Fig. S11,† the Ru(001) and Ru(101) surfaces can well represent the well-coordinated terrace sites, and the Ru(111) surface captures the features of the under-coordinated corner and edge sites. The adsorption of L-alanine and alaninol on the Ru(001), Ru(101) and Ru(111) surfaces was thus studied. Fig. 6a shows the adsorption energies and configurations of L-alanine on these three surfaces. Clearly, the adsorption of L-alanine on the Ru(101) surface is much stronger than that on the Ru(001) and Ru(111) surfaces, which suggests that the activation of L-alanine on the Ru(101) sites is more favorable than that on other types of sites. In addition, the theoretical calculations for the adsorption of hydrogen on these three Ru surfaces reveal that hydrogen prefers to dissociate on the Ru(101) surface with an adsorption energy of −1.32 eV (Fig. S12†), which is much favorable than those on the Ru(001) and Ru(111) surfaces. These theoretical results rationalize that the Ru(101) sites serve as the dominant active sites for the L-alanine hydrogenation demonstrated by our kinetic studies. Notably, the adsorption of alaninol on the Ru surfaces is much weaker than that of L-alanine (Fig. 6b), suggesting that the desorption of the formed alaninol from the catalyst would be promoted by the competitive adsorption between L-alanine and alaninol. More specifically, the difference between the adsorption energies of alaninol and L-alanine on the Ru(101) surfaces is more prominent than other Ru surfaces, which could also provide an explanation for the Ru(101) sites being the dominant active sites for the alaninol formation.
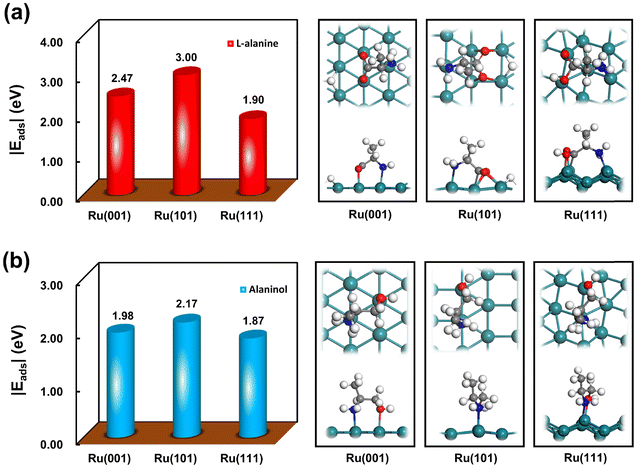 | ||
| Fig. 6 Adsorption energies and configurations of (a) L-alanine and (b) alaninol on the Ru(001), Ru(101) and Ru(111) surfaces. | ||
4 Conclusions
In summary, a series of Ru/CNT catalysts with Ru particle size ranging from 1.3 to 2.5 nm were successfully synthesized for the hydrogenation of L-alanine to alaninol. These differently sized Ru/CNT catalysts are shown to have similar electronic properties. Catalytic tests and kinetic experiments reveal that the reaction rates for both L-alanine conversion and alaninol formation over the Ru/CNT catalysts are highly sensitive to the Ru particle size, indicating that the L-alanine hydrogenation is a typical structure-sensitive reaction. The activation energies for L-alanine conversion and alaninol formation extracted from time-resolved profiles of L-alanine and alaninol at different temperatures are independent of the Ru particle size, which imply that only one type of active site dominates the reaction. Model calculations based on the truncated hexagonal bipyramid shape for Ru nanoparticles determined by HRTEM demonstrate the Ru(101) sites as the dominant active sites for both L-alanine conversion and alaninol formation on Ru catalysts. The size-dependent kinetic behaviors are finally rationalized by DFT calculations for the adsorption of the L-alanine and alaninol on the Ru(101), Ru(001) and Ru(111) surfaces. These findings are valuable for guiding the design and optimization of high-performance Ru-based catalysts for the hydrogenation of amino acids.Data availability
All relevant data are within the manuscript and its additional files.Conflicts of interest
The authors declare no competing financial interests.Acknowledgements
This work was financially supported by the Natural Science Foundation of China (22332003, 22478106 and 22178100), Shanghai Rising-star Program (23QA1401900), Shanghai Science and Technology Innovation Action Plan (22JC1403800), Program of Shanghai Academic/Technology Research Leader (21XD1421000), Young Elite Scientists Sponsorship Program by CAST (2023QNRC001), Open Project of Yunnan Precious Metals Laboratory Co., Ltd (YPML-2023050272), and Postdoctoral Fellowship Program of CPSF under Grant Number GZB20240222.Notes and references
- N. Singh, A. A. Dar and A. Kumar, ChemistrySelect, 2018, 3, 13675–13681 CrossRef CAS.
- T. Niemi, I. Fernández, B. Steadman, J. K. Mannisto and T. Repo, Chem. Commun., 2018, 54, 3166–3169 RSC.
- H. A. Rudbari, N. Kordestani, J. V. Cuevas-Vicario, M. Zhou, T. Efferth, I. Correia, T. Schirmeister, F. Barthels, M. Enamullah, A. R. Fernandes and N. Micale, New J. Chem., 2022, 46, 6470–6483 RSC.
- F. Kallmeier, B. Dudziec, T. Irrgang and R. Kempe, Angew. Chem., Int. Ed., 2017, 56, 7261–7265 CrossRef CAS.
- O. Botezat, J. Van Leusen, V. Ch. Kravtsov, P. Kögerler and S. G. Baca, Inorg. Chem., 2017, 56, 1814–1822 CrossRef CAS.
- R. Qu, K. Junge and M. Beller, Chem. Rev., 2023, 123, 1103–1165 CrossRef CAS.
- M. Tamura, Y. Nakagawa and K. Tomishige, Asian J. Org. Chem., 2020, 9, 126–143 CrossRef CAS.
- L. Karam and C. N. Neumann, ChemCatChem, 2022, 14, e202200953 CrossRef CAS.
- F. T. Jere, D. J. Miller and J. E. Jackson, Org. Lett., 2003, 5, 527–530 CrossRef CAS.
- J. E. Holladay, T. A. Werpy and D. S. Muzatko, Appl. Biochem. Biotechnol., 2004, 115, 0857–0870 CrossRef.
- K. P. Pimparkar, D. J. Miller and J. E. Jackson, Ind. Eng. Chem. Res., 2008, 47, 7648–7653 CrossRef CAS.
- P. S. Metkar, M. A. Scialdone and K. G. Moloy, Green Chem., 2014, 16, 4575–4586 RSC.
- M. Tamura, R. Tamura, Y. Takeda, Y. Nakagawa and K. Tomishige, Chem. Commun., 2014, 50, 6656 RSC.
- M. Tamura, R. Tamura, Y. Takeda, Y. Nakagawa and K. Tomishige, Chem. – Eur. J., 2015, 21, 3097–3107 CrossRef CAS PubMed.
- A. Vandekerkhove, L. Claes, F. De Schouwer, C. Van Goethem, I. F. J. Vankelecom, B. Lagrain and D. E. De Vos, ACS Sustainable Chem. Eng., 2018, 6, 9218–9228 CrossRef CAS.
- C. Kaku, S. Suganuma, K. Nakajima, E. Tsuji and N. Katada, ChemCatChem, 2022, 14, e202200399 CrossRef CAS.
- G. C. Bond, Surf. Sci., 1985, 156, 966–981 CrossRef CAS.
- A. K. Datye, Q. Xu, K. C. Kharas and J. M. McCarty, Catal. Today, 2006, 111, 59–67 CrossRef CAS.
- C. Hu, M. Shao, M. Xiang, S. Li and S. Xu, React. Chem. Eng., 2020, 5, 87–100 RSC.
- O. E. Brandt Corstius, M. Kikkert, S. T. Roberts, E. J. Doskocil, J. E. S. Van Der Hoeven and P. E. De Jongh, React. Chem. Eng., 2024, 9, 1726–1738 RSC.
- V. Subramanian, E. E. Wolf and P. V. Kamat, J. Am. Chem. Soc., 2004, 126, 4943–4950 CrossRef CAS.
- J. Zhu, G. Zhang, W. Li, X. Zhang, F. Ding, C. Song and X. Guo, ACS Catal., 2020, 10, 7424–7433 CrossRef CAS.
- B. Coq and F. Figueras, Coord. Chem. Rev., 1998, 178–180, 1753–1783 CrossRef CAS.
- K. J. J. Mayrhofer, B. B. Blizanac, M. Arenz, V. R. Stamenkovic, P. N. Ross and N. M. Markovic, J. Phys. Chem. B, 2005, 109, 14433–14440 CrossRef CAS.
- W. Liao, M. Yue, J. Chen, Z. Wang, J. Ding, Y. Xu, Y. Bai, X. Liu, A. Jia, W. Huang and Z. Zhang, ACS Catal., 2023, 13, 5767–5779 CrossRef CAS.
- X. Chen, X. Qin, Y. Jiao, M. Peng, J. Diao, P. Ren, C. Li, D. Xiao, X. Wen, Z. Jiang, N. Wang, X. Cai, H. Liu and D. Ma, Nat. Commun., 2023, 14, 2588 CrossRef CAS.
- M. Boudart, Catal. Lett., 1988, 1, 21–25 CrossRef CAS.
- K. Murata, J. Ohyama, Y. Yamamoto, S. Arai and A. Satsuma, ACS Catal., 2020, 10, 8149–8156 CrossRef CAS.
- J. Chen, J. Zhong, Y. Wu, W. Hu, P. Qu, X. Xiao, G. Zhang, X. Liu, Y. Jiao, L. Zhong and Y. Chen, ACS Catal., 2020, 10, 10339–10349 CrossRef CAS.
- Q. Guan, C. Zhu, Y. Lin, E. I. Vovk, X. Zhou, Y. Yang, H. Yu, L. Cao, H. Wang, X. Zhang, X. Liu, M. Zhang, S. Wei, W.-X. Li and J. Lu, Nat. Catal., 2021, 4, 840–849 CrossRef CAS.
- Z. Zeng, J. Xing, L. Bonville, D. R. Dekel, R. Maric and S. Bliznakov, Int. J. Hydrogen Energy, 2024, 52, 1180–1191 CrossRef CAS.
- V.-L. Yfanti, D. Ipsakis and A. A. Lemonidou, React. Chem. Eng., 2018, 3, 559–571 RSC.
- W. Chen, J. Ji, X. Feng, X. Duan, G. Qian, P. Li, X. Zhou, D. Chen and W. Yuan, J. Am. Chem. Soc., 2014, 136, 16736–16739 CrossRef CAS.
- W. Fu, W. Chen, G. Qian, D. Chen, W. Yuan, X. Zhou and X. Duan, React. Chem. Eng., 2019, 4, 316–322 RSC.
- Y. Cao, W. Fu, Z. Sui, X. Duan, D. Chen and X. Zhou, Ind. Eng. Chem. Res., 2019, 58, 1888–1895 CrossRef CAS.
- M. Pan, J. Wang, W. Fu, B. Chen, J. Lei, W. Chen, X. Duan, D. Chen, G. Qian and X. Zhou, Green Energy Environ., 2020, 5, 76–82 CrossRef.
- C. Hao, J. Gan, Y. Cao, W. Luo, W. Chen, G. Qian, X. Zhou and X. Duan, Catal. Today, 2021, 364, 157–163 CrossRef CAS.
- G. Dong, Z. Luo, Y. Cao, S. Zheng, J. Zhou, W. Li and X. Zhou, J. Catal., 2021, 401, 252–261 CrossRef CAS.
- Y. Chen, X. Ge, Y. Cao, C. Yao, J. Zhang, G. Qian, X. Zhou and X. Duan, Ind. Eng. Chem. Res., 2022, 61, 6427–6435 CrossRef CAS.
- C. Yao, W. Li, Y. Cao, X. Ge, Z. Yang, G. Qian, X. Zhou and X. Duan, J. Catal., 2023, 421, 162–171 CrossRef CAS.
- G. Kresse and J. Furthmüller, Phys. Rev. B: Condens. Matter Mater. Phys., 1996, 54, 11169–11186 CrossRef CAS PubMed.
- J. P. Perdew, K. Burke and M. Ernzerhof, Phys. Rev. Lett., 1996, 77, 3865–3868 CrossRef CAS.
- D. Zhang, Z. Wang, X. Wu, Y. Shi, N. Nie, H. Zhao, H. Miao, X. Chen, S. Li, J. Lai and L. Wang, Small, 2022, 18, 2104559 CrossRef CAS PubMed.
- J. Wu, W. Lang, H. Li, K. Du, J. Deng, S. Zhao, W. Zhang, Z. Peng and Z. Liu, ACS Sustainable Chem. Eng., 2023, 11, 14960–14968 CrossRef CAS.
- M. Ye, Y. Li, Z. Yang, C. Yao, W. Sun, X. Zhang, W. Chen, G. Qian, X. Duan, Y. Cao, L. Li, X. Zhou and J. Zhang, Angew. Chem., 2023, 135, e202301024 CrossRef.
- R. Van Hardeveld and F. Hartog, Surf. Sci., 1969, 15, 189–230 CrossRef CAS.
- C. Yao, W. Li, Y. Li, Y. Cao, J. Zhang, G. Qian, X. Zhou and X. Duan, AIChE J., 2024, 70, e18278 CrossRef CAS.
- C. Yao, W. Li, X. Ge, Y. Shi, Y. Cao, D. Chen, X. Zhou and X. Duan, ChemCatChem, 2024, 16, e202400027 CrossRef CAS.
Footnote |
| † Electronic supplementary information (ESI) available. See DOI: https://doi.org/10.1039/d4re00420e |
| This journal is © The Royal Society of Chemistry 2025 |

