Frozen-solution magnetisation dynamics of hexanuclear oxime-based MnIII Single-Molecule Magnets†
Ross
Inglis
a,
Jesper
Bendix
b,
Theis
Brock-Nannestad
b,
Høgni
Weihe
b,
Euan K.
Brechin
*a and
Stergios
Piligkos
*b
aSchool of Chemistry, The University of Edinburgh, West Mains Road, Edinburgh, EH9 3JJ, UK. E-mail: ebrechin@staffmail.ed.ac.uk; Fax: (+44)131-650-6453
bDepartment of Chemistry, University of Copenhagen, Universitetsparken 5, 2100, Copenhagen, Denmark. E-mail: piligkos@kiku.dk; Fax: (+45)3532-0133
First published on 27th August 2010
Abstract
Frozen solution SQUID measurements of the hexanuclear Single-Molecule Magnets [Mn6O2(Et-sao)6(EtOH)6(Me2benz)2] (1) and [Mn6O2(Et-sao)6(EtOH)4(H2O)2(benz)2] (2) allow the molecular and solid state contributions to the magnetic properties to be quantified.
Introduction
During the last two decades it has been shown that single molecules can display superparamagnetic-like behaviour at low temperatures. Molecules displaying such behaviour have been termed Single-Molecule Magnets (SMMs).1 SMM behaviour is ascribed to a potential energy barrier to the reorientation of the spin, leading to magnetic hysteresis with respect to the application of an external magnetic field. SMMs have also been shown to display quantum phenomena such as macroscopic quantum tunnelling of the magnetisation (QTM),2 Berry phase interference,3 quantum fluctuations of the total spin,4 and quantum coherence.5To date, all this fascinating physics has been extensively studied and quantitatively understood in the solid state for bulk materials or single crystals.6 However, the ultimate proof that SMM behaviour is in fact a molecular effect has been brought by magnetisation7 and magneto-circular dichroism8 (MCD) studies on frozen solutions of a carboxylate bridged dodecanuclear mixed-valence Mn cage, known as Mn12,1,9 where it was shown that slow relaxation of the magnetisation persists in solution.7,8 Despite the importance of studying the spin dynamics of SMMs in solution for the quantitative understanding of SMM behaviour, only a few SMM solution studies have been reported since these pioneering studies. These concern further MCD and magnetisation studies on Mn12,10,11 high-frequency Electron Paramagnetic Resonance (HF-EPR) studies on Mn12,12 pulsed EPR studies on a tetranuclear Fe(III) SMM,5 HF-EPR studies on a tetranuclear Ni(II) SMM,13 MCD studies on a mononuclear Tb(III) SMM,14 and magnetisation studies on monometallic Co(II) SMMs.15 The absence of solution studies on SMMs other than the above mentioned examples is rather surprising.
For SMM properties to form the basis of technological applications it is a prerequisite that the molecules are positioned on a surface in order to be individually addressed and manipulated. To date, it has not been clearly established if magnetic molecules deposited on surfaces retain their original properties or structures. The few studies that have addressed the spin dynamics of SMMs on metallic surfaces showed serious alteration of the molecular properties after deposition, and failed to observe magnetic hysteresis.11,16 It is only very recently that magnetic hysteresis from a tetranuclear Fe(III) SMM,17 anchored on a gold surface by thiolate groups,18 or on carbon-nanotubes,19 and from rare-earth-based SMMs anchored on carbon-nanotubes,20 was detected. The conception and design of SMM-based devices, such as single-molecule transistors, crucially depends on the in-depth understanding of the molecular magnetic properties of these materials. The solid state properties of SMMs are relatively well understood but the same cannot be said for the solution state or when the molecules are deposited on metallic or polymeric surfaces. Solution studies of the molecular magnetisation dynamics of SMMs are therefore crucial if the evolution of the magnetic properties of these systems from the solid state via solution to a surface is to be understood and exploited.
During the last few years we have synthesised a family of oxime-based hexanuclear Mn(III) SMMs of general formula [Mn6O2(R-sao)6(solvent)4–6(O2CR′)2] (saoH2 = salicylaldoxime; R, R′ = alkyl, aryl),21 and herein present magnetisation studies on frozen solutions of two complexes of this family: [Mn6O2(Et-sao)6(EtOH)6(Me2benz)2],221, (where Et = CH3CH2, sao2− is the dianion of salicylaldoxime, and Me2benz = 3,5-dimethyl benzoate; (CH3)2C6H3COO−) and [Mn6O2(Et-sao)6(EtOH)4(H2O)2(benz)2],232. We show that the frozen-solution SQUID measurements of these complexes allow the molecular and solid state contributions to the magnetic properties to be quantified.
Results and discussion
Detailed studies of the solid state magnetic properties of this family of oxime-based hexanuclear Mn(III) SMMs led to the first established solid state magnetostructural correlations for any SMM, demonstrating that their solid state magnetic properties are crucially dependent on very small changes in geometry; and in particular the Mn–N–O–Mn torsion angles of the metal oxime core.21 In a study of more than forty such complexes it has been observed that Mn–O–N–Mn torsion angles above approximately 31° mediate ferromagnetic exchange between neighbouring metal centres, whereas Mn–O–N–Mn torsion angles below approximately 31° mediate antiferromagnetic exchange.21 As a consequence, substitution of sao2− with the derivatised R-sao2− transforms “planar” Mn6 complexes displaying S = 4 ground spin-states into “puckered” Mn6 complexes displaying S = 12 ground spin states. However, the geometric characteristics of these complexes, imposed by those solid state crystal packing effects, are expected to be modified in solution where the crystal packing strains are absent. To quantify the contributions from molecular and solid state effects to the solid state magnetic properties of these SMMs we have performed frozen-solution magnetisation studies on complexes 1 and 2.The molecular structures of 1 and 2 are depicted in Fig. 1 (upper panel). The cores of both are analogous and consist of a non-planar [MnIII6(μ3-O2−)2(Et-sao)6]2+ unit of two off-set, stacked [MnIII3(μ3-O2−)]7+ triangular subunits linked by two oximato and two phenolato O-atoms from two η1:η1:η2:μ3 Et-sao2− ligands. The four remaining Et-sao2− ligands each bridge across one edge of a [MnIII3(μ3-O2−)]7+ triangle in a η1:η1:η1:μ-fashion. The metal ions are all six-coordinate and in distorted octahedral geometries, with the remaining coordination sites occupied by terminal carboxylate, alcohol and/or H2O molecules. The core of 1 is near identical to that of 2, except that the Mn–N–O–Mn torsion angles have increased from an average of αv = 36° in 2 to αv = 39° in 1 (Fig. 1, bottom panel). 1 is characterised by an S = 12 ground spin-state and displays the largest potential energy barrier to reorientation of the magnetisation known to date,22 namely an effective thermal activation energy Ueff/k = 86.4 K (Table 1) determined in the solid state by fitting of d.c. and a.c. magnetisation data to the Arrhenius model of eqn (1),
| τ = τ0exp(Ueff/kT) | (1) |
| Solida | Butyronitrileb | Toluenec | ||||
|---|---|---|---|---|---|---|
| ‘fast’ | ‘slow’ | ‘fast’ | ‘slow’ | |||
| a Based on data reported in ref. 19 and 20. b 22.7 and 40.8 mM frozen solutions of 1 and 2, respectively, in butyronitrile. c 18.8 and 12.6 mM frozen solutions of 1 and 2, respectively, in dry toluene. | ||||||
| T max/K | 1 | 6.52(0.02) | 3.65(0.03) | 5.09(0.04) | 3.50(0.01) | 4.93(0.05) |
| 2 | 4.47(0.01) | 3.82(0.05) | 5.02(0.03) | 3.61(0.02) | 4.76(0.07) | |
| τ o/10−10 s | 1 | 2.5(0.3) | 10.1(2.9) | 3.0(0.7) | 8.4(1.9) | 1.5(0.6) |
| 2 | 8.0(0.5) | 9.9(1.3) | 4.5(0.4) | 7.2(1.4) | 1.1(0.3) | |
| U eff/k K | 1 | 86.4(0.6) | 42.6(0.8) | 64.9(0.9) | 41.5(0.7) | 66.5(1.7) |
| 2 | 53.1(0.4) | 44.4(0.4) | 61.9(0.4) | 43.3(0.6) | 66.1(1.1) | |
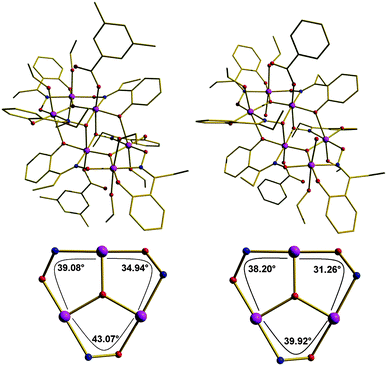 | ||
| Fig. 1 Upper Panel: Molecular structures of complexes 1 (left) and 2 (right). Bottom panel: metal cores of, and torsion angles in, the trinuclear sub-units of 1 (left) and 2 (right). Colour code: Mn, purple; O, red; N, blue; C, gold. H atoms have been omitted for clarity. | ||
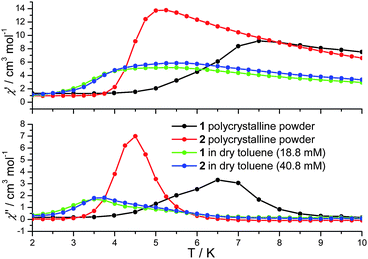 | ||
| Fig. 2 In-phase (χ′) and out-of-phase (χ′′) a.c. susceptibility of 1 and 2 in the solid state (polycrystalline powder) and in solution at 1500 Hz. | ||
1 displays slow relaxation of the magnetisation in solution as evidenced by the SQUID detected d.c. magnetisation hysteresis loop of a 22.7 mM frozen solution of 1 in butyronitrile at temperatures up to 2.2 K (Fig. 3). This is the first time that a SQUID detected d.c. magnetisation hysteresis loop in frozen solution has been reported for an SMM other than Mn12.10,12 The observed coercive field is reduced with increasing temperature, in agreement with a thermally activated mechanism for relaxation of the magnetisation. In addition, at 0 T and approximately 1 T, steps are observed in the hysteresis curve pointing to relaxation of the magnetisation by quantum tunnelling. In Fig. 3, the molecular magnetic moment of 1 is of the order of 9.4 μB (μB is the Bohr magneton) at 2 T, reaching 11.2 μB at 4 T, and does so for each temperature measured. This behaviour is very different to that observed for 1 in the solid state where the molecular magnetic moment is of the order of 14 μB at 2 T, rising to approximately 17 μB at 4 T.22 The reduced magnetisation plot of the molecular magnetic moment of the 22.7 mM frozen solution of 1 in butyronitrile is shown in Fig. 4, with the reported d.c. magnetisation data collected in the 2 to 7 K temperature range and the 1 to 5 T field range. Comparison of the reduced magnetisation plot of Fig. 4 with the analogous data reported for 1 in the solid state22 confirms that the molecular magnetic moment of the 22.7 mM frozen solution of 1 in butyronitrile is approximately 30% lower than in the solid state. This observation points towards the structural, at least in part, evolution of 1 in solution since the magnetic moment per Mn(III) centre is not conserved upon dissolution of 1. The reduced magnetisation plot of the d.c. molecular magnetisation of two different solutions of 2 (12.6 mM in toluene and 40.8 mM in butyronitrile) are also shown in Fig. 4. The same arguments and conclusions regarding the loss of magnetisation discussed for 1, can be used to analyse the reduced magnetisation data of 2. We refer discussion of the composition of the solutions obtained upon dissolution of 1 and 2 to later sections.
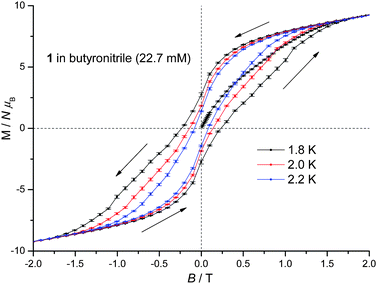 | ||
| Fig. 3 D.c. magnetisation hysteresis loop of a 22.7 mM frozen solution of 1 in butyronitrile at 1.8, 2.0 and 2.2 K. | ||
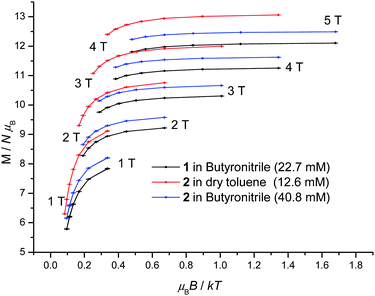 | ||
| Fig. 4 Reduced magnetisation plot of frozen solutions of 1 (22.7 mM in butyronitrile) and 2 (12.6 mM in dry toluene, 40.8 mM in butyronitrile) in the temperature and field ranges 2 to 7 K and 1 to 5 T. | ||
In cases where the presence of a mixture of species in solution cannot be excluded, the determination of molecular properties in solution is in general not possible solely based on the detection and analysis of static magnetisation data or MCD detected hysteresis loops, since unresolvable convoluted contributions from several species can contribute to the experimental data. However, dynamic spin-relaxation measurements can be used to obtain information on the molecular properties and composition of solutions of SMMs. Spin-relaxation properties are extremely sensitive to the molecular environment and as a result deconvolution of the contributions from different species is greatly simplified. Figs. 2 and 5 show the temperature variation of the components of the a.c. susceptibility of 1 and 2 in frozen toluene solutions at 1500 Hz. Despite the markedly different spin-relaxation properties displayed by 1 and 2 in the solid state, the two complexes display very similar spin-dynamics in solution. These observations unequivocally establish the relaxation of solid state effects upon dissolution of 1 and 2. They also demonstrate that the outer coordination spheres of the Mn(III) centres in 1 and 2 present no significant influence on the spin relaxation properties of these systems. For both complexes two maxima in the χ′′ temperature dependence can be observed. For 1 the first maximum is located at 3.50 K and the second at 4.93 K (Table 1). For 2 the first maximum is located at 3.61 K and the second at 4.76 K (Table 1). The same double-maximum behaviour is observed in the temperature dependence of χ′′ for frozen solutions of 1 and 2 in butyronitrile. Fig. 5 shows the comparison of the temperature dependence of the χ′′ susceptibilities of 1 and 2 in butyronitrile and toluene solutions at 1 and 1500 Hz. In butyronitrile and at 1500 Hz, the χ′′ of 1 displays one maximum at 3.65 K and a second at 5.09 K (Table 1), whereas the χ′′ of 2 displays maxima at 3.82 K and 5.02 K (Table 1). For each solvent, the slower relaxing of the two species (maxima at around 5.0 K) will be referred to as the ‘slow’ component whereas the faster relaxing species (maxima at around 3.5 K) will be referred to as the ‘fast’ component of the χ′′ susceptibility. The temperature dependence of the a.c. susceptibilities of 1 and 2 in the frequency range 1 to 1500 Hz in these two solvents is shown in Figures ESI1 to ESI4.† From these data the peak temperatures, Tmax, and hence relaxation times (τ = (2 π ν)−1, where ν is the frequency of the a.c. field) for the fast and slow relaxing components can be extracted by fitting to Lorentzian line-shapes. Fig. 6 shows the Arrhenius plot for the fast and slow components of 1 and 2 in butyronitrile and toluene solutions. The effective thermal activation energies and pre-exponential factors, τ0, determined by fitting the data shown in Fig. 6 to the Arrhenius model of eqn (1) are given in Table 1 along with the associated standard errors. From Table 1 it can be seen that upon dissolution, 1 gives rise to two species that are both characterised by a smaller effective thermal activation barrier than seen in the solid state. When 2 is dissolved, it also gives rise to two species. However, one of the species generated in solution has a higher thermal activation barrier than that observed in the solid state. This is the first time that an increase in the thermal activation barrier by dissolution has been observed. These results demonstrate that the magnetic properties determined for 1 and 2 in the solid state emanate from strained solid state molecular structures, the strains being induced by crystal-packing effects. The relaxation of these geometric effects in solution results in the species generated by 1 and 2 having essentially similar magnetic properties, because of their identical first coordination sphere and despite the somewhat differing outer coordination spheres. This conclusion is supported by the standard errors on the Tmax, τ0, and Ueff values reported in Table 1, that show that the reported Tmax, τ0, and Ueff values of the fast and slow components of 1 and 2 in solution are not statistically different. They are however statistically different to the analogous values reported in Table 1 for 1 and 2 in the solid state.
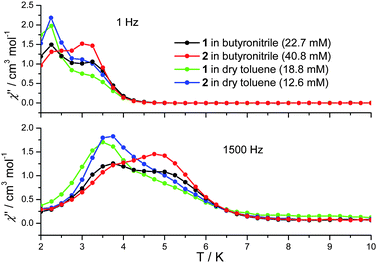 | ||
| Fig. 5 Comparison of the out-of-phase (χ′′) a.c. susceptibility of frozen solutions of 1 (18.8 mM in dry toluene, 22.7 mM in butyronitrile) and 2 (12.6 mM in dry toluene, 40.8 mM in butyronitrile) at 1 and 1500 Hz. | ||
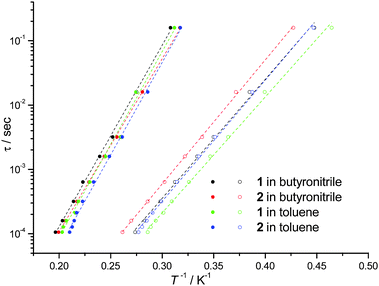 | ||
| Fig. 6 Relaxation times τ for the ‘slow’ (solid circles) and ‘fast’ (empty circles) components of the χ′′ of frozen solutions of 1 (18.8 mM in dry toluene, 22.7 mM in butyronitrile) and 2 (12.6 mM in dry toluene, 40.8 mM in butyronitrile) determined as explained in the text. The dotted lines are the fit of the experimental data to the Arrhenius model of eqn (1). | ||
The observation that the magnetic moment per Mn(III) centre is not conserved upon dissolution of 1 and 2 points towards the structural, at least in part, evolution of 1 and 2 in solution, via simple geometric relaxation, resulting in a less “puckered” structure and/or to the loss or redistribution of the terminally bonded ligands. It has been shown in the solid state that very small changes in the geometric characteristics of members of this family (e.g. the Mn–N–O–Mn torsion angles) profoundly influences the magnetic properties.21 Relaxation, upon dissolution, of the solid state effects deliberately induced by employment of the derivatised oxime ligands of 1 and 2 may lead to the generation of hexanuclear species within which some or all of the nearest-neighbour magnetic exchange interactions are reduced in magnitude or switched to antiferromagnetic. Such a geometric relaxation (or “flattening”) would almost certainly lead to species with S = 4 ground spin-states. It is also possible that the two constituent triangular subunits of 1 and 2 are separated in solution generating trinuclear species; such an evolution would be favoured by the presence of coordinating solvents. All of the above envisaged species could in principle further evolve, and thus potentially there is a range of possible products that could be generated when 1 and 2 are dissolved. The fact that the reduction of the molecular magnetic moment is only 30% suggests that a mixture of species displaying ground spin-states of S = 4 and S = 12 is present in solution. The molecular magnetic moment saturation values for an S = 4 and an S = 12 ground spin-state (assuming g = 2) are 8 and 24 Bohr magnetons, respectively. Thus, the approximate 30% reduction of the molecular magnetic moment in solution can be explained by the presence of an equimolar mixture of species characterised by S = 4 and S = 12 ground spin-states. The possibility of all the Mn(III) ions forming mononuclear species is discarded by the reduction of the molecular magnetic moment and by the observed hysteresis loop of Fig. 3. No such slowly relaxing mononuclear Mn(III) SMMs are known. Given the discussion on the composition of the studied solutions, the presence of two slowly relaxing species is a more plausible explanation for the observation of two maxima in the temperature dependence of χ′′ than assuming the presence of a single species relaxing by two different relaxation mechanisms.
Solutions of 1 in toluene display similar magnetic properties to solutions of 1 in butyronitrile. The same observation is valid for 2. These can be justified by the non- or weakly coordinating nature of these two solvents for Mn(III). Solutions of 1 in acetonitrile and in mesitylene display the same kind of double maximum behaviour (Figure ESI5†). No a.c susceptibility response was obtained from solutions of 1 and 2 in ethanol due to low solubility. A solution of 1 in methanol gave, in addition to the response from the insoluble material, a tail of an out-of-phase signal centred around 2 K (Figure ESI6†). The above observations are consistent with the fact that in non-coordinating solvents a considerable proportion of the dissolved 1 and 2 retain their solid state structure. They also demonstrate that the measured response in solution does not originate from small crystals formed during the cooling process since such contributions, when significant, can be clearly identified as shown in the case of solutions of 1 in methanol (Figure ESI6†).
The species characterised by S = 4 ground spin-states likely do not display a maximum of the χ′′ susceptibility component at temperatures higher than 1.8 K. This is consistent with observations made in the solid state.21–24 We speculate that the origin of the fast component of the χ′′ susceptibility is the presence of a species resulting from the loss and/or redistribution of terminal ligands, in analogy to that observed for 1 in the solid state. Alternatively it may result from the existence of a ferromagnetically coupled trinuclear species resulting from the dissociation in solution of the triangular subunits of 1 and 2. The Arrhenius plot for such a triangular unit in methanol solution (Figure ESI7†) shows its spin relaxation characteristics to be similar to those of the fast component.
Conclusions
We have shown that frozen solution studies of the dynamic susceptibility of 1 and 2 allow for the contributions of solid state crystal packing effects to the molecular magnetic properties to be quantified. We have also shown that slight differences in the outer coordination sphere of the Mn(III) ions in 1 and 2, such as the presence or not of the alkyl groups resulting from substitution of sao2− with the derivatised R-sao2− or of benz by Me2benz, do not result in statistically significant differences in the dynamic magnetic properties of these complexes in solution. On the other hand, in the solid state, significant differences of the magnetic properties of 1 and 2 have been observed. These differences are due to the existence of strained molecular structures in the solid state due to the influence of solid state crystal packing effects. These structural strains result in differences in the molecular magnetic properties of 1 and 2 in the solid state. In addition, we have proven that there are only a limited number of species that result from the dissolution of 1 and 2 in non-coordinating solvents, as evidenced by the magnitude and characteristic two maxima of the out-of-phase dynamic susceptibility of dissolved 1 and 2 (Fig. 5 and ESI1-ESI4†). In the case of a plethora of species being present in solution, the intensity of the χ′′ curves of Fig. 5 and ESI1-ESI4† would be much lower and their shape much smoother, resulting in the two maxima being smeared out. Thus, dissolution of 1 and 2 in non-coordinating solvents results in only a limited number of different, at least with respect to their magnetic properties, species. Finally, we have shown that the differences between the magnetic properties of 1 and 2 in the solid state and in solution are not only limited to differences in the pre-exponential factor of the Arrhenius model but concern the effective activation energy itself. An increase in Ueff upon dissolution (in the case of 2) is reported for the first time.Acknowledgements
This work was supported by the Danish Natural Science Research Council (FNU) through a Steno fellowship (272-07-0147) to SP. EKB thanks the EPSRC, Leverhulme Trust and Royal Society of Chemistry for their generous support.Notes and references
- R. Sessoli, H.-L. Tsai, A. R. Schake, S. Wang, J. B. Vincent, K. Folting, D. Gatteschi, G. Christou and D. N. Hendrickson, J. Am. Chem. Soc., 1993, 115, 1804 CrossRef CAS; R. Sessoli, D. Gatteschi, A. Caneschi and M. A. Novak, Nature, 1993, 365, 141 CrossRef CAS.
- L. Thomas, F. Lionti, R. Ballou, D. Gatteschi, R. Sessoli and B. Barbara, Nature, 1996, 383, 145 CrossRef CAS.
- W. Wernsdorfer and R. Sessoli, Science, 1999, 284, 133 CrossRef CAS.
- S. Carretta, P. Santini, G. Amoretti, M. Affronte, A. Ghirri, I. Sheikin, S. Piligkos, G. Timco and R. E. P. Winpenny, Phys. Rev. B: Condens. Matter Mater. Phys., 2005, 72, 060403 CrossRef.
- A. Ardavan, O. Rival, J. J. L. Morton, S. J. Blundell, A. M. Tyryshkin, G. A. Timco and R. E. P. Winpenny, Phys. Rev. Lett., 2007, 98, 057201 CrossRef; C. Schlegel, J. van Slageren, M. Manoli, E. K. Brechin and M. Dressel, Phys. Rev. Lett., 2008, 101, 147203 CrossRef CAS.
- D. Gatteschi, R. Sessoli and J. Villain, Molecular Nanomagnets, Oxford University Press, Oxford, 2006 Search PubMed.
- R. Sessoli, Mol. Cryst. Liq. Cryst., 1995, 274, 145 CrossRef; A. Caneschi, T. Ohm, C. Paulsen, D. Rovai, C. Sangregorio and R. Sessoli, J. Magn. Magn. Mater., 1998, 177–181, 1330 CAS; S. M. J. Aubin, Z. Sun, H. J. Eppley, E. M. Rumberger, I. A. Guzei, K. Folting, P. K. Gantzel, A. L. Rheingold, G. Christou and D. N. Hendrickson, Inorg. Chem., 2001, 40, 2127 CrossRef CAS.
- M. R. Cheesman, V. S. Oganesyan, R. Sessoli, D. Gatteschi and A. J. Thomson, Chem. Commun., 1997, 1677 RSC; E. J. L. McInnes, E. Pidcock, V. S. Oganesyan, M. R. Cheesman, A. K. Powell and A. J. Thomson, J. Am. Chem. Soc., 2002, 124, 9219 CrossRef CAS.
- T. Lis, Acta Crystallogr., Sect. B: Struct. Crystallogr. Cryst. Chem., 1980, 36, 2042 CrossRef.
- N. Domingo, B. E. Williamson, J. Gómez-Segura, P. Gerbier, D. Ruiz-Molina, D. B. Amabilino, J. Veciana and J. Tejada, Phys. Rev. B: Condens. Matter Mater. Phys., 2004, 69, 052405 CrossRef.
- L. Bogani, L. Cavigli, M. Gurioli, R. L. Novak, M. Mannini, A. Caneschi, F. Pineider, R. Sessoli, M. Clemente-León, E. Coronado, A. Cornia and D. Gatteschi, Adv. Mater., 2007, 19, 3906 CrossRef CAS.
- F. El Hallak, J. van Slageren, J. Gómez-Segura, D. Ruiz-Molina and M. Dressl, Phys. Rev. B: Condens. Matter Mater. Phys., 2007, 75, 104403 CrossRef.
- G. de Loubens, A. D. Kent, V. Krymov, G. J. Gerfen, C. C. Beedle and D. N. Hendrickson, J. Appl. Phys., 2008, 103, 07B910 CrossRef.
- M. Gonidec, E. S. Davies, J. McMaster, D. B. Amabilino and J. Veciana, J. Am. Chem. Soc., 2010, 132, 1756 CrossRef CAS.
- S. Karasawa, G. Zhou, H. Morikawa and N. Koga, J. Am. Chem. Soc., 2003, 125, 13676 CrossRef CAS; S. Karasawa, D. Yoshihara, N. Wanatabe, M. Nakano and N. Koga, Dalton Trans., 2008, 1418 RSC.
- A. Naitabdi, J.-P. Bucher, P. Gerbier, P. Rabu and M. Drillon, Adv. Mater., 2005, 17, 1612 CrossRef CAS; M. Mannini, P. Sainctavit, R. Sessoli, C. Cartier dit Moulin, F. Pineider, M.-A. Arrio, A. Cornia and D. Gatteschi, Chem.–Eur. J., 2008, 14, 7530 CrossRef CAS; M. Mannini, F. Pineider, P. Sainctavit, L. Joly, A. Fraile-Rodríguez, M.-A. Arrio, C. Cartier dit Moulin, W. Wernsdorfer, A. Cornia, D. Gatteschi and R. Sessoli, Adv. Mater., 2009, 21, 167 CrossRef.
- A. Cornia, A. C. Fabretti, P. Garrisi, C. Mortalò, D. Bonacchi, D. Gatteschi, R. Sessoli, L. Sorace, W. Wernsdorfer and A.-L. Barra, Angew. Chem., Int. Ed., 2004, 43, 1136 CrossRef CAS; S. Accorsi, A.-L. Barra, A. Caneschi, G. Chastanet, A. Cornia, A. C. Fabretti, D. Gatteschi, C. Mortalò, E. Olivieri, F. Parenti, P. Rosa, R. Sessoli, L. Sorace, W. Wernsdorfer and L. Zobbi, J. Am. Chem. Soc., 2006, 128, 4742 CrossRef CAS.
- M. Mannini, F. Pineider, P. Sainctavit, C. Danieli, E. Otero, C. Sciancalepore, A. M. Talarico, M.-A. Arrio, A. Cornia, D. Gatteschi and R. Sessoli, Nat. Mater., 2009, 8, 194 CrossRef CAS.
- L. Bogani, C. Danieli, E. Biavardi, N. Bendiab, A.-L. Barra, E. Dalcanale, W. Wernsdorfer and A. Cornia, Angew. Chem., Int. Ed., 2009, 48, 746 CrossRef CAS.
- S. Kyatskaya, J. R. G. Mascarós, L. Bogani, F. Hennrich, M. Kappes, W. Wernsdorfer and M. Ruben, J. Am. Chem. Soc., 2009, 131, 15143 CrossRef CAS.
- C. J. Milios, R. Inglis, A. Vinslava, R. Bagai, W. Wernsdorfer, S. Parsons, S. P. Perlepes, G. Christou and E. K. Brechin, J. Am. Chem. Soc., 2007, 129, 12505 CrossRef CAS; C. J. Milios, S. Piligkos and E. K. Brechin, Dalton Trans., 2008, 1809 RSC; R. Inglis, L. F. Jones, C. J. Milios, S. Datta, A. Collins, S. Parsons, W. Wernsdorfer, S. Hill, S. P. Perlepes, S. Piligkos and E. K. Brechin, Dalton Trans., 2009, 3403 RSC.
- C. J. Milios, A. Vinslava, W. Wernsdorfer, S. Moggach, S. Parsons, S. P. Perlepes, G. Christou and E. K. Brechin, J. Am. Chem. Soc., 2007, 129, 2754–2755 CrossRef CAS.
- C. J. Milios, A. Vinslava, P. A. Wood, S. Parsons, W. Wernsdorfer, G. Christou, S. P. Perlepes and E. K. Brechin, J. Am. Chem. Soc., 2007, 129, 8–9 CrossRef CAS.
- S. Piligkos, J. Bendix, H. Weihe, C. J. Milios and E. K. Brechin, Dalton Trans., 2008, 2277 RSC.
Footnote |
| † Electronic supplementary information (ESI) available: Experimental details. See DOI: 10.1039/c0sc00327a |
| This journal is © The Royal Society of Chemistry 2010 |
