 Open Access Article
G0.5 PAMAM dendrimers improve the kinetic stabilization and nanoscale precipitation mechanism of amorphous calcium carbonate†
Weiguang Shi a,
Zaiqiang Maa,
Yuqiang Mua,
Jun Wang*a,
Benxian Lib,
Xiaofeng Wangb,
Zhaogang Teng
 c and
Xiaoyang Liu
 *b
*b
aProvincial Key Laboratory of Oil & Gas Chemical Technology, College of Chemistry & Chemical Engineering, Northeast Petroleum University, Daqing 163318, China. E-mail: wangjun1965@yeah.net
bState Key Laboratory of Inorganic Synthesis and Preparative Chemistry, College of Chemistry, Jilin University, Changchun 130023, China. E-mail: liuxy@jlu.edu.cn
cDepartment of Medical Imaging, Nanjing Hospital, Nanjing 210002, China
First published on 21st September 2017
Abstract
A series of nanoscale amorphous calcium carbonate (nano-ACC) precipitates are prepared by alternating the concentration of carboxylic acid-terminated G0.5 poly(amidoamine) dendrimer with a CaCl2–Na2CO3 liquid–liquid phase which acts as a nucleation site at a fixed initial pH of 12 ± 0.2 at 15 °C. Analysis of the reaction time and particle size shows a four stage ACC precipitation mechanism including a combination of primary nucleation, secondary nucleation and diffusion controlled fast and slow growth, which is proved by electrical conductivity (EC) experiments. Moreover, the crystallization of calcite via vaterite is investigated. It is found that the stabilization of ACC and delay of the transformation from ACC to calcite via vaterite in aqueous systems is due to the surface activity and dendritic effect of G0.5, which have a significant effect on the kinetic process of the ACC nucleation stage.
Introduction
The topic of crystallization or precipitation has been extensively studied for more than a century1,2 owing to its inherent significance in natural and technological applications, including environmental processes such as the carbon cycle and synthesis of nanomaterials, biomaterials and catalysts.3,4 It is widely recognized that most observed crystallizations go through an amorphous precursor phase, particularly in carbonates.Amorphous calcium carbonate (ACC) is an important precursor in biominerals and crystalline CaCO3 minerals (calcite, vaterite and aragonite) and has attracted great interest in research. ACC is unstable and easily crystallized within minutes in water particularly under alkaline conditions.5–9 A strategy frequently employed is the use of specialized organic or inorganic additives, including SiO2, metal cations, poly(acrylic acid and aspartic acid) and block copolymers10–13 to stabilize the amorphous phase, where they provide a means of gaining desired properties, such as polymorphism and specific size distribution. Recently, stable amorphous calcium carbonate composite particles with sizes controlled in the range of 0.61 to 2.21 μm were obtained using G0.5 poly(amidoamine) (PAMAM) dendrimers.14 Dendrimers are monodispersed macro-molecules with a regular and highly branched three-dimensional structure, which should be a good candidate to prolong the incubation time of amorphous calcium carbonate to 1 day due to the dendritic effect. However, few studies, particularly in strongly basic aqueous systems, have reported the kinetics and nanoscale mechanisms for the improvement in the stabilization of ACC.
The latest research on ACC precipitation describes a complex process of primary/secondary nucleation and diffusion controlled growth, which was established based on a thermodynamic–kinetic method in an aqueous system of CaCl2–Na2CO3/NaHCO3.15 Valuable insight into the entire precipitation process was gained with an average surface energy value in nucleation time for a defined particle size. In addition, an accurate and key point is that numerous surfaces are generated with ions, molecules, or clusters to further accelerate ideal secondary nucleation and/or aggregation and growth such as self-organized behavior in addition to the primary behavior. According to this thermodynamic–kinetic model, it is uncertain whether a dendrimer molecule could promote or delay nucleation and control the particle size and the kinetics of precipitation of calcium carbonate.
In this study, a series of nano-ACCs were fabricated in a CaCl2–Na2CO3 liquid–liquid phase which acted as a nucleation site in the presence of carboxylic acid-terminated G0.5 poly(amidoamine) dendrimer (hereafter G0.5). Further, we explore whether G0.5 could extend the lifetime of ACC in crystallization favored alkaline conditions. In addition, tremendous efforts have been made to stabilize the amorphous phase in solution by varying temperature and the G0.5 concentration. The plausible kinetic process was studied by measuring the surface tension of the entire system, which could be described indirectly by the Gibbs free energy barrier and nucleation rate according to the classical theory introduced by Nielsen16 and Testino.17 Due to the rigorous approach employed, the mechanisms of dendrimer improvement in the ACC stabilization and its crystallization to calcite via vaterite are clarified using an in situ data collecting system for pH and electrical conductivity (EC).
As discussed in this research, the carboxylic-terminated G0.5 prevents the transformation of ACC to calcite (via vaterite) in aqueous systems owing to its surface activity and dendritic effect, which have a significant effect on the kinetic process of the nucleation stage.
Results and discussion
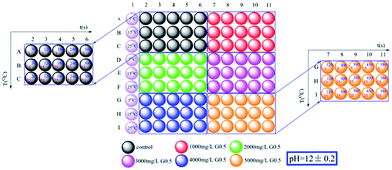
Nano-ACC precipitations were carried out with and without G0.5 under different experimental conditions. Although it is known that dendrimers could effectively control the crystal size of calcite and vaterite,14 the influence of G0.5 in improving the stabilization of ACC in aqueous systems is rarely documented.Ninety associated plausible precipitation experiments were conducted in a relatively wide range of reaction times, temperatures and G0.5 concentrations, which is provided in the schematic diagram of the sample generation as shown in Fig. 1. In addition, pH, which is one of most important physicochemical parameters, was fixed at 12 initially since it is theoretically proven that the ACC solubility decreases at higher pH. In addition, a higher concentration of G0.5 could dissolve better at higher pH. If the initial pH is greater than 12, a large number of carboxylic acid groups of G0.5 should react with NaOH, which could affect the Ca2+ complexation. A similar tendency was reported, where higher temperature will lower the ACC solubility and CaCO3 crystallizes easily, which might be due to the positive change in entropy.15
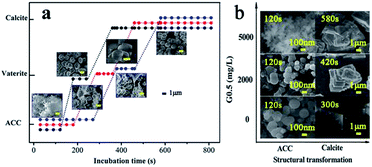
Therefore, experiments were conducted at the initial pH of 12 at 15 °C, which guaranteed that precipitation occurred easily under controlled critical conditions. Due to the quantity of precipitate prepared, it was possible to completely characterize the samples via powder X-ray diffraction (pXRD), FT-IR spectroscopy, scanning electron microscopy (SEM) with energy dispersive X-ray spectroscopy (EDX) and thermogravimetric analysis (TGA). As the reaction progressed with temperature, the pXRD patterns of the ACC particles (Fig. S1†) prepared at 5 °C and 15 °C showed no Bragg peaks; however, broad humps located at 2θ = ∼30° and ∼45° were observed, which reflect poorly ordered ACC particles. The broad humps narrowed with an increase in reaction time and vaterite (110), (112) and (114) peaks (intense peaks at 2θ = 24.90°, 27.05° and 32.78°, respectively) started growing after an induction time of 120 s, and 240 s later, calcite peaks (intense sharp peaks at 2θ = 29.40° and 35.97°; (104) and (110), respectively) appeared (Fig. S2a,† and 2). The G0.5-introduced ACC samples exhibited a similar amorphous and crystalline process, but there was a significantly different incubation time. As a result, the G0.5 postponed the crystallization from ACC to calcite (via vaterite), which particularly extended the maximum lifetime of ACC from 120 s (without G0.5) to 300 s (with G0.5), vaterite from 180 s to 380 s, and pure calcite from 300 s to 580 s (Fig. S3a,† and 2), and controlled the particle size of ACC in the range of about 40–200 nm (Fig. 2 and 4).
The FT-IR analysis of the as-prepared samples showed bands characteristic of ACC (Fig. S2b and S3b†) with peaks corresponding to the main asymmetric ν3 CO32− band (at 1472 cm−1 and 1423 cm−1) and a shaper band at 1650 cm−1 (O–H bending), symmetric ν1 CO32− peak at 1072 cm−1, the asymmetric ν2 peak at 866 cm−1 and no detectable symmetric ν4 peak (745 cm−1 in vaterite or 713 cm−1 in calcite). After 120 s reaction in a pure aqueous system or after 300 s reaction in a 5000 mg L−1 G0.5-water system, vaterite-like features appeared with all the expected IR active modes visible and sharpening of the peaks at 875 cm−1 and 745 cm−1. This confirmed that the ACC crystallized into vaterite, and small peaks of calcite were observed in the patterns collected from the samples recovered after 240 s and 450 s (without and with G0.5 successively), which appeared at 875 cm−1 and 713 cm−1.18,19
The morphologies of all the obtained CaCO3 were determined via SEM. It should be emphasized that the exhaustive experiments were designed to prepare different types of products in order for us to examine the strong influence of G0.5 on the CaCO3 morphologies and the precipitation process through particle size, configuration and stabilization. Specifically, spherical ACC particles with a diameter of ∼220 nm were observed in the samples prepared with the pure water system after 120 s (Fig. 4(d1)). The crystallization phase could be identified clearly as 1–2 μm vaterite and 2–3 μm calcite particles (Fig. 2), effectively concluding that this amorphous phase is often short-lived, and crystallized within 3 minutes.20 However, there was a progressive downward shift in the particle size of ACC, vaterite and calcite and an upward shift in the lifetime of each type of CaCO3 when the ACC was prepared in the G0.5 (Fig. 2). The maximum shifts in the extended incubation time and particle size were 300 s and 200 nm for ACC (Fig. 4(d2)), 450 s and ∼1.5 μm for vaterite and 580 s and ∼2.5 μm for calcite with 5000 mg L−1 G0.5, respectively. These results are fully consistent with the fact that carboxylic acid functionalized groups are effective CaCO3 growth modifiers,21 which are attributed to the dispersion of the dendritic effect and the coordination binding to Ca2+. Further, it verifies that G0.5 is a stabilizer for ACC and crystal inhibitor for calcite and vaterite.
Thermogravimetric analysis was performed to gain information on the existence of G0.5 in the composition of the ACC, which underwent two-step (without G0.5) and three-step (with G0.5) weight loss upon heating (Fig. 3a). The weight loss started with a gradual loss in structural and surface water, which was 4.9 wt% for 5000 mg L−1 G0.5 in the early period before 270 °C. Recently, the studies on ACC structures22,23 have provided surprisingly conclusive insights towards controlling its synthesis and typical polyamorphous states. Water in the hydrated form plays an important role in ACC polyamorphism since it is composed of structural and surface-bound H2O.24 As a result, ACC was in the form of CaCO3·1.10H2O without G0.5 and CaCO3·1.23H2O with 5000 mg L−1 G0.5, which is visualized in Fig. S4.†
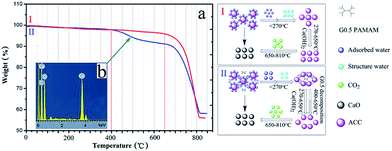 | ||
| Fig. 3 Chemical composition of ACC analysed by (a) TGA: (I) control and (II) 5000 mg L−1 G0.5 and (b) EDX of ACC with 5000 mg L−1 G0.5. | ||
Specifically, the pH of the preparation solution is important for defining not only the synthetic conditions, but also OH-containing species that could be incorporated into the amorphous structure. When pure ACC was obtained at an initial pH > 12, additional weight loss would take place at 270–650 °C owing to the formation or decomposition of Ca(OH)2,25 which is consistent with this study as shown in curve I (Fig. 3a). Importantly, it is demonstrated that the ACC particles underwent a slow dehydration, beyond which the classical sequential decomposition of CaCO3 to CaO was observed (weight loss of 33–38 wt% up to 810 °C). The additional weight loss step in curve II at 400–650 °C belongs to the carbonization temperature of G0.5 (Fig. 3a). This suggests that the G0.5 molecules are adsorbed on (or reside in) ACC with a content of 6.26 wt%. The rate of CO2 loss during the second major period differed, and a slower weight loss was observed in the system with G0.5. This result indicates that the ACC particles modified with G0.5 exhibit a strong stabilizing effect that prevents phase transformation, which means that a G0.5–Ca2+ complex could exist as identified by the EDX analysis (Fig. 3b). The EDX result indicates the presence of calcium (3.7, 4.0 keV), carbon (0.3 keV) and oxide (0.5 keV) in the form of aggregates (Fig. 3b). This gave us a clear insight into the distribution of elements and that the carbon atom spectrum was larger than that in the standard CaCO3, which indicates that the separations between the monofilaments correspond to the adsorbed layers of G0.5 that prevented the transformation of ACC, and contaminated dendrimers were involved in the products.
Nanoscale precipitation mechanism of ACC with G0.5
Despite the fact that there were hundreds of scientific contributions published over the last 10 years on the precipitation of ACC, both its mechanism and kinetic aspects are still unclear. Therefore, detailed time distribution experiments for 5000 mg L−1 G0.5 and control experiments were designed based on the nano-ACC precipitation pathway to solve these unanswered questions.Our experimental data on reaction time and particle size exhibits a four stage trend during the ACC precipitation (Fig. 4), which is a combination of primary nucleation (stage I), secondary nucleation (stage II) and diffusion controlled growth (fast: stage III and slow: stage IV). The growth could be limited by the diffusion of Ca2+, CO32−, their interaction with the G0.5 additive and the ACC surface energy, which is consistent with the classical nucleation theory described by Nielsen.1
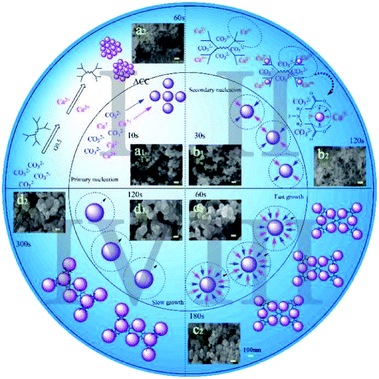 | ||
| Fig. 4 Schematic depiction of the formation of amorphous calcium carbonate spherulites in two different conditions: inner circle (control) and outer circle (G0.5). | ||
Initially, some clusters composed of Ca2+ and CO32− ions triggered quick primary nucleation, which was named stage I. Then, the secondary particles were properly regarded as “aggregates” obtained by secondary nucleation, which was called stage II. The particles in these two stages were quite different in quantity but similar in particle size, which is ∼50 nm (Fig. 4a1 and b1). In the pure water system, the precipitation pathway had no restriction, but what must be emphasized is that G0.5 on the surface of the obtained particles could inhibit aggregation as well as the particle–particle preferential orientation.26 The distribution of G0.5 and CO32− ions was disordered due to the electrostatic repulsion in the early stage, which is plausibly supported by simply considering the fact that CO32− was rich during the primary nucleation and secondary nucleation stages.27 Thus, they should have a relatively high negative charge, which could prevent their coalescence and lead to a smaller size (∼40 nm) and prolonged time (∼120 s) in the nucleation stages (Fig. 4a2 and b2).28
Finally, the small particles grew rapidly, which was due to the fast consumption of Ca2+ in stage III until an almost steady-state value in stage IV, where the particles grew at a slower rate as no consumable ions were available at end of the rapid process. As a result, with the addition of Ca2+ ions, the G0.5–Ca2+ complex rapidly formed, which turned into the intermediates that slowly converted into ACC particles. Evidence in Fig. 4(c1, c2, d1 and d2) shows a comparably smaller growth in size of the particles (150 nm) and a longer incubation of 180 s in stage III. During stage IV, pure ACC (∼200 nm) was stabilized in 300 s with G0.5, but only in 120 s without G0.5. This is mainly because the stable G0.5–Ca2+ complex might inhibit the formation of calcium carbonate particles, resulting in no Ca2+ ions dissociated with CO32− during the precipitation process. This mechanism is supported by the EDX results (Fig. 3b), which clearly show that G0.5 adsorbed on the original ACC might inhibit the growth of initially formed ACC particles due to the steric-hindrance effect and is consistent with the study reported by Kensuke Naka.14
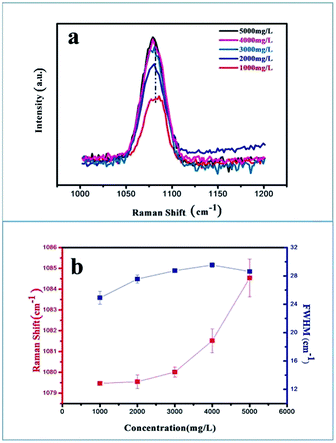
Another effective means of investigating the degree of disorder generated in the ACC samples is Raman spectroscopy, which could elaborate the inhibition of G0.5 (Fig. 5). The change in the positions and widths of the molecular vibrations due to the various atomic configurations and environments of the carbonate groups could provide information about the disorder in the structure. Raman spectra were obtained in the range of 1000–1200 cm−1 with a scan time of 120 s, and spectra were obtained from five samples with different concentrations ranging from 1000–5000 mg L−1 (Fig. 5a). The strongest ν1 peak at ∼1080 cm−1 (C–O symmetrical stretching) was selected for analysis, which was used as the metric for disorder. The C–O symmetrical stretching peak showed a gradual blue shift (Fig. 5b), which indicates that steric-hindrance effect and electrostatic repulsion of G0.5 clearly restrict the space scale of the ν1 vibration leading to a higher rate of dipole change in the C–O symmetrical stretching. Also, the trend of increasing FWHM demonstrates that a disordered structure formed in the carbonate lattice mode, which may be correlated with an increasing tendency in the direction of the growth edges and sites (Fig. 5b).
Besides, similar experiments were carried out during the crystallization of calcite via vaterite. G0.5 with carboxylic groups is a new class of anionic dendrimers which displays a variety of aggregation states owing to its conformational flexibility, and its surface was proposed as a nucleation site, whereas its surface branch cells compete with CO32−.29,33,34
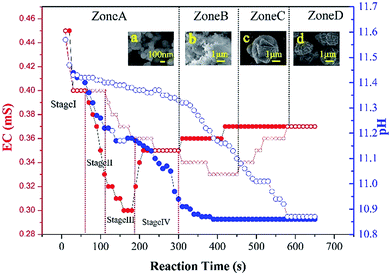
From a nucleation and crystal growth point of view, the electrical conductivity and pH of the CaCO3 precipitation process was monitored as a function of incubation to capture detailed information on the CaCO3 transformation (Fig. 6). The electrical conductivity value decreased at a rapid rate due to the consumption of Ca2+ and CO32− in the initial CaCO3 precipitation process and reached a minimum on completion of the precipitation process. From the variation in the electrical conductivity, delayed nucleation was observed in the presence of 5000 mg L−1 G0.5 as compared to the control. The transformation of CaCO3, which was formally split into four zones related to ACC, ACC + vaterite, vaterite + calcite and calcite, during the entire experiment could be derived. First is the EC-decreasing fast step within 300 s named zone A, in which pure ACC was generated and stable. In zone A, a four stage mechanism of ACC precipitation was recorded with no significant difference in EC values. During the decreasing step, the EC stopped decreasing between 60–120 s, which was an amazing coincidence with the phenomena of primary nucleation (stage I) and secondary nucleation (stage II). In addition, the constant electrical conductivity at 180 s and 300 s is in accordance with fast growth (stage III) and slow growth (stage IV), respectively. However, ∼10 nm sized nanoparticles existed in both growth stages, where the Ostwald ripening process related to dissolution and reprecipitation occurred, which is attributed the success of the diffusion of G0.5.
Secondly, the electrical conductivity increased via a low ebb valley, where the transformation of ACC to vaterite was due to an internal structural reorganization within the individual nanoparticles, which occurred from 300 s to 450 s and was named zone B. Third, the electrical conductivity increased, leading to the transformation of vaterite to calcite from 450 s to 580 s, which was named zone C. Our findings, which were proven by SEM images (insets of Fig. 6a–d), are in agreement with the recent literature, where CaCO3 particles dissolve and release calcium and carbonate into the solution and then reprecipitate on a solid surface and transform into vaterite or calcite.30
Finally, pure calcite was generated with the electrical conductivity reaching a certain value, which was named zone D. Also, most of the calcites were polycrystalline particles due to the carboxylic acid functionalized groups of G0.5, which act as efficient crystal modifiers.31 The SEM images as additional proof show the same trend of extending the stable time for G0.5, where the pH value dropped rapidly due to the consumption of CO32− ions and remained unchanged in the CaCO3 precipitation process, and the prolongation of the pH stable period with G0.5 is attributed to the corresponding solution behavior.
Kinetic stabilization of nanoscale ACC with G0.5
According to crystalline materials theory16 and computation of ACC through the discretized population balance approach,17 the kinetics of the nanoscale precipitation of ACC was investigated to determine the influence of the additive G0.5 on dramatically extending the ACC lifetime, where changes in the solution properties due to surface tension were recorded in the precipitation solution.Here, eqn (1) is provided as a combination of nucleation and growth of the CaCO3 particle, which was fractionated, and the elementary processes were the primary nucleation, the secondary nucleation and the diffusion controlled growth.
 | (1) |
If Ni is the number of particles in the ith size class, the variation dNi/dt could be split into the different contributions related to the elementary processes. In particular, the growth algorithm was computed using 4 stages of ACC particle size distribution as a consequence of the simultaneous events of primary nucleation, secondary nucleation, fast growth and slow growth. Growth was assumed to occur by the incorporation of Ca2+ and CO32− ions into the solid phase particles, which is a function of the diffusion and activity coefficient of Ca2+ and CO32−, and the solubility product Ksp was determined by temperature and pH. Owing to the fixed experimental conditions of temperature 15 °C and initial pH 12, the diffusion controlled growth stages could be ignored. However, the SEM images indicate that the ACC particles indeed grew slower with time and smaller in size; thus, the diffusion of Ca2+ and CO32− could be influenced by the unbalanced viscosity and solution properties with G0.5. Therefore, the nucleation stages (B1 primary nucleation rate, eqn (2); B2 secondary nucleation rate, eqn (3); and Gibbs free energy barrier for nucleation, eqn (4)) are crucial to the kinetics to study the precipitation of ACC.
 | (2) |
 | (3) |
 | (4) |
 is the Gibbs free energy barrier for nucleation (n = 1 or 2), AT is the coefficient for secondary nucleation (here the overall particle surface is a positive number), εA is the surface geometrical factor, εV is the volumetric geometrical factor and v is the molecular volume.
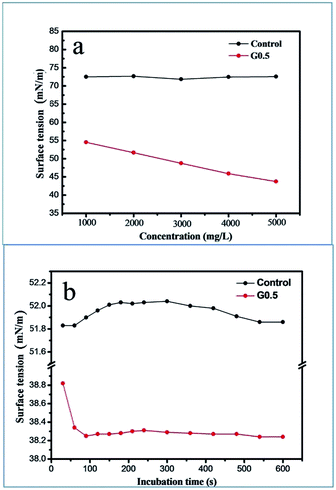
Combining eqn (2) and (3) with (4), it is worth noting that only the surface tension, γ, is a key parameter to study how G0.5 acted to delay the precipitation of ACC through kinetics. The surface tension of the ACC solution (γ) against G0.5 concentration and time is plotted in Fig. 7, which defines the nucleation rate. At 15 °C and initial pH of 12, the value of γ decreased from 55 mN m−1 to 45 mN m−1, which was affected by the G0.5 concentration. In contrast, the γ of the pure water system was 72.5 mN m−1 (Fig. 7a). In the 5000 mg L−1 G0.5 solution, the surface tension significantly decreased to 38 mN m−1 at the beginning of precipitation within 120 s and there was no change during the other time periods, which supports the fact that the ACC nucleation was influenced by the surface tension of the G0.5 solution (Fig. 7b). Moreover, the contact angle was determined to be 27.11° (Fig. S6†), which clarifies that the surface energy of ACC was lower due to the adsorption of G0.5. Ultimately, the kinetic inhibition of nucleation was a result of the energy barrier together with the lower nucleation rate, which led to a longer lifetime for ACC.
Experimental
Materials
Calcium chloride (CaCl2), sodium carbonate (Na2CO3), sodium hydroxide (NaOH) and ethyl alcohol (CH3CH2OH) were purchased from the Tianjin Chemical Reagent Factory. All chemicals were of analytical grade and used without further purification. Deionized water was used to prepare aqueous solutions of CaCl2 and Na2CO3 just before the precipitation experiment, which were prepared in our laboratory. In all the reaction systems, PAMAM solutions were only added to the Na2CO3 solution before mixing with the CaCl2 solution. Carboxylic-terminated G0.5 PAMAM dendrimers (hereinafter G0.5) were synthesized in our laboratory; the detailed procedure is reported in our previous study.32 As shown in Fig. S6,† the structures were dendritic shapes in the early stages of generation, whereas the surface branch cells became substantially more rigid later on.33 The anionic dendrimers should be a good candidate for studying the precipitation of CaCO3 due to their unique and well-defined structures. Also, under a certain concentration, G0.5 with carboxylic groups at the external surface was proposed as a mimic of anionic micelles, which could improve the properties of the solution.34Formation of amorphous calcium carbonate nanoparticles
Aqueous solutions of CaCl2 (0.5 mol L−1, 100 mL), Na2CO3 (0.5 mol L−1, 100 mL), NaOH (0.2 mg L−1, 50 mL) and a certain concentration of G0.5, ranging from 1000 to 5000 mg L−1, (prepared system) were initially prepared. ACC was synthesized according to Kojima's method,35 where equimolar calcium chloride and sodium carbonate solutions were rapidly mixed. In this method, a small amount of NaOH solution was added to 10 mL 0.5 M Na2CO3, different concentrations of G0.5 solution and a quantitative amount of deionized water; the pH value was adjusted to 12.00 using a dilute aqueous solution of NaOH. This solution was combined with 10 mL 0.5 M CaCl2 solution at temperatures ranging from 5 °C to 25 °C and stirred rapidly, followed by vacuum filtration with ethanol. Subsequently, the powder was filtered and washed with CH3CH2OH once. The designed precipitation of CaCO3 in the absence/presence of G0.5 was performed under different nucleation conditions (Fig. 1). Finally, the product was dried in an oven at 45 °C for 24 h and used for further measurements, through which we found that amorphous calcium carbonate was better stabilized in the surrounding conditions at 15 °C with 5000 mg L−1 G0.5 additive.Characterization
The morphology of the ACC samples was determined using a scanning electron microscope (SEM) on a Zeiss ∑IGMA at an accelerating voltage of 10 kV. Samples were fixed with adhesive conducting pads. Structural qualitative identification of CaCO3 was conducted via Raman microscopy using a Renishaw Via-Raman microscope equipped with a solid state 250 mW laser at 785 nm, and FTIR spectral measurements were performed on a Tensor 27 using KBr pellets at a scanning rate of 5 times per minute. The PEAKFIT V4.12 software was used to refine the Raman shifts. All off-line solids were characterized via powder X-ray diffraction (pXRD) on a Rigaku D/max 2200pc diffractometer fitted with a Cu-Kα (1.54 Å) radiation source under the setting conditions of 40 kV, 20 mA. Approximately 5–8 mg samples were weighed into a platinum crucible. Simultaneous TG measurements were performed using a ULVAC TGD-9600 at a heating rate of 15 K min−1 under flowing N2 (60 cm3 min−1). Elemental analysis was carried out using an energy dispersive X-ray analyzer (EDX), which was directly connected with the SEM at an accelerating voltage of 20 kV. The pH and electrical conductivity data were recorded on-line using a PHS-3C Precision pH/mV meter and DDS-11A electrical conductivity meter, respectively. The surface tension of the entire solution was measured on a QBZY-2 surface tension meter using the Wilhelmy platinum plate method and the contact angle of ACC was determined using a DS-360A contact angle meter, which could accurately describe the surface energy of particles and the variation in the nucleation stage.Conclusions
This study presented the role of G0.5 PAMAM dendrimers in the precipitation of calcium carbonate. Although this was already proven by preliminary experiments, our experimental results provide more powerful evidence and the mechanism that multiple functions of G0.5 stabilize nano-ACC and prevent the transformation of ACC to calcite (via vaterite) in strongly basic aqueous systems. The precipitation process of nano-ACC is divided into primary/secondary nucleation stages and fast/slow growth stages, which are analogous to a thermodynamic–kinetic model except for the lifetime and particle size.15 The electrostatic repulsion between G0.5 and CO32− ions results in a disordered distribution leading to a CO32− rich phase during the primary nucleation and secondary nucleation stages21 and the G0.5–Ca2+ complex restrictively releases Ca2+. This caused the fast/slow growth stages to proceed slowly, where the C–O symmetrical stretching vibration in the carbonate lattice mode is confined in the direction of the growth edges or sites. The surface tension of the precipitation solution is related to kinetics factors and indirectly reflects the Gibbs free energy barrier, which could lower the nucleation rate.16,17 In addition, the on-line data collection method involving pH and electrical conductivity is an effective strategy to explore the precipitation mechanism and process of ACC, which could detect the stability of the metastable phase originating from the slower transport of ions and nucleation rate of the precursor particles. This method provided a route to obtain desired properties such as polymorphism, specific size distribution, extra long stable lifetime and even steady synthetic process. These results suggest that almost all processes of the fast reaction and fast crystallization via an amorphous phase or unstable metastable phase would be difficult to identify. Moreover, the relationship between the different generations of dendrimer, structural H2O, stabilization and polymorph of ACC is still poorly understood. Further studies are required to characterize the transformation process using in situ methods, synchrotron radiation techniques or three-dimensional imaging methods to fully understand the formation mechanisms and kinetics of this material.Conflicts of interest
There are no conflicts to declare.Acknowledgements
This study was financial supported by National Natural Science Foundation of China (grant No. 51404069), the State Key Laboratory Opening Project Foundation of Jilin University, Research Project of Northeast Petroleum University and Graduate Student Innovation Research Project of Northeast Petroleum University (grant No. YJSCX2017-017NEPU). We are grateful to Zhaohui Dong of Shanghai Synchrotron Radiation Facility (SSRF) for characterization suggestions and microscopic test center of the Northeast Petroleum University.Notes and references
- C. V. Burton, Philos. Mag., 1892, 33, 191–204 CrossRef.
- J. J. De Yoreo and P. G. Vekilov, Rev. Mineral. Geochem., 2003, 54, 57–93 CrossRef CAS.
- A. Myerson, Handbook of industrial crystallization, Butterworth-Heinemann, 2002 Search PubMed.
- J. Rieger, M. Kellermeier and L. Nicoleau, Angew. Chem., Int. Ed., 2014, 53, 12380–12396 CAS.
- L. Addadi, S. Raz and S. Weiner, Adv. Mater., 2003, 15, 959–970 CrossRef CAS.
- E. Loste, R. M. Wilson and R. Seshadri, J. Cryst. Growth, 2003, 254, 206–218 CrossRef CAS.
- Y. Politi, D. R. Batchelor and P. Zaslansky, Chem. Mater., 2009, 22, 161–166 CrossRef.
- D. Gebauer, H. Cölfen and A. Verch, Adv. Mater., 2009, 21, 435–439 CrossRef CAS.
- D. Tobler, J. Rodriguez, J. D. Blanco and K. Dideriksen, Adv. Funct. Mater., 2015, 25, 3081–3090 CrossRef CAS.
- D. Gebauer, P. N. Gunawidjaja and J. Y. Ko, Angew. Chem., 2010, 122, 9073–9075 CrossRef.
- J. J. J. M. Donners, B. R. Heywood and E. W. Meijer, Chem.–Eur. J., 2002, 8, 2561–2567 CrossRef CAS.
- B. Guillemet, M. Faatz and F. Gröhn, Langmuir, 2006, 22, 1875–1879 CrossRef CAS PubMed.
- J. Bolze, B. Peng and N. Dingenouts, Langmuir, 2002, 18, 8364–8369 CrossRef CAS.
- Y. Tanaka and K. Naka, Polym. J., 2010, 42, 676–683 CrossRef CAS.
- A. Carino, A. Testino, M. R. Andalibi, F. Pilger, P. Bowen and C. Ludwig, Cryst. Growth Des., 2017, 17, 2006–2015 CAS.
- A. E. Nielsen, Kinetics of Precipitation, Oxford: Pergamon Press, 1964 Search PubMed.
- A. Testino, V. Buscaglia and M. T. Buscaglia, Chem. Mater., 2005, 17, 5346–5356 CrossRef CAS.
- S. C. Huang, K. Naka and Y. Chujo, Langmuir, 2007, 23, 12086–12095 CrossRef CAS PubMed.
- X. Wang, R. Kong and X. Pan, J. Phys. Chem. B, 2009, 113, 8975–8982 CrossRef CAS PubMed.
- J. Rieger, T. Frechen and G. Cox, et al., Faraday Discuss., 2007, 136, 265–277 RSC.
- Y. Y. Kim, J. D. Carloni and B. Demarchi, Nat. Mater., 2016, 15, 903–910 CrossRef CAS PubMed.
- D. J. Tobler, B. J. D. Rodriguez and H. O. Sørensen, Cryst. Growth Des., 2016, 16, 4500–4508 CAS.
- H. W. Wang, L. L. Daemen and M. C. Cheshire, Chem. Commun., 2017, 53, 2942–2945 RSC.
- M. P. Schmidt, A. J. Ilott and B. L. Phillips, Cryst. Growth Des., 2014, 14, 938–951 CAS.
- N. Koga, Y. Nakagoe and H. Tanaka, Thermochim. Acta, 1998, 318, 239–244 CrossRef CAS.
- C. Rodriguez-Navarro, K. Kudłacz and Ö. Cizer, CrystEngComm, 2015, 17, 58–72 RSC.
- R. Demichelis, P. Raiteri, J. D. Gale, D. Quigley and D. Gebauer, Nat. Commun., 2011, 2, 590 CrossRef PubMed.
- S. E. Wolf, L. Muller, R. Barrea, C. J. Kampf, J. Leiterer, U. Panne, T. Hoffmann, F. Emmerling and W. Tremel, Nanoscale, 2011, 3, 1158–1165 RSC.
- L. Balogh and D. A. Tomalia, J. Am. Chem. Soc., 1998, 120, 7355–7356 CrossRef CAS.
- J. D. Rodriguez-Blanco, S. Shaw and L. G. Benning, Nanoscale, 2011, 3, 265–271 RSC.
- D. C. Green, J. Ihli and Y. Y. Kim, et al., Cryst. Growth Des., 2016, 16, 5174–5183 CAS.
- J. Wang, C. Q. Li, S. Y. Zhang, F. Sun and T. J. Ge, Chin. Chem. Lett., 2008, 19, 43–46 CrossRef CAS.
- M. F. Ottaviani, S. Bossmann and N. J. Turro, J. Am. Chem. Soc., 1994, 116, 661–671 CrossRef CAS.
- D. A. Tomalia, A. M. Naylor and W. A. Goddard, Angew. Chem., Int. Ed., 1990, 29, 138–175 CrossRef.
- Y. Kojima, A. Kawanobe, T. Yasue, Y. Arai and J. Ceram, J. Ceram. Soc. Jpn., 1993, 101, 1145–1152 CrossRef CAS.
Footnote |
| † Electronic supplementary information (ESI) available: Additional characterizations of the CaCO3 precipitates are provided. See DOI: 10.1039/c7ra07169h |
| This journal is © The Royal Society of Chemistry 2017 |

